


This cross-sectional study aims to record post-traumatic stress (PTS) and post-traumatic growth (PTG) of the general population of China during the first wave of COVID-19 spread. Method: An online survey was distributed in China during February and March 2020 to record the general population's PTS (using the Post-traumatic Stress Disorder Checklist-Civilian Version, PCL-C) and PTG (using the Post-traumatic Growth Inventory, PTGI) due to COVID-19. Confirmatory Factor Analyses (CFAs) and a Two-Part Model (TPM) of regression analysis were conducted. Results: In total, 29,118 Chinese participants completed the survey (54.20% were in their 20s, 68% were males, and 60.30% had a university education). CFA results illustrated that bifactor models described the Chinese psychometric traits of PTS and PTG over the default models. Results of TPM suggested that female, low-educated, and middle-aged individuals were more vulnerable to PTS. Remarkably, mutual and positive correlations between the PTS and the PTG, though small in statistics, were observed through regression analyses. Conclusions: The current results presented new best-fit structural models, potential predictors, and valuable baseline information on the PTS and the PTG of the Chinese population in the context of COVID-19.
Este estudio transversal se realizó para registrar el estrés postraumático (EPT) y el crecimiento de estrés postraumático (CPT) de la población general de China durante la primera ola de la extensión del COVID-19. Método: Se realizó una encuesta en línea en China durante febrero y marzo del año 2020 para registrar EPT de la población (utilizando el Post-traumatic Stress Disorder Checklist-Civilian Version, PCL-C) y CPT (utilizando el Post-traumatic Growth Inventory, PTGI). Se llevaron a cabo Análisis Factorial Confirmatorio (AFC) y Modelo de Dos Partes (MDP) de análisis de regresión. Resultados: En total, 29.118 chinos completaron la encuesta (54,2% de ellos tenían 20~29 años, 68,0% eran hombres, y 60,3% tenían una Educación Universitaria). Los resultados de AFC ilustraron que los modelos de bifactoriales eran mejores para descubrir los rasgos psicométricos de EPT y CPT de los participantes chinos que los modelos predeterminados. Los resultados de MDP sugirieron que las mujeres, las personas con bajo nivel educativo y de mediana edad eran más vulnerables a EPT. Se observaron correlaciones mutuas y positivas entre EPT y CPT, aunque pequeñas. Conclusiones: Los resultados actuales presentaron nuevos modelos estructurales de mejor ajuste, predictores potenciales e información de referencia valiosa de EPT y CPT de la población China en el contexto de COVID-19.
The World Health Organization (World Health Organization, 2020) announced the coronavirus disease 2019 (COVID-19) outbreak as a pandemic on 11th March 2020. Infected by severe acute respiratory syndrome coronavirus 2 (SARS-CoV-2, Grifoni et al., 2020), patients with COVID-19 show a spectrum of respiratory symptoms (e.g., dry cough and dyspnoea) (L. Zhang et al., 2020). In addition to severe acute respiratory syndrome (SARS) and Middle East respiratory syndrome (MERS), COVID-19 is already the third coronavirus pandemic from the same coronavirus family in the 21st century (Guarner, 2020; Rabaan et al., 2020). Research on SARS and MERS illustrated that people may react to these pandemics with two opposite attitudes, namely, post-traumatic stress (PTS; Cho et al., 2020; Wu et al., 2005) and post-traumatic growth (PTG; Cheng et al., 2006). However, relative to the former coronavirus pandemics, COVID-19 exhibits a higher reproductive number but a lower case-fatality rate (Petrosillo et al., 2020; Rajgor et al., 2020). Meanwhile, the impact of SARS-CoV-2 has rampantly gone beyond a public health emergency and caused global issues with the economy (Vidya & Prabheesh, 2020), youth education (Daniel, 2020), and international relations (Pevehouse, 2020). As a consequence, it is unpredictable whether individuals’ post-traumatic reactions to COVID-19 could be more intricate than previous pandemics.
PTS is a plethora of aversive feelings that one may encounter after a traumatic event (Weathers et al., 1993). Post-traumatic stress disorder (PTSD) is the clinical diagnosis for people with severe PTS (Bisson, 2007). Initially, PTSD was defined in the third edition of the Diagnostic and Statistical Manual of Mental Disorders (DSM-III, 1980) for describing the clinical symptoms observed with World War II and Vietnam veterans (Marmar et al., 2015). These veterans with PTSD frequently felt anxiety, isolation, and other negative emotions due to the memories of the war (Crocq & Crocq, 2000). Later on, PTSD was identified with victims of sexual abuse (Weaver et al., 2014), earthquakes (Zhang & Ho, 2011), and other traumatic situations (Kubany et al., 2000). Currently, researchers from China (e.g., C. Wang et al., 2020), Italy (e.g., Forte et al., 2020), Greece (e.g., Kalaitzaki, 2020), and many other countries have been monitoring the issue of PTSD in the context of COVID-19. As China is the first nation to react to the pandemic, the Chinese post-traumatic reactions may have an essential implication for the investigation (e.g., C. Wang et al., 2020).
Intriguingly, in contrast to the aforementioned ‘negative’ reaction—PTS, people might also obtain a ‘positive’ impact—PTG (Boals & Schuettler, 2011), due to the same trauma. PTG is the spiritual growth, the strengthened interpersonal relationships, and the new purpose of life gained from a traumatic event (Osei-Bonsu et al., 2012). Researchers describe PTG as a mental technique to repair broken hearts just as Chinese Juci or Japanese Kintsugi did for fixing cracked pottery (Walton, 2020). Remarkably, both of the handcraft techniques would not only restore the practical function of the pottery but also lift the aesthetic beauty of it (Walton, 2020); congruously, PTG is deemed as the nutrient to post-traumatic life and a tonic for being optimistic for the future (Jansen et al., 2011). In the case of COVID-19, researchers have predicted that it will bring PTG to people in tandem with PTS (Greenberg & Hibbert, 2020), which is supported by studies in Spain (Vazquez et al., 2021) and Turkey (Ikizer, Karanci, Gul, & Dilekler, 2021).
The predictors of PTS and PTG should be researched for each traumatic context. In the context of COVID-19, some stressors of PTS have been locked on. For example, victims of COVID-19 (Xiao et al., 2020), clinical workers (Blekas et al., 2020), and quarantined individuals (Wathelet et al., 2021) are deemed as high-risk cohorts of PTS. Specifically, clinical workers without a life partner (i.e., unmarried, divorced, and widowed) are likely to suffer more PTS than those in a marriage (d'Ettorre et al., 2021). In addition, amongst the general population, females (Liu et al., 2020) and low-educated people (L. Liang et al., 2020) may encounter more PTS than their counterparts.
Nevertheless, some research gaps remained as for the potential predictors. First, researchers have not concurred whether younger (González-Sanguino et al., 2020) or older people (Di Tella et al., 2020) are more vulnerable to PTS due to COVID-19. Second, whether the relationship between age and PTS is linear as for COVID-19 should be questioned. Third, it was found that perceived risk (e.g., feeling unsafe), negative mood (e.g., anxiety), adverse physical reactions (e.g., insomnia), as well as PTS were locked in a vicious circle for clinical workers combating COVID-19 (Yin et al., 2021). However, whether this strong linkage can be generalized to the general population is indeterminate.
Meanwhile, the relationship between PTS and PTG is under debate. Some researchers deemed that PTS and PTG are ‘two cancel-out extremes’ (Frazier et al., 2001), while others proposed that they are ‘two facets’ of a traumatic reaction (Solomon & Dekel, 2007). Intuitively, PTS and PTG ought to be a pair of rivals; that is, feeling the PTG should prevent individuals from experiencing the PTS, and vice versa (i.e., the ‘two cancel-out extremes’ theory) (Frazier et al., 2001). Theoretically, PTG promotes the repair of damage caused by PTS; hence, the worse the PTS, the stronger the PTG ought to be induced (i.e., the ‘two facets’ theory) (Solomon & Dekel, 2007). Empirically, the observation that males gain more PTG (Zhou et al., 2020), while females suffer more PTS (Liu et al., 2020) seems to support the ‘two cancel-out extremes’ theory (Frazier et al., 2001). Nevertheless, positive correlations between PTS and PTG are frequently observed in the context of COVID-19 (Vazquez et al., 2021), which was consistent with the prediction of the ‘two facets’ theory (Solomon & Dekel, 2007). The relationship between PTS and PTG deserves more attention as it may forecast whether the ongoing impact of COVID-19 is likely to be a ‘vicious circle’ (X. Liang et al., 2020) or a ‘phoenix renascence’ (Tamiolaki & Kalaitzaki, 2020).
This study aims to evaluate the self-report PTS and PTG with the general Chinese population at the first peak of the COVID-19 spread in China. The purpose of this study is three-fold: (1) to record PTS and PTG of the general population due to COVID-19; (2) to explore the predictors of PTS and PTG, including the basic demographic information (e.g., sex and education), COVID-19 pandemic-related information (e.g., diagnosis and quarantine), psychological and physical reactions to COVID-19 (e.g., avoidance and insomnia), and on-the-spot mood (e.g., happy or sad on the testing day); (3) to examine the underlying relationship between PTS and PTG after the above predictors were controlled (i.e., hierarchical regression analyses). Referencing the previous publications, we predicted that being female (e.g., Liu et al., 2020), low-educated (e.g., L. Liang et al., 2020), quarantined (e.g., Wathelet et al., 2021), diagnosed with COVID-19 (e.g., Xiao et al., 2020), and clinical workers (e.g., Blekas et al., 2020), and having negative psychological or physical reactions to the pandemic (e.g., Yin et al., 2021) could all be stressors of PTS. More importantly, anticipating a ‘phoenix renascence’ (Tamiolaki & Kalaitzaki, 2020), we propose a mutual positive prediction between the PTS and the PTG.
MethodParticipantsAn online survey was conducted from February to March 2020 in China. During this period, the key events that happened in China should be mentioned: (1) from the 23rd of January to the 8th of April 2020, Wuhan was officially in a lockdown for 76 days; (2) in China (covering the mainland, Hong Kong, and Macao for the current study purpose), the number of new confirmed cases and deaths due to COVID-19 peaked in February (i.e., 69,550 cases and 2,622 deaths) and were significantly reduced in March (i.e., 2,858 cases and 469 deaths); (3) during the Chinese New Year holiday (i.e., from the 24th of January to the 2nd of February), the Chinese government recommended that the general population stay at home to avoid the virus spreading, and wear masks when they had to go to public places; (4) from the 2nd of February, people were encouraged to go back to work as usual, but should wear proper personal protection.
The current sample was collected from three areas of China (viz., the mainland, Hong Kong, and Macao) by two research centers. The two online surveys used by these research centers were slightly different on the question of age. One survey required participants to provide their date of birth; in total, 25,757 questionnaires were collected, including eight participants who left their year of birth as 2020 by mistake (i.e., age ≤ 0) and one questionnaire submitted by a Chinese person living overseas. Another online survey asked the age range of participants (i.e., the ‘< 20’, ‘20s’, ‘30s’, ‘40s’, ‘50s’, ‘60s’, and ‘≥70’); in sum, 3,371 questionnaires were submitted, including one questionnaire submitted by another Chinese person living overseas. The eight questionnaires with the age issue and the two submitted by the Chinese living overseas (n = 10) were excluded from further analyses. Except for the aforementioned issues, there was no other issue (e.g., no other missing value). Then, we combined the data collected by both centers and treated participant's age as a categorical variable.
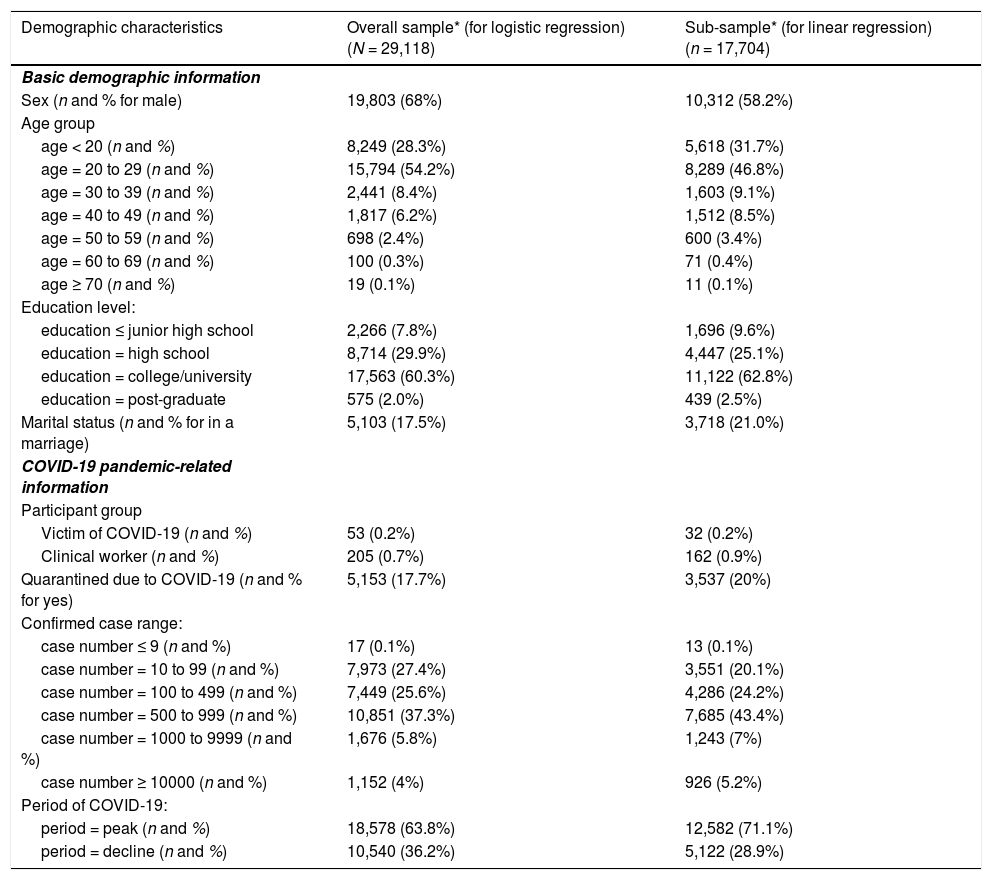
The final sample size was 29,118 (54.2% were in their ‘20s’, 68.0% were males, and 60.3% had a university education; see Table 1). The mean age based on the available date of birth was 23.47 (SD = 7.26). All participants provided their informed consent online. Each participant had a chance to draw for a prize as a reimbursement (RMB¥10-100, winning rate = 20%). The current investigation was conducted in accordance with a protocol approved by the ethics committee of the Army Medical University.
Demographic information for the current participants recruited during COVID-19 in China.
| Demographic characteristics | Overall sample* (for logistic regression) (N = 29,118) | Sub-sample* (for linear regression)(n = 17,704) |
|---|---|---|
| Basic demographic information | ||
| Sex (n and % for male) | 19,803 (68%) | 10,312 (58.2%) |
| Age group | ||
| age < 20 (n and %) | 8,249 (28.3%) | 5,618 (31.7%) |
| age = 20 to 29 (n and %) | 15,794 (54.2%) | 8,289 (46.8%) |
| age = 30 to 39 (n and %) | 2,441 (8.4%) | 1,603 (9.1%) |
| age = 40 to 49 (n and %) | 1,817 (6.2%) | 1,512 (8.5%) |
| age = 50 to 59 (n and %) | 698 (2.4%) | 600 (3.4%) |
| age = 60 to 69 (n and %) | 100 (0.3%) | 71 (0.4%) |
| age ≥ 70 (n and %) | 19 (0.1%) | 11 (0.1%) |
| Education level: | ||
| education ≤ junior high school | 2,266 (7.8%) | 1,696 (9.6%) |
| education = high school | 8,714 (29.9%) | 4,447 (25.1%) |
| education = college/university | 17,563 (60.3%) | 11,122 (62.8%) |
| education = post-graduate | 575 (2.0%) | 439 (2.5%) |
| Marital status (n and % for in a marriage) | 5,103 (17.5%) | 3,718 (21.0%) |
| COVID-19 pandemic-related information | ||
| Participant group | ||
| Victim of COVID-19 (n and %) | 53 (0.2%) | 32 (0.2%) |
| Clinical worker (n and %) | 205 (0.7%) | 162 (0.9%) |
| Quarantined due to COVID-19 (n and % for yes) | 5,153 (17.7%) | 3,537 (20%) |
| Confirmed case range: | ||
| case number ≤ 9 (n and %) | 17 (0.1%) | 13 (0.1%) |
| case number = 10 to 99 (n and %) | 7,973 (27.4%) | 3,551 (20.1%) |
| case number = 100 to 499 (n and %) | 7,449 (25.6%) | 4,286 (24.2%) |
| case number = 500 to 999 (n and %) | 10,851 (37.3%) | 7,685 (43.4%) |
| case number = 1000 to 9999 (n and %) | 1,676 (5.8%) | 1,243 (7%) |
| case number ≥ 10000 (n and %) | 1,152 (4%) | 926 (5.2%) |
| Period of COVID-19: | ||
| period = peak (n and %) | 18,578 (63.8%) | 12,582 (71.1%) |
| period = decline (n and %) | 10,540 (36.2%) | 5,122 (28.9%) |
Note.
The current study conducted the TPM (i.e., logistic-part and linear-part regressions) based on the overall sample (N = 29,118) and the sub-sample with mild to severe post-traumatic stress (i.e., PCL-C > 18, n = 17,704), respectively (see more details in the Method section). Age group: due to the small sample size of seniors, the categories of ‘age = 60 to 69’ and ‘age ≥ 70’ were combined into ‘age ≥ 60’ for further analyses. Confirmed case range = the range of accumulated COVID-19 confirmed case numbers in one’s residential region.
Demographic sheet. A demographic sheet was designed by the current research team referencing previous publications of PTS and PTG in the context of COVID-19, and was presented in Chinese characters for the current participants. Collected information covered four parts, namely, basic demographic characteristics (e.g., age and sex), COVID-19 pandemic-related information (e.g., diagnosis and quarantine), psychological and physical reactions to COVID-19 (e.g., risk perception and insomnia), and on-the-spot mood (i.e., how anxious, angry, sad, fearful, and happy the participant felt on the testing day; each item was evaluated on a 5-point Likert scale, 0 = not at all to 4 = extremely strong). Since participants’ responses to these on-the-spot moods were not all normally distributed, we dummy coded each on-the-spot mood (0 = not at all and 1 = slightly to extremely strong) for the following analyses. A sample of the key questions of the demographic sheet can be acquired from the corresponding author (or by downloading supplementary documents from http://www.hulilab.com/home/viewshare/29).
PTSD Checklist-Civilian Version (PCL-C). The PCL-C is a 17-item self-report scale for examining PTSD symptoms (Weathers et al., 1993). Each item is rated on a 5-point Likert scale, ranging from 1 (not at all) to 5 (extremely). A Chinese translated version of the PCL-C was administered in the current study (Yang et al., 2007). The PCL-C total score is recommended for analyzing the overall PTSD symptoms of participants (Weathers et al., 1993). According to previous publications, Cronbach's α of the 17 PCL-C items ranged from .91 to. 97 based on both Western and Chinese participants (Li et al., 2010; L. Wang et al., 2011; Weathers et al., 1993). To date, one research gap is that the best-fit structural/scoring model of the PCL-C ad hoc Chinese people in the context of COVID-19 has not been explored by previous researchers. Therefore, the model fitness of a series of available structural models of the PCL-C, such as the three-factor (Weathers et al., 1993), the second-order, and the bifactor models (Reise, 2012), was examined with the current data (see more information in supplementary documents).
Post-traumatic Growth Inventory (PTGI). The PTGI is a 21-item self-report scale for examining one's positive psychological adaptations after a traumatic event (Tedeschi & Calhoun, 1996). Each item of the PTGI is rated on a 6-point Likert scale, ranging from 0 (I did not experience this change) to 5 (I experienced this change to a very great degree). Its Chinese translated version (Ho et al., 2004) was administered in this study. Researchers have proposed the PTGI total score as reflecting an individual’s overall extent of post-traumatic growth. According to the previous publications, Cronbach's α of the 21 items of the PTGI was around.90 as per both Western and Chinese participants (e.g., Tedeschi & Calhoun, 1996; Tedeschi & Calhoun, 1996N. Zhang et al., 2020). Similar to the PCL-C, the best-fit model of the PTGI for Chinese participants in terms of COVID-19 was unclear. Therefore, we examined the model fitness of the current data with available structural models of the PTGI, including the five-factor model for its full-length version (i.e., PTGI-21; Tedeschi & Calhoun, 1996) and the three-factor model for its short-length version (i.e., PTGI-13; Weiss & Berger, 2006). Meanwhile, referencing Reise (2012), the second-order model and the bifactor model were also evaluated for the PTGI (Prati & Pietrantoni, 2014) (see more details in supplementary documents).
Statistical analysisConfirmatory factor analyses (CFAs) were conducted to evaluate the structural model fitness for PCL-C and PTGI using Mplus 8.2 (Muthén & Muthén, 1998–2012). In this study, the WLSMV and the MLM were used for CFAs of the PCL-C (i.e., 5-point with asymmetrical distribution) and the PTGI (i.e., 6-point with non-normal distribution), respectively (Gao et al., 2020; Muthén & Muthén, 1998–2012; Sass, 2011). In addition, referencing J. Wang and Wang (2012), the best-fit model was identified according to the comparative fit index (CFI) ≥ .95, Tucker–Lewis Index (TLI) ≥ .90, standardized root mean square residual (SRMR) ≤ .08, and root mean square error of approximation (RMSEA) ≤ .08. Independent samples t-tests of sex differences on the PCL-C and the PTGI were conducted, as well as Welch's ANOVAs of age and education differences on the two scales (Levene's tests for equality of variances were significant in this study). Games-Howell tests were carried out as post hoc comparisons for Welch's tests. According to Afifi et al. (2007), the two-part model (TPM) was conducted for the PCL-C since its distribution was highly skewed with an inflated low-score part (i.e., a large portion of participants was almost absent of PTS; 27% had PCL-C = 17 and 12.1% had PCL-C = 18). In the TPM, a logistic regression was firstly conducted for a dummy coded PCL-C (i.e., 0 = participants had PCL-C ≤ 18 vs. 1 = participants had PCL-C > 18). Secondly, a linear regression was conducted for the PCL-C score without the inflated part (i.e., based on only 1 = participants had PCL-C > 18). Meanwhile, for the sake of normality, the PCL-C score was converted (i.e., [0.30 - 1/PCL-C] × 1000) to be used in the linear regression (Keith, 2014). Moreover, referencing the previous publications, hierarchical regression was adopted for the TPM, with five steps: (1) basic demographic information; (2) COVID-19 pandemic-related information; (3) participants’ psychological and physical reactions to COVID-19; (4) participants’ on-the-spot mood; and (5) the PTGI score. Furthermore, Goral et al. (2020) recommended evaluating the prediction from the PCL-C to the PTGI as well. Therefore, we conducted two five-step hierarchical linear regressions for the PTGI (i.e., normally distributed) to mirror the TPM procedure of the PCL-C. Due to the word limitation, results of the regressions for the PTGI are available by contacting the corresponding author (or by downloading supplementary documents from http://www.hulilab.com/home/viewshare/29). Apart from the CFAs, other statistical analyses of this study were processed by SPSS Version 27 (IBM Corp).
ResultsConfirmatory Factor AnalysisPCL-C. The CFA results suggested that the original three-factor model of the PCL-C fit the current data quite well (CFI = .95, TLI = .94, RMSEA [90% CI] = .081 [.081, .082], and SRMR = .049), and the second-order model showed a similar result (CFI = .95, TLI = .94, RMSEA [90% CI] = .081 [.081, .082], and SRMR = .049). Nevertheless, the best-fit structural model of the PCL-C was a 17-item 3-factor bifactor model (CFI = .97, TLI = .96, RMSEA [90% CI] = .065 [.064, .066], and SRMR = .035). The standardized factor loading regression weights (b) of individual items to the general factor of the bifactor model ranged from .58 to .88. Cronbach's α for the three subscales of the best-fit models ranged from .85 to .86, and for the overall 17 items was .93. In the current study, the total score of PCL-C-17 was used in the further statistical analyses.
PTGI. The CFA results indicated that none of the models for the full-length version of the PTGI (i.e., PTGI-21) fitted the current data (CFI = .88, TLI = .87, RMSEA [90% CI] = .084 [.083, .085], and SRMR = .045, for the one-factor model; CFI = .89, TLI = .87, RMSEA [90% CI] = .084 [.083, .085], and SRMR = .044, for the five-factor model; and CFI = .89, TLI = .87, RMSEA [90% CI] = .084 [.083, .084], and SRMR = .045, for the three-factor model). In contrast, a 13-item 3-factor model designed by Weiss and Berger (2006) for PTGI-13 showed a good fit to the current data (CFI = .94, TLI = .93, RMSEA [90% CI] = .074 [.073, .076], and SRMR = .035). Nevertheless, Weiss and Berger (2006) reported a cross-loading issue across the 2nd and the 3rd factor of their model. Meanwhile, we identified two other issues with this model. First, Cronbach's α for the 3rd factor (i.e., 2 items) of the model was only .64. Second, Item #1 of the PTGI showed insufficient loading to this and other models that consist of Item #1 (all bs < .30). Thereafter, we combined the 2nd and the 3rd factors of Weiss and Berger's model into one factor and deleted Item #1. Results suggested that the final 12-item, 2-factor, bifactor model fitted the current data very well (CFI = .96, TLI = .94, RMSEA [90% CI] = .072 [.071, .074], and SRMR = .074). The standardized factor loading regression weights (b) of individual items to the general factor ranged from .44 to .86. Cronbach's αs for the two subscales of the best-fit model were .88 and .90, and for the overall 12 items was .94. Finally, the total score of the PTGI-12 was used in the following statistical analyses.
Sex differencesThe mean of the PCL-C-17 for the overall participants was 22.58 (SD = 7.60). A significant sex difference on the PCL-C-17 was identified (i.e., female > male, t = 36.38, p < .001, Cohen's d = 0.49, 95% CI = [3.42, 3.81]).
The mean of the PTGI-12 for the overall participants was 28.59 (SD = 14.13). A significant sex difference on the PTGI-12 was observed (i.e., male > female, t = 27.06, p < .001, Cohen's d = 0.33, 95% CI = [4.23, 4.89]).
Age-group differencesThe age-group effect on the PCL-C-17 was significant (Welch's F (5, 1080.07) = 260.25, p < .001). Games-Howell post hoc analyses revealed that the ‘20s’ had a lower PCL-C-17 score than all other five age groups (all ps < .001). Meanwhile, the middle-aged groups (i.e., the ‘40s’ and ‘50s’) had a higher PCL-C score than youth groups (i.e., the ‘< 20’, ‘20s’, and ‘30s’; all ps < .001).
There was a significant age-group effect on the PTGI-12 (Welch's F (5, 1092.12) = 50.90, p < .001). Games-Howell post hoc analyses revealed that the middle-aged groups (i.e., the ‘40s’ and ‘50s’) had a significantly higher PTGI-12 score than two youth groups (i.e., the ‘< 20’ and ‘30s’; all ps < .001). In addition, the ‘20s’ had a higher PTGI-12 score than both the ‘< 20’ and the ‘30s’ (both ps < .001).
Education-level differencesThe education-group effect on the PCL-C-17 was significant (Welch's F (3, 2305.80) = 196.02, p < .001). Games-Howell post hoc analyses indicated that the participants with the lowest education level (i.e., the ‘≤ junior high’) had a higher score than all other three groups (all ps < .001). In addition, the ‘high school’ group had a lower score than the two groups with tertiary education (i.e., ‘university’ and ‘post-graduate’, both ps < .001). Furthermore, the ‘university’ group scored lower on PCL-C-17 than the ‘post-graduate’ group (p < .001).
The education-group effect on the PTGI-12 was significant (Welch's F (3, 2358.92) = 69.07, p < .001). Games-Howell post hoc analyses suggested that the ‘post-graduate’ group had a lower score than all other three groups (all ps < .001). Moreover, the ‘university’ group reported a lower score than the two low-educated groups (i.e., ‘≤ junior high’ and ‘high school’, both ps < .001). Furthermore, the ‘≤ junior high’ group scored lower on PTGI-12 than the ‘high school’ group (p = .038).
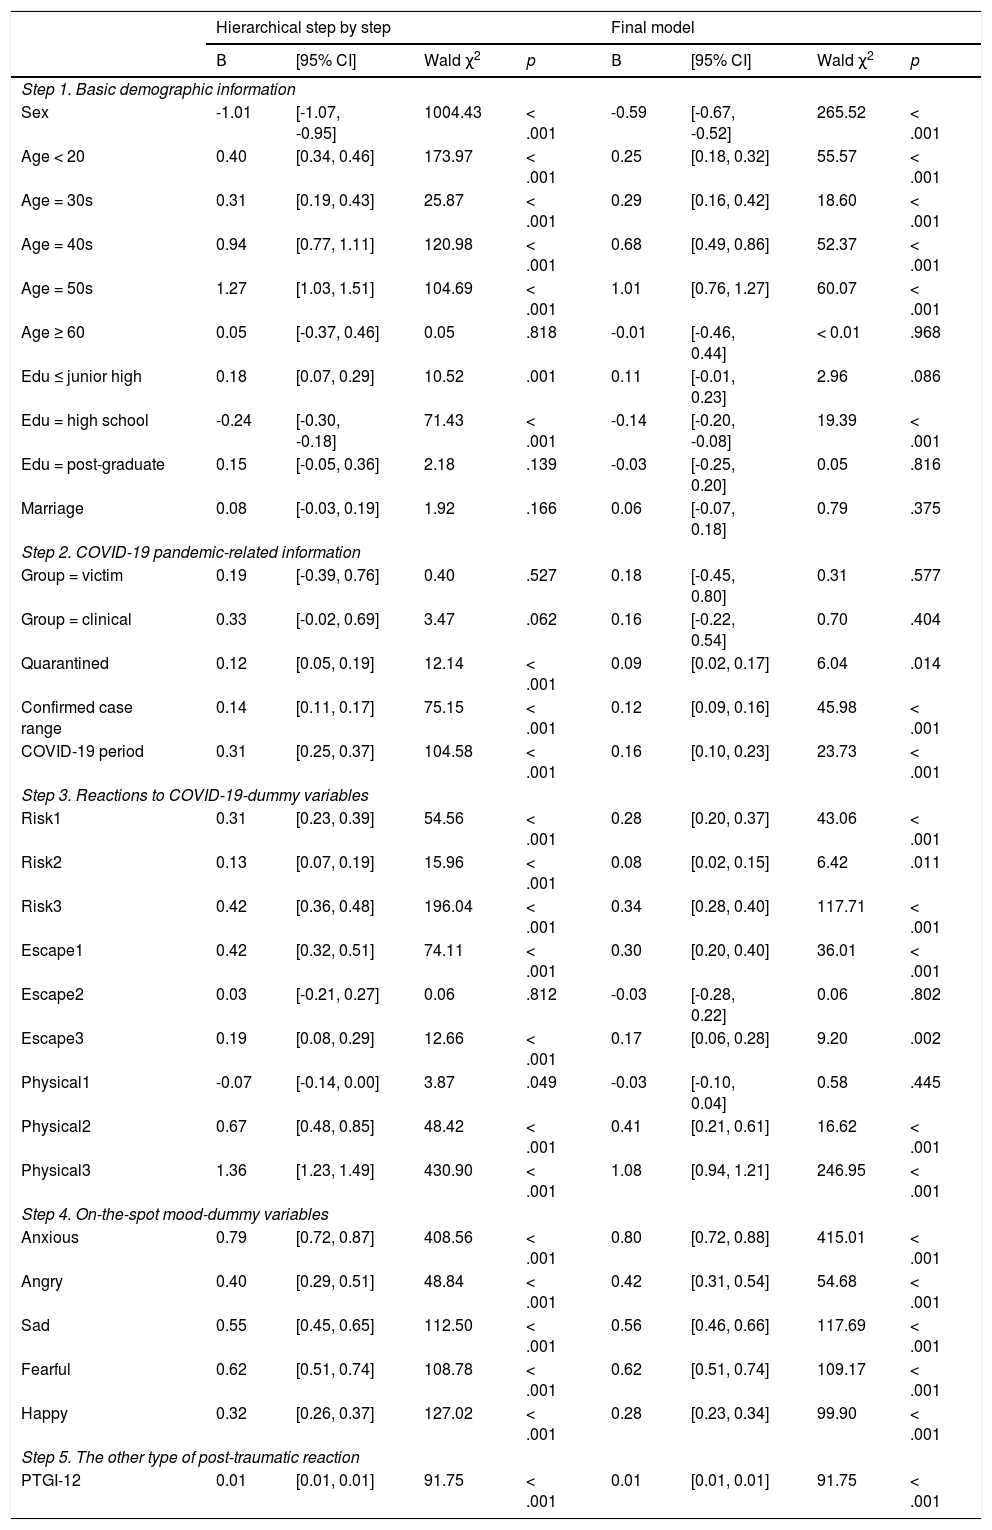
Hierarchical TPM for PCL-CFirst, results of the logistic-part regression for the PCL-C-dummy are presented in Table 2. On Step 1, the Omnibus Test suggested that the demographic variables significantly predicted the PCL-C-dummy (χ2 = 2773.44, df = 10, p < .001). On Step 2, the Omnibus Test showed that the prediction of the COVID-19 pandemic-related variables on PCL-C-dummy was significant (χ2 = 371.81, df = 5, p < .001). On Step 3, as for the variables of Reactions to COVID-19, the Omnibus Test revealed a significant result (χ2 = 1542.05, df = 9, p < .001). On Step 4, by further introducing the variables of Mood, the result of Omnibus Test was significant (χ2 = 2197.97, df = 5, p < .001). On Step 5, by adding the PTGI-12 into the regression, the Omnibus Test indicated a significant result (χ2 = 92.23, df = 1, p < .001). In sum, the Omnibus Test for the overall prediction of the 30 predictors on the PCL-C-dummy was significant (χ2 = 6977.50, df = 30, p < .001).
Logistic regression of the PCL-C-dummy based on the overall sample (N = 29,118).
Note. PCL-C = Post-traumatic Stress Disorder Checklist-Civilian Version; PTS = post-traumatic stress. PCL-C-dummy (0 = absent to almost absent of PTS [PCL-C score ≤ 18], 1 = mild to severe PTS [PCL-C score > 18]) was the dependent variable of this regression. PTGI = Post-traumatic Growth Inventory.
Continuous independent variables: Confirmed case range = the range of accumulated COVID-19 confirmed case numbers in one’s residential region (from '≤ 9' to '≥ 10000' cases); PTGI-12 = the total score of the best-fit 12-item 2-factor bifactor model of the PTGI.
Dummy coded variables: sex (0 = female, 1 = male), COVID-19 period (0 = decline, 1 = peak), and the other dummy variables (0 = no, 1 = yes). A sample of questions for Step 3 is available by contacting the corresponding author (or by downloading supplementary documents from http://www.hulilab.com/home/viewshare/29).
In the final logistic regression model of the PCL-C-dummy, significant demographic predictors (all ps < .001) were Sex (male < female, B = -0.59), Age group (each of ‘< 20’, ‘30s’ to ‘50s’ > the control group ‘20s’; Bs range = 0.25 to 1.01), and Education (‘high school’ < the control group ‘university’, B = -0.14). Meanwhile, significant COVID-19 pandemic-related predictors were Quarantined (‘Yes’ > ‘No’, B = 0.09, p = .014), Confirmed case range (B = 0.12, p < .001), and the COVID-19 period ('peak’ > ‘decline’, B = 0.16, p < .001). Furthermore, seven types of Reactions to COVID-19 (viz., Risk#1-3, Escape#1 and 3, and Physical#2 and 3; Bs range = 0.08 to 1.08, all ps ≤ .011) and all Mood variables were significant predictors (i.e., 'Anxious', 'Angry,' 'Sad,' 'Fearful', and 'Happy', all ‘Yes’ > ‘No’; Bs ranged = 0.28 to 0.80, all ps < .001). Finally, PTGI-12 positively predicted the PCL-C-dummy (B = 0.01, p < .001).
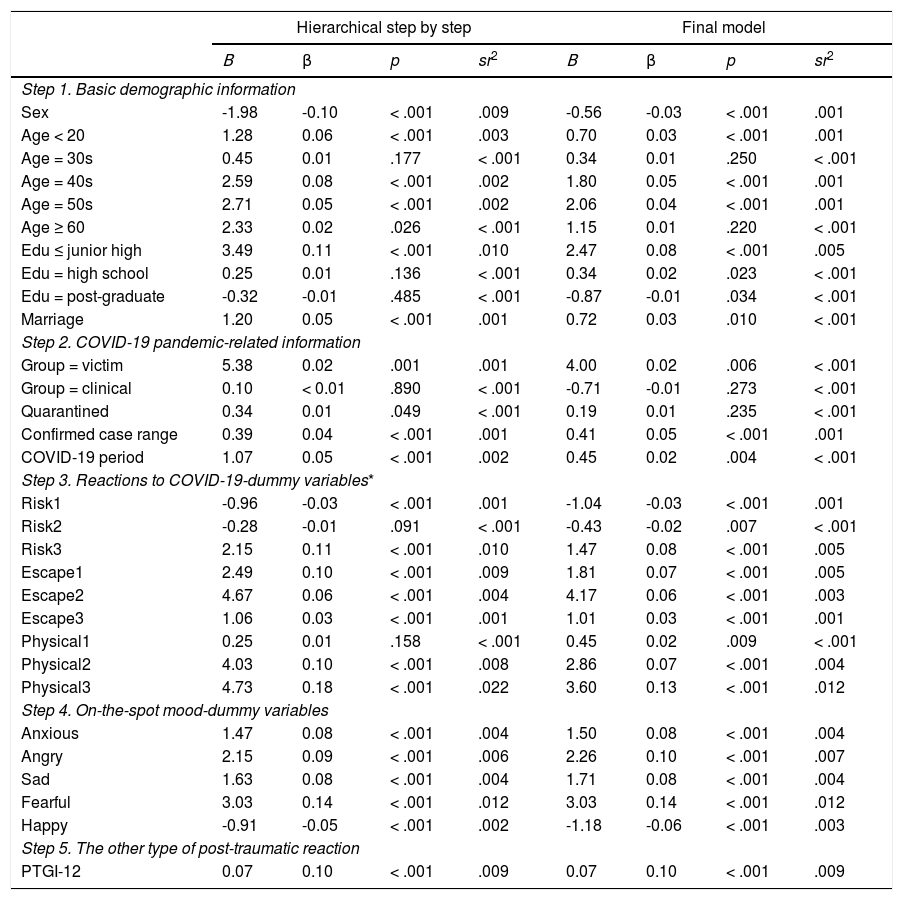
Second, results of the linear-part regression for the PCL-C-converted are given in Table 3. First of all, univariate and multivariate outliers were identified (0 univariate outlier and 12 multivariate outliers) and excluded from the linear regression analyses. Meanwhile, the assumption of the multicollinearity was not violated in the current linear regression analyses (all tolerance ≥ 0.29, all variance inflation factor values, VIF ≤ 3.46) (Allen et al., 2010). On Step 1, demographic variables accounted for 5.7% of the variance in PCL-C-converted (adjusted R2 = .06, F [10, 17693] = 106.39, p < .001). On Step 2, the COVID-19 pandemic-related variables explained a further 0.6% variance in PCL-C-converted (adjusted R2 = .06, ΔR2 = .01, ΔF [5, 17688] = 23.32, p < .001). On Step 3, variables of Reactions to COVID-19 demonstrated an extra 10% of the variance in PCL-C-converted (adjusted R2 = .16, ΔR2 = .10, ΔF [9, 17679] = 234.41, p < .001). On Step 4, variables of Mood accounted for an additional 7.8% variance in PCL-C-converted (adjusted R2 = .24, ΔR2 = .08, ΔF [5, 17674] = 364.68, p < .001). On Step 5, the PTGI-12 explained a further 0.9% variance in PCL-C-converted (adjusted R2 = .25, ΔR2 = .01, ΔF [1, 17673] = 207.91, p < .001). In total, the overall 30 predictors accounted for 25.0% of the variance in PCL-C-converted (R2 = .25, adjusted R2 = .25, F [30, 17673] = 196.29, p < .001, Cohen's f2 = .33).
Linear regression of the PCL-C-converted based on the participants with mild tosevere PTS (n = 17,704).
Note. PTS = post-traumatic stress; PCL-C = Post-traumatic Stress Disorder Checklist-Civilian Version; Since the PCL-C score was highly skewed, the dependent variable of this regression was the value of PCL-C-converted (i.e., [0.30 - 1/PCL-C] × 1000); PTGI = Post-traumatic Growth Inventory.
Continuous independent variables: PTGI-12 = the total score of the best-fit 12-item 2-factor bifactor model of the PTGI.
Dummy coded independent variables: sex (0 = female, 1 = male), COVID-19 period (0 = decline, 1 = peak), and the other dummy variables (0 = no, 1 = yes). A sample of questions for Step 3 is available by contacting the corresponding author (or by downloading supplementary documents from http://www.hulilab.com/home/viewshare/29).
In the final linear regression model of the PCL-C-converted, significant demographic predictors were Sex (male < female, β = -.03, p < .001), Age group (each of ‘< 20’, ‘40s’, and ‘50s’ > the control group ‘20s’; βs range = .03 to .05, ps < .001), Education (both of ‘≤ junior high’ and ‘high school’ > the control group ‘university’, βs range = .02 to .08, ps ≤ .023; while ‘post-graduate’ < the control group ‘univeristy’, β = -.01, p = .034), and Marriage (‘in marriage’ > ‘not in marriage’, β = .03, p = .010). In addition, significant COVID-19 pandemic-related predictors were the COVID-19 Victim (‘victim’ > ‘others’, β = .02, p = .006), Confirmed case range (β = .05, p < .001), and the COVID-19 period (‘peak’ > ‘decline’, β = .02, p = .004). Meanwhile, as for variables of Reactions to COVID-19, there were two negative predictors (viz., Risk#1 and Risk#2, βs range = -.02 to -.03, both ps ≤ .007) and seven positive predictors (viz., Risk#3, Escape#1-3, and Physical#1-3, βs range = .02 to .13, ps ≤ .009). Furthermore, the predictions of all Mood variables were significant (all ps < .001), with 'Happy' as a negative predictor (‘Yes’ < ‘No’, β = -.06) and all other negative moods as positive predictors (i.e., 'Anxious', 'Angry', 'Sad', and 'Fearful', all ‘Yes’ > ‘No’; βs ranged = .08 to .14). Finally, the PTGI-12 positively predicted the PCL-C-converted (β = .10, p < .001).
DiscussionThe current cross-sectional study aims to record both the negative and positive post-traumatic reactions (i.e., PTS and PTG) toward COVID-19 with the general Chinese population (N = 29,118), and to explore the possible predictors as well as the underlying relationship of these two post-traumatic reactions. Using CMA analyses, we first verified two new bifactor models for describing the psychometric properties of Chinese self-evaluations on the PTS and the PTG. Conducting t-tests and Welch's ANOVAs, we pinpointed the cohorts of Chinese with high-PTS [female, low-educated (i.e., '≤ junior high'), and middle-aged individuals (i.e., '40s' and '50s')] as well as those with low-PTG [female, highly-educated (i.e., 'post-graduate'), and the young and the old (i.e., '< 20' and '≥ 60')]. Finally, adopting TPM and hierarchical regression analyses, we explored the impact of participants’ attitudes (e.g., avoidance) and on-the-spot moods (e.g., fear) on the PTS and the PTG, and captured the mutual and positive predictions between PTS and PTG (see Tables 2 and 3, and the online supplementary documents). The current findings presented the treasured baseline information for further studies of the long-term post-traumatic impact of COVID-19. More essentially, the underlying positive relationship between PTS and PTG, though small in statistics, implied a ‘phoenix renascence’ in the era of post-COVID-19 (Tamiolaki & Kalaitzaki, 2020).
The main implications and the most innovative findings of the current study are three-fold. First, the current authors have been concerned that participants’ psychometric characteristics in evaluating the PCL-C and the PTGI items could be varied amongst populations as well as traumatic circumstances. Therefore, the current authors conducted the CMA analyses. Results showed that rather than the default models of the two scales, the bifactor structure proposed by Reise (2012) was the best structural model of the PCL-C and the PTGI as per the current data. More importantly, the CMA results highlighted that only selected items of the PTGI (i.e., 12 items) described by Weiss and Berger (2006) should be used to evaluate the PTG with the current participants in the context of COVID-19. Interestingly, although some other researchers also recommended the short versions of the PTGI (e.g., 10- or 12-item) ad hoc COVID-19, their proposals were mainly due to the time consumption issue instead of empirical evidence (e.g., Robles-Bello, Sánchez-Teruel, & Naranjo, 2020; Vazquez et al., 2021). The current results bridged this research gap.
Second, previous researchers commonly conducted linear regressions on the PCL-C. Nevertheless, the current data illustrates a highly skewed distribution of the PCL-C in the general population (i.e., with an inflated portion of participants being almost absent of PTS, 39.2%). This type of distribution severely violated the normality assumption for conducting linear regressions (Afifi et al., 2007). Instead, Afifi et al. (2007) recommended the TPM procedure (i.e., logistic-part and linear-part regressions; see Tables 2 and 3). The current results of TPM revealed some important findings. According to the linear regression of PCL-C-converted, a feeling of happiness on the testing day was a negative predictor (i.e., a protector) of PCL-C-converted, while the other negative emotions (i.e., anxiety, anger, sadness, and fear) were positive predictors (i.e., stressors) of PCL-C-converted. However, according to the logistic regression of the PCL-C-dummy (i.e., 0 = almost absent of PTS vs. 1 = mild to severe PTS), all emotions were positive predictors. Similarly, two items of the Risk perceptions (Risk#1 = COVID-19 is a severe outbreak; Risk#2 = COVID-19 is close to me.) were protectors of PCL-C-converted, but were stressors of the PCL-C-dummy. Innovatively, the current results implied that the absence of PTS in some individuals could be due to their insensitivity to the changes of their inner emotions and external risks. This innovative proposal waits to be verified by further empirical studies tapping into both the PTS and these sensitivities. Nevertheless, it should be noted that without the TPM, the above intriguing findings could not be revealed. As far as the current authors are aware, this is the first study of the TPM on PTS in the context of COVID-19.
Third, the current findings revealed that the relationships between age and the post-traumatic reactions (i.e., PTS and PTG) were not linear (see the online supplementary documents). Noticeably, previous researchers frequently tapped into their linear relationships and observed inconsistent results (e.g., Chi et al., 2020; Di Tella et al., 2020; González-Sanguino et al., 2020). In this study, we found that the middle-aged Chinese participants (i.e., '40s' and '50s') reported the highest PTS together with the highest PTG, which was in line with the ‘two facets’ theory (Solomon & Dekel, 2007). Concurrently, the proposed ‘phoenix renascence’ (Tamiolaki & Kalaitzaki, 2020) could appear in these middle-aged Chinese cohorts (i.e., r between PTGI and PCL-C-converted = .18 for these middle-aged participants, but < .01 for the overall sample). To date, COVID-19 has already turned into a multi-faceted crisis, covering areas of health, economy, education, and international relationships (see the Introduction section). The current authors are concerned that relative to other age groups, the middle-aged Chinese people might receive the highest pressure to actively cope with all of these life changes (e.g., family income, education for children, aged care for parents, etc.), resulting in the enhanced PTS/G. This theoretical proposal waits to be confirmed by empirical studies.
Similarly, the relationship between education and PTS/G was curvilinear. Nonetheless, the previous conclusions of ‘lower-educated individuals suffering more PTS’ were mainly based on a linear assumption (L. Liang et al., 2020). The current results suggested that, along with education levels, the trajectory of PTS due to COVID-19 was a ‘∪’, while that of the PTG was a ‘∩’. The opposite curviness matched well with the ‘two cancel-out extremes’ theory (Frazier et al., 2001). Specifically, people with moderate education (i.e., ‘high school’) had the lowest PTS but highest PTG (i.e., r between their PTGI and PCL-C-converted = .02). An explanation of the above effect could include three points. First of all, some researchers found that the level of intelligence tends to be negatively correlated with PTS (Barry et al., 2012; Kildahl, Bakken, Iversen, & Helverschou, 2019). Secondly, Chinese people with higher education (i.e., ‘university’ and ‘post-graduate’) may be more stressed to maintain their higher living standard (e.g., pay off the house loan and credit cards) under the circumstance of COVID-19. Finally and unexpectedly, some evidence suggested that intelligence could also be negatively correlated with PTG (Goldberg Looney, 2017). Consistently, the ‘∩’ curve of the PTGI identified with the current participants indicated a possible ceiling effect of mental growth in light of education. In all, moderately educated Chinese individuals (i.e., moderate social pressures and living standards) turned out to have the optimal combination of the PTS and the PTG due to COVID-19.
Besides the above main findings, a few interesting minor findings are worth mentioning. First of all, in line with a previous study (Liu et al., 2020), PTS due to COVID-19 was higher for female than male participants. Researchers generally concur with the above sex effect on PTS (Carmassi et al., 2020; Olff, 2017), but its underlying reason was unclear. According to cross-cultural researchers (Zhao et al., 2018; Zhao et al., 2019; Zhao et al., 2020), Chinese females are known to have high empathic personal distress (i.e., the aversive feelings when witnessing others’ sufferings) as well as a high interdependent self-construal (i.e., a blurred boundary between ‘self’ and ‘others’). Hence, facing COVID-19, Chinese females might encounter double-fold stress (i.e., PTS together with personal distress). Similarly, marriage was found to be a stressor of PTS in this study, which is contrary to the findings of Western and Asian clinical workers (e.g., d'Ettorre et al., 2021). On the one hand, the previous researchers stated that living with a life partner was a protector of PTS for clinical workers fighting COVID-19 (d'Ettorre et al., 2021), but the negative impact on the mental wellness of their partners was a concern (Ying et al., 2020). On the other hand, relative to Westerners, researchers found that Chinese (both females and males) suffered more empathic personal distress (Zhao, Neumann, Yan, Djekic, & Shum, 2021) and were with a stronger interdependent self-construal (Zhao et al., 2019). Therefore, in the context of COVID-19 (i.e., a stressful event for both sides of a marriage), married Chinese people might experience the double-fold stress as well. Finally, the current results showed that physical reactions (e.g., losing appetite and insomnia) are significant stressors of PTS. Intriguingly, researchers found that regular physical exercise could be a protector of mental problems due to COVID-19 (Carriedo et al., 2020; Y. Zhang et al., 2020), and physical exercise is known to have a benign impact on appetite (Bilski, Teległów, Zahradnik-Bilska, Dembiński, & Warzecha, 2009; Blundell, Gibbons, Caudwell, Finlayson, & Hopkins, 2015) and sleep quality (Baron, Reid, & Zee, 2013; Passos, Poyares, Santana, Tufik, & Mello, 2012). Therefore, future researchers may consider incorporating physical exercise in the mental supporting programs for coping with COVID-19.
This investigation has several limitations. First, the current study was a cross-sectional investigation on the first wave of the virus spread; however, to understand the post-traumatic impact of COVID-19 on the general population, longitudinal observations are highly recommended (e.g., Brailovskaia & Margraf, 2020). Second, although the current sample was large, participants recruited online might not represent the entire general population as for the PTS/G traits. Further investigation might consider recruiting participants according to census reports. Third, not all of the variance of PTS/G could be explained by the independent variables investigated in this study. Researchers proposed that personality traits (e.g., resilience and optimism; Kaye-Kauderer et al., 2021), philosophical views of the world (e.g., benevolence and humanity; Vazquez et al., 2021), and engagement in physical activities (Carriedo et al., 2020; Y. Zhang et al., 2020) may all have an impact on individuals’ post-traumatic reactions. Including these psychological and physical factors might be able to explain individual differences in the PTS/G to a larger extent, which should be considered in further investigations. Fourth, the underlying diseases (e.g., diabetes and cardiovascular diseases) were not collected from the participants. However, as an underlying disease may increase one's vulnerability to COVID-19 (e.g., diabetes Bello-Chavolla et al., 2020), it is worthy of research attention.
Finally, because we had limited research funding and human resources, and the current sample size was big, we had to use ‘lucky draws’ to reimburse our participants. This type of reimbursement might have an impact on recruitment; for example, someone who was interested in gambling might be more interested to participate than those who were not. Nevertheless, we explained our situation at the beginning of the online survey. Specifically, we stressed that the current study was conducted to increase our understanding of the impact of COVID-19 on the general population. Each participant would help us to obtain priceless knowledge on this research topic. Therefore, we sincerely invited participants to answer the questionnaires carefully and honestly, and encouraged them to help us broadcast the online survey to other people.
