


Background: Interest in the support needs of people with intellectual disability has directed attention to developing assessments to measure of the pattern and intensity of supports which people need to participate in valued life activities. Assessments of the support needs of children must account for the influence of age. Method: Four hundred fifty (450) Spanish children with intellectual disability (ages 5-16) were assessed with the SIS-C Spanish. To test for measurement invariance and latent differences, the SIS-C Spanish standardization sample was linked to the SIS-C English normative sample. Models developed during the norming process were used to investigate measurement equivalence across age groups, differences in latent means, and differences in latent variances and standard deviations. Results: Findings suggested that all items on the SIS-C Spanish could reliably be used to measure support needs of children ages 5-16. When exploring age-related differences at the latent level, however, data showed latent mean differences in support need domain scores across age cohorts. Conclusions: The same set of items can be used to measure support needs in children ages 5-16, but age-related influences must be considered in developing norms for the SIS-C Spanish as well as in planning supports for children.
Antecedentes: El interés en las necesidades de apoyo de las personas con discapacidad intelectual debe centrarse en la evaluación del patrón e intensidad de los apoyos requeridos para realizar las actividades diarias. Cuando se evalúan estas necesidades en niños, se debe considerar además la influencia de la edad. Método: Se evaluaron 450 personas con discapacidad intelectual (5-16 años) mediante la versión española de la SIS-C. La invarianza de medida y las diferencias latentes fueron analizadas relacionando la muestra española con la muestra normativa de la versión en inglés. Los modelos desarrollados para la creación de baremos se utilizaron para estudiar las equivalencias de medida en los distintos grupos de edad y las diferencias latentes de sus medias, varianzas y desviaciones típicas. Resultados: Los ítems de la versión española de la SIS-C son fiables para medir las necesidades de apoyo en personas de entre 5 y 16 años. A nivel latente, los datos mostraron diferencias en las medias de las puntuaciones de diferentes grupos de edad. Conclusiones: Pueden utilizarse los mismos ítems para medir las necesidades de apoyo de niños y adolescentes, pero debe considerarse la influencia de la edad tanto en la creación de baremos como en la planificación de apoyos.
In the most recent edition of the American Association on Intellectual and Developmental Disabilities (AAIDD) terminology and classification manual Schalock et al. (2010) emphasized the importance of a social-ecological understanding of people with intellectual disability. According to a social-ecological model, people with intellectual disability can be distinguished from the general population by the extent of mismatch they experience between their personal competencies and the demands of community environments. This mismatch poses significant barriers to full participation in settings and activities that are valued by others in the culture. Providing personalized supports can reduce the mismatch and result in enhanced human functioning.
The growing emphasis on the support needs of people with intellectual disability has directed attention to developing measures that promote a greater understanding of the pattern and intensity of supports which people with intellectual disability need to fully participate in age appropriate, culturally valued life activities (e.g., education in schools for children, employment in community workplaces for adults). One measure that has been validated and extensively researched is the Supports Intensity Scale (SIS; Thompson et al., 2015), which was normed for people with intellectual disability, ages 16-64 years. It has been translated into 13 languages and is used in more than 20 countries (American Association on Intellectual and Developmental Disabilities, AAIDD, 2013).
The SIS was recently updated and published as the SIS-Adult Version (SIS-A; Thompson et al., 2015), and consists of three sections: Section 1, Exceptional Medical and Behavioral Support Needs; Section 2, Supports Needs Index Scale; and Section 3, Supplemental Protection and Advocacy Scale. Section 2 is the standardized portion of the scale where items are organized into six support need domains. A Children's Version, the SIS-C, was also recently developed for children ages 5-16 (Thompson et al., 2016). The manuals that accompany these instruments provide extensive details regarding evidence for their reliability, content validity, criterion-related validity, construct validity, and factor validity.
Completing SIS-A and SIS-C assessments yield norm-referenced scores, allowing for meaningful comparisons across individuals as well as opportunities to empirically investigate issues related to the nature of people's support needs, including changes in support needs across age groups and over time. For example, the SIS-A provides one set of norms for adults aged 16-64, and data from the standardization sample suggested limited influence of age on support needs in the standardization sample (Thompson et al., 2015). When developing the SIS-C, however, it was assumed that age would significantly influence support needs throughout childhood. Independent of disability, it is logical to assume that younger children have more intense needs for support. Thus, the SIS-C standardization sample was developed to address this issue, including six age cohorts that were further stratified by level of intellectual functioning (mild, moderate, severe/profound). Research with the U.S. standardization sample (see Shogren et al., 2015) confirmed the impact of age on SIS-C scores.
In the U.S. standardization sample of over 4,000 children with intellectual disability, researchers found that measurement invariance could be established in the seven support need domains measured on the SIS-C (Home Life, Community and Neighborhood, School Participation, School Learning, Health and Safety, Social, and Advocacy Activities), meaning the same set of items could be used to measure support needs across ages. There were, however, differences in the latent means based on age group. This finding confirmed that younger children, generally, had more intensive support needs than older children. Furthermore, it highlighted the importance of considering developmental changes in support needs assessment as children age, and confirmed the need for generating norms around age bands for standardized measures of support needs in children with intellectual disability (Shogren et al., 2015).
As with the SIS-A, international researchers translated the SIS-C so that it can be used to assess support needs and encourage support planning in other countries and cultures. Seo, Shaw, Shogren, Little, and Lang (in press) reported on the process of using structural equation modeling, combining data collected in the U.S. for the SIS-C standardization sample, with data collected in a smaller Spanish sample still stratified by six age bands and levels of intellectual functioning, to develop norms for the Spanish translation of the SIS-C, the SIS-C Spanish. As reported in a pre-publication version of the technical chapter for the SIS-C Spanish User's Guide (Verdugo, Arias et al., 2016), the psychometric properties of the SIS-C Spanish were as strong as the original English version; however, there was a need to test for age-related differences and determine if the same pattern of findings related to age-related differences was presented in the Spanish sample as in the U.S. sample. Examining such differences allows for investigating the applicability of tests across a variety of languages, countries, and cultures. It also allows for examining of cross-cultural validity, or differences in the latent constructs across cultures. Data collected on translated versions of the SIS-A suggests that SIS-A items have etic (i.e., universal or culture-free) properties (e.g., see Verdugo, Arias, Ibañez, & Schalock, 2010). Additional investigation is needed to determine if this is also the case of the SIS-C Spanish. Thus, the following research questions guided the examination of measurement equivalence and test latent differences across the age cohorts represented in the SIS-C Spanish standardization sample:
- 1.
Can the seven support need subdomains on the SIS-C Spanish (Home Life, Community and Neighborhood, School Participation, School Learning, Health and Safety, Social, and Advocacy Activities) be measured equivalently for Spanish children with intellectual disability in six age groups (5-6, 7-8, 9-10, 11-12, 13-14, and 15-16 years)?
- 2.
Do children with intellectual disability in six age groups have different means in each of the seven support need subdomains?
- 3.
Do children with intellectual disability in six age groups have different variances and standard deviations in each of the seven support need subdomains?
The sample included 450 Spanish children with intellectual disability (ages 5-16). To recruit participants, a letter describing the project was sent to organizations and schools serving children with disabilities throughout Spain. The letter was followed-up by telephone call to identify entities willing to participate, and participating entities were sent an informed consent form and project description to share with the families of children with intellectual disabilities. Assessments were completed with children from families returning the consent form.
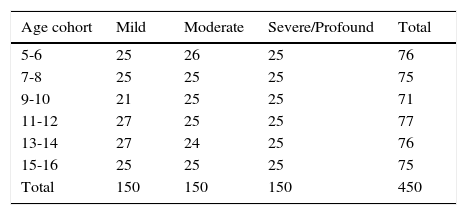
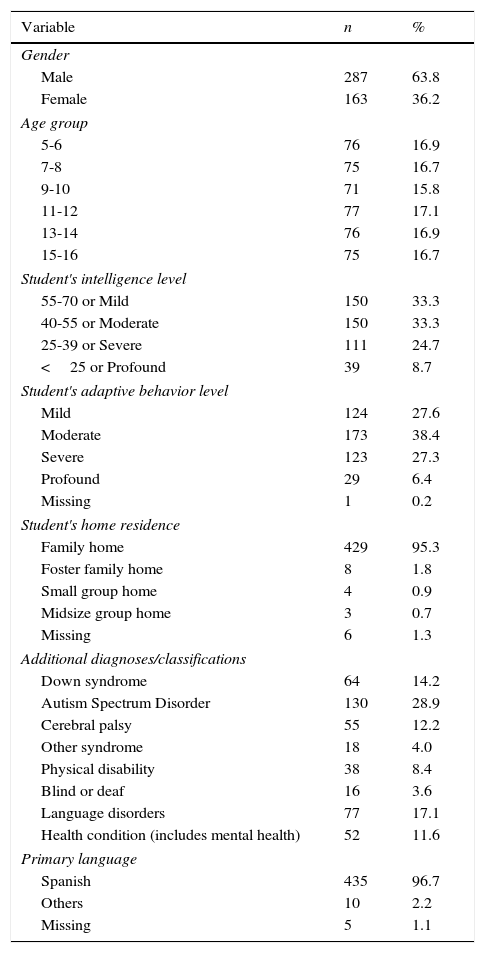
Because support needs was confounded with age in the U.S. norming process (see Shogren et al., 2015), the SIS-C Spanish Task Force mirrored the data collection process adopted in the U.S. (see Thompson et al., 2016) by collecting data stratified by two year age bands: 5-6, 7-8, 9-10, 11-12, 13-14, and 15-16 year olds. The Spanish standardization sample was further stratified within age bands by level of intellectual functioning (i.e., mild, IQ>55; moderate, IQ 40-55; severe/profound, IQ<40). Table 1 provides information on sample distribution across the 18 sampling cells. Information on participants’ demographic characteristics is provided in Table 2.
Sample size for age cohorts and intellectual functioning.
| Age cohort | Mild | Moderate | Severe/Profound | Total |
|---|---|---|---|---|
| 5-6 | 25 | 26 | 25 | 76 |
| 7-8 | 25 | 25 | 25 | 75 |
| 9-10 | 21 | 25 | 25 | 71 |
| 11-12 | 27 | 25 | 25 | 77 |
| 13-14 | 27 | 24 | 25 | 76 |
| 15-16 | 25 | 25 | 25 | 75 |
| Total | 150 | 150 | 150 | 450 |
Note. Mild-IQ>55; Moderate-IQ 40-55; Severe/Profound-IQ<40. Adapted from Verdugo, Arias et al. (2016).
Demographic characteristics.
| Variable | n | % |
|---|---|---|
| Gender | ||
| Male | 287 | 63.8 |
| Female | 163 | 36.2 |
| Age group | ||
| 5-6 | 76 | 16.9 |
| 7-8 | 75 | 16.7 |
| 9-10 | 71 | 15.8 |
| 11-12 | 77 | 17.1 |
| 13-14 | 76 | 16.9 |
| 15-16 | 75 | 16.7 |
| Student's intelligence level | ||
| 55-70 or Mild | 150 | 33.3 |
| 40-55 or Moderate | 150 | 33.3 |
| 25-39 or Severe | 111 | 24.7 |
| <25 or Profound | 39 | 8.7 |
| Student's adaptive behavior level | ||
| Mild | 124 | 27.6 |
| Moderate | 173 | 38.4 |
| Severe | 123 | 27.3 |
| Profound | 29 | 6.4 |
| Missing | 1 | 0.2 |
| Student's home residence | ||
| Family home | 429 | 95.3 |
| Foster family home | 8 | 1.8 |
| Small group home | 4 | 0.9 |
| Midsize group home | 3 | 0.7 |
| Missing | 6 | 1.3 |
| Additional diagnoses/classifications | ||
| Down syndrome | 64 | 14.2 |
| Autism Spectrum Disorder | 130 | 28.9 |
| Cerebral palsy | 55 | 12.2 |
| Other syndrome | 18 | 4.0 |
| Physical disability | 38 | 8.4 |
| Blind or deaf | 16 | 3.6 |
| Language disorders | 77 | 17.1 |
| Health condition (includes mental health) | 52 | 11.6 |
| Primary language | ||
| Spanish | 435 | 96.7 |
| Others | 10 | 2.2 |
| Missing | 5 | 1.1 |
Note. *Percentages of additional diagnoses/classifications are computed by each disability category. Adapted from Verdugo, Arias et al. (2016).
To test for measurement invariance and latent differences the SIS-C Spanish standardization sample was evaluated first alone before it was linked to the normative sample from the United States (N=4,015; 5-16 year olds) for two stages of testing. This approach is further described by Seo et al. (in press) and was designed to generate norms in the smaller Spanish standardization sample through leveraging the statistical power of larger U.S. standardization sample. Structural equation modeling (SEM) was adopted as the analytic framework to create normative scores. The most important advantage of using SEM in generating normative scores was the ability of SEM to produce more reliable estimates of normative scores compared to classical test theory models (see Seo, Little, Shogren, & Lang, 2016, for further information). Additionally, the SEM approach enables the investigation of substantive questions, such as the ones targeted in this paper, after norms are developed. Thus, the present analyses built on the norming process undertaken for the SIS-C Spanish, and explored age-related differences in the Spanish sample. The analyses reported here include models based on the U.S. normative sample (N=4,015) as well as the Spanish normative sample (N=450), but the focus of the analyses is exploring latent differences (i.e., latent means, latent variances) in the six Spanish age groups while leveraging the U.S. sample to have sufficient power for the analyses. Details on U.S. sample are provided by Thompson et al. (2016).
The Ethics Committee of the University of Salamanca approved the study, and data were collected in a manner that assured the anonymity and confidentiality of all participants.
Supports Intensity Scale-Children's version Spanish translationThe SIS-C was designed to measure the pattern and intensity of the support needs of children and youth with intellectual disability, and included two sections: (a) Exceptional Medical and Behavioral Needs and (b) Supports Needs Index Scale. Section 1 assesses medical conditions (e.g., respiratory care, feeding assistance, skin care) and challenging behaviors (e.g., externally-directed destructiveness, self-directed destructiveness) that impact support needs. Items are measured on a 0 to 2 scale (0=no support; 1=some support; 2=extensive support) in relation to the support needed to manage a medical condition or challenging behavior. Section 2 measures support needed to participate in life activities associated with seven domains: Home Life, Community and Neighborhood, School Participation, School Learning, Health and Safety, Social, and Advocacy. Each item is rated across three dimensions of support needs (i.e., type, frequency, daily support time), and each dimension is scored on a 5-point scale. Scores from seven domains are used to compute subscale standard scores and generate a composite standard score. The standard scores indicate the relative intensity of a child's support needs against a normative sample of children.
The SIS-C Spanish was developed through a rigorous translation procedure using the committee approach provided by Tassé and Thompson (2010). This approach included three committees made up of professional translators, bilingual content experts, and potential users. After a sequence of translation activities and negotiations, a final translation (i.e., the SIS-C Spanish) was developed to collect data. A more complete description of the application of the SIS-C in the Spanish context is available in Guillén, Verdugo, Arias, and Vicente (2015), and in Verdugo, Guillén, Arias, Vicente, and Badia (2016).
Data analysisUsing models developed during the norming process to test the three research questions targeted in the present analyses, we performed a multiple-group Mean and Covariance Structures (MACS; Little, 1997) confirmatory factor analysis (CFA) in the SEM framework. Because the Spanish sample was relatively small to run MACS CFAs independently, we first established measurement invariance with the 6 Spanish age groups and then combined the U.S. normative data with the Spanish normative data, and estimated a model for the 7 support need domains. Among the total of 12 age groups, the 6 U.S. age groups were only included to examine measurement equivalence of support needs, whereas the 6 Spanish age groups were used to test measurement equivalence as well as latent differences in means and variances [see Seo et al. (in press) for a further rationale for leveraging the U.S. SIS-C data when running MACS CFAs on translated versions of the scale]. Thus, the U.S. data did not influence the latent parameter estimates of the Spanish data, but were included to promote model stability due to its larger sample size and robust measurement properties. The effects-coding method of identification (Little, Slegers, & Card, 2006) was used to keep the metric of observed SIS-C scores consistent. All latent data analyses were conducted in Mplus, version 7.2 (Muthén & Muthén, 2012) using maximum likelihood for estimation.
Pre-modeling processSpanish SIS-C data had only 2 missing responses from 450 participants (0.4%), and both missing responses were on a single question. To recover these missing observations, the imputed U.S. data were combined with the Spanish data for a single imputation at the item level, using R 3.2.0 (R Core Team, 2015). The mice package (van Buuren & Groothuis-Oudshoorn, 2011) was used to address missing data. For detailed information on missing data handling for U.S. data, see Seo et al. (in press). After missing data were imputed for Spanish data, we created parcels (i.e., the parsimonious representations of indicators; the averages in our case), using guidelines provided by Seo, Little, Shogren, and Lang (2016), to examine the three research questions. Little, Rhemtulla, Gibson, and Schoemann (2013) reported that using parcels descreases error variance and therefore improves the reliability of model indicators. Moreover, the use of parcels was consistent with the methods used by Seo, Little et al. (2016) to norm the original U.S. sample.
Research question 1-Measurement equivalence across age groupsMeasurement equivalence was tested at three sequential invariance levels: configural, weak, and strong invariance. The initial test, configural invariance, examined the same patterns of fixed and free parameters across six Spanish age groups. Next, weak invariance was tested by constraining factor loadings among the six U.S. and six Spanish age groups to equality. Finally, strong invariance was evaluated by equating the intercepts across 12 age groups. It is important to re-emphasize that equality constraints on factor loadings and intercepts were placed for both U.S. and Spanish age groups to ensure that the equivalent levels of support needs had the same levels of observed scores across the countries and age groups. We used the change in comparative fit index (CFI) less than .01 (ΔCFI<.01; Cheung & Rensvold, 2002) when evaluating the tenability of equality constraints between nested models (i.e., configural and weak invariance models, weak and strong invariance models). Establishing measurement equivalence is a prerequisite condition to comparing latent means and standard deviations (var.).
Research question 2-Differences in latent meansTo address Research Question 2, we sequentially tested latent mean differences of the Spanish SIS-C scores, one latent support need domain at a time. In the meantime, the U.S. SIS-C latent means were freely estimated. For example, we constrained the School Participation latent means for ages 5-6 and 7-8 to be equal in the Spanish data. We then conducted a nested likelihood ratio test comparing this model to the strong invariance model (i.e., baseline model) obtained in Research Question 1. If it was found that the latent mean could be equated between the 5-6 and 7-8 age groups, the School Participation latent mean was constrained across three age groups (i.e., 5-6, 7-8, 9-10 year olds); then, this model was compared to the previous model that had equality constraints in 5-6 and 7-8 age groups. This process was repeated across all age groups and support need domains.
Research question 3-Differences in latent variances and standard deviationsTo address Research Question 3, we followed the same procedure used to test mean differences. One exception was the baseline model; the final latent mean model for each factor created in Research Question 2 served as a baseline model in comparing nested models for the given latent variances (e.g., the final School Participation mean model was used to test School Participation variance). As in the latent mean comparisons, we gradually increased equality constraints on variances on a given factor in the Spanish data and performed likelihood ratio tests between nested models (e.g., model with equality constraints on Home Life variances of 5-6 and 7-8 age groups vs. model with equality constraints on Home Life variances of 5-6, 7-8, and 9-10 age groups) until all Spanish age groups had been evaluated.
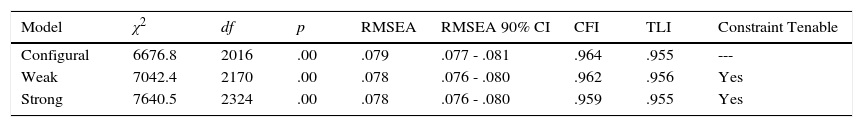
ResultsResearch Question 1-Measurement equivalenceTable 3 provides fit indices for the nested sequence in the MACS CFAs. The configural invariance model fit was satisfactory with root mean square error of approximation (RMSEA) in an acceptable range and both the CFI and the Tucker-Lewis index (TLI) exceeding 0.90 (χ2 [2016]=6676.781, RMSEA=.079 [90% CI: .077 - .081], CFI=.964, TLI=.955, and SRMR=.023). Both weak and strong invariance were established because equality constraints placed on factor loadings and intercepts did not worsen model fit (ΔCFI=.002 between configural and weak invariance models; ΔCFI=.003 between weak and strong invariance models). This confirmed that the same parceled items could be used to measure support needs across the 12 age bands (6 U.S. and 6 Spanish normative samples).
Fit indices for the nested sequence in the multiple-group Confirmatory Factor Analysis.
| Model | χ2 | df | p | RMSEA | RMSEA 90% CI | CFI | TLI | Constraint Tenable |
|---|---|---|---|---|---|---|---|---|
| Configural | 6676.8 | 2016 | .00 | .079 | .077 - .081 | .964 | .955 | --- |
| Weak | 7042.4 | 2170 | .00 | .078 | .076 - .080 | .962 | .956 | Yes |
| Strong | 7640.5 | 2324 | .00 | .078 | .076 - .080 | .959 | .955 | Yes |
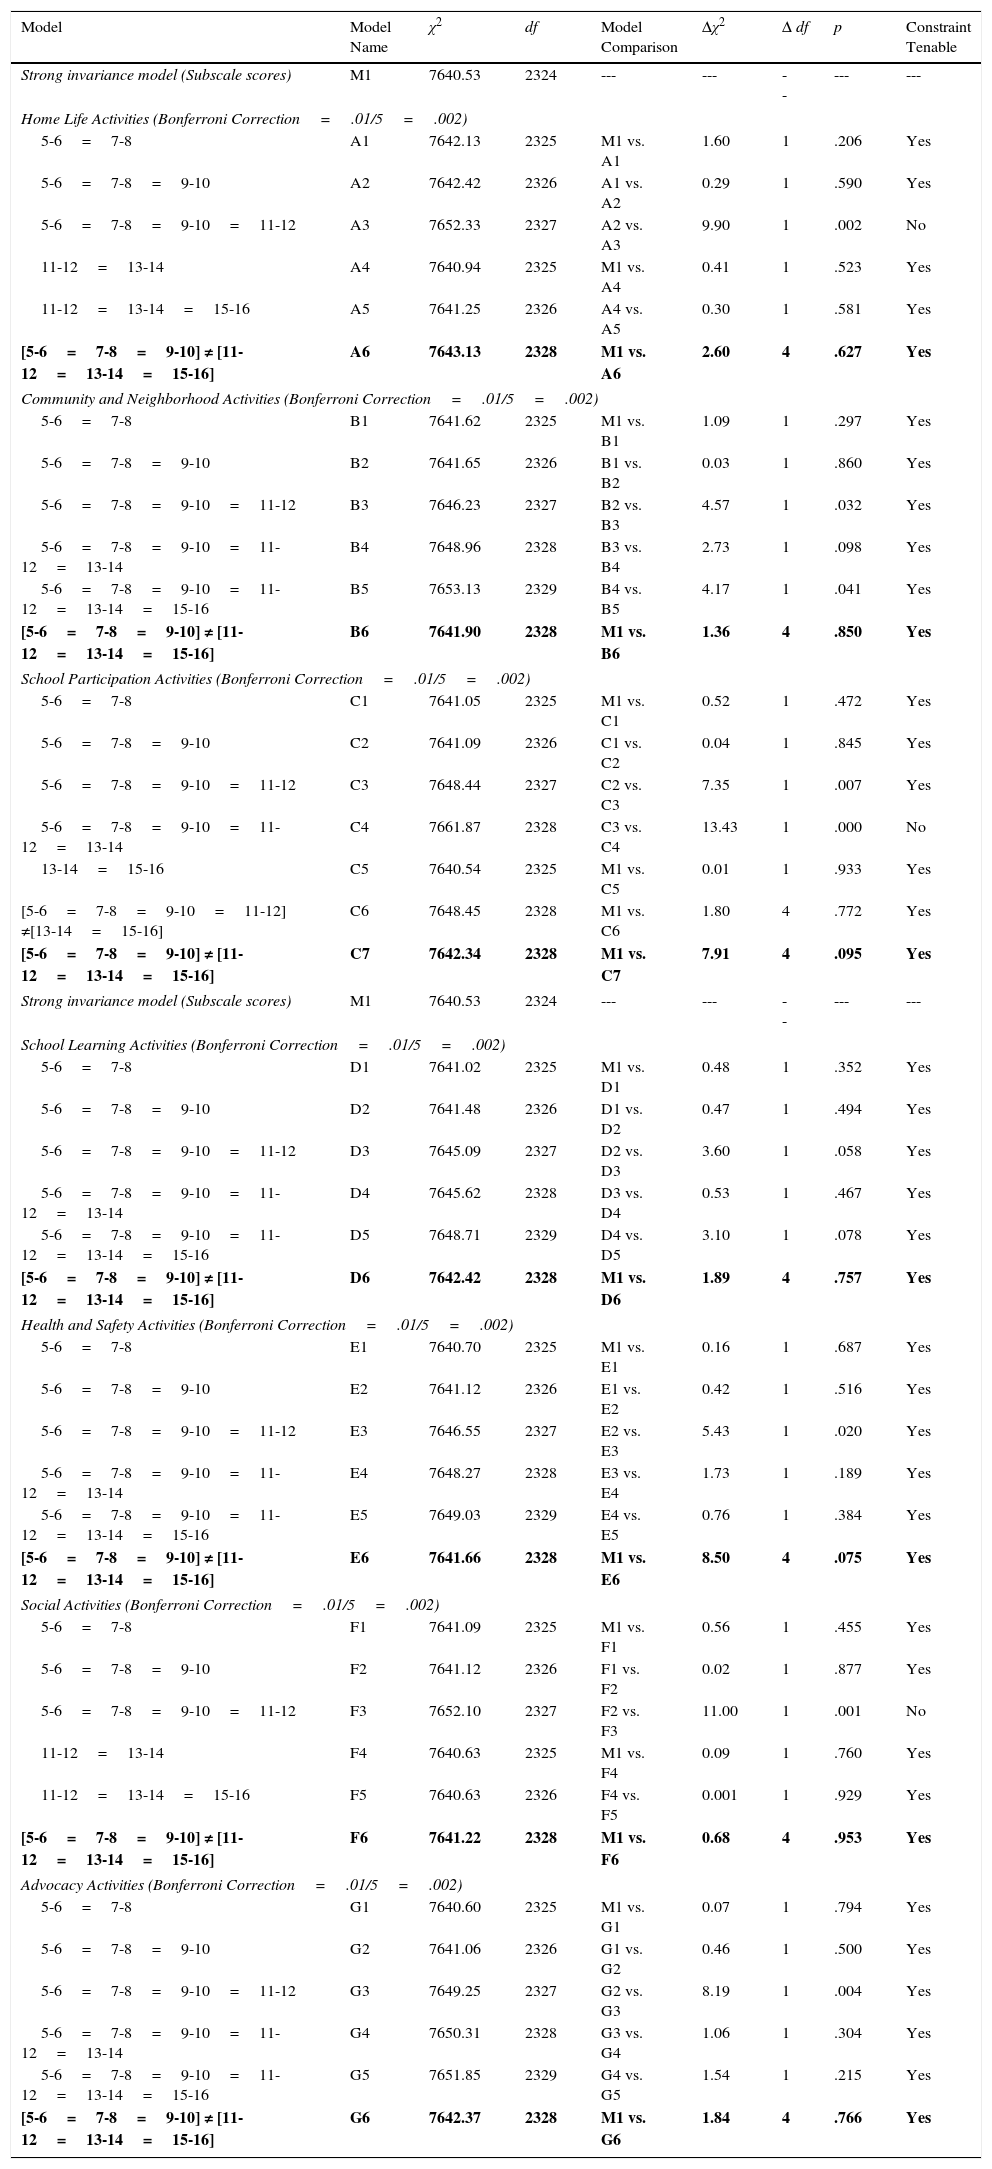
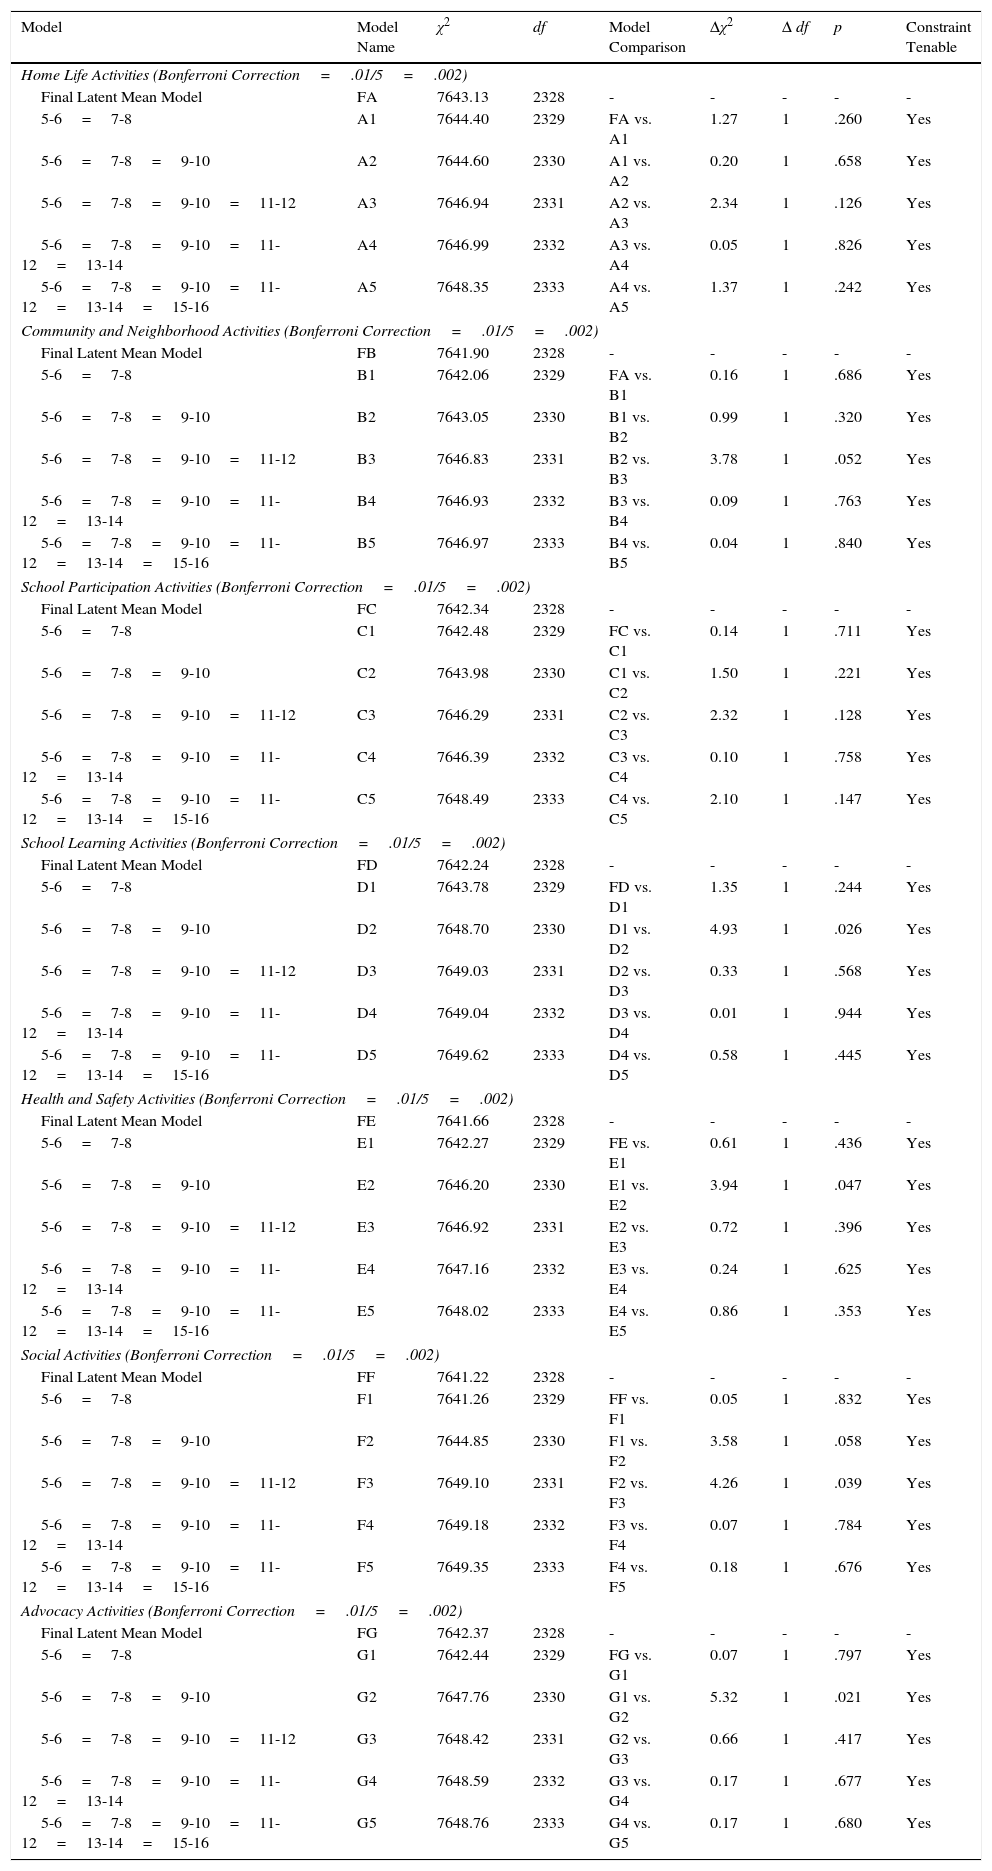
Findings related to the latent means are summarized in Table 4. The Home Life and Social domains had significantly different latent means between younger (5-10 year olds) and older (11-16 year olds) age groups. Community and Neighborhood, School Learning, Health and Safety, and Advocacy domains had equivalent latent means across 6 age groups. Finally, School Participation had different latent means between 5-12 year olds and 13-16 year olds. Across constructs, however, the freely estimated latent means obtained from the strong invariance model suggested that the 5-6, 7-8, and 9-10 age groups appeared to have similar means whereas the rest of the age groups, 11-12, 13-14, and 15-16, tended to have the same means across the seven support need constructs. Thus, conceptually, there seemed to be a break in support needs across the 5-10 and the 11-16 age groups. To test this hypothesis, two sets of equality constraints on a given factor were estimated (i.e., one set for 5-10 age group and another set for 11-16 age group on Home Life construct). Across all support needs domains, constraining age bands in this manner was tenable when evaluating nested models (see B6, C7, D6, E6, and G6 in Table 4). Based on the assumption that younger children (i.e., the 5-10 age group) require more intense support across domains than older children (i.e., the 11-16 age group), a theoretical decision was made to keep two sets of equality constraints across the seven domains in order to reflect the developmental aspects of support needed by children with intellectual disability.
Tests for latent mean comparisons in each support need construct.
| Model | Model Name | χ2 | df | Model Comparison | Δχ2 | Δ df | p | Constraint Tenable |
|---|---|---|---|---|---|---|---|---|
| Strong invariance model (Subscale scores) | M1 | 7640.53 | 2324 | --- | --- | -- | --- | --- |
| Home Life Activities (Bonferroni Correction=.01/5=.002) | ||||||||
| 5-6=7-8 | A1 | 7642.13 | 2325 | M1 vs. A1 | 1.60 | 1 | .206 | Yes |
| 5-6=7-8=9-10 | A2 | 7642.42 | 2326 | A1 vs. A2 | 0.29 | 1 | .590 | Yes |
| 5-6=7-8=9-10=11-12 | A3 | 7652.33 | 2327 | A2 vs. A3 | 9.90 | 1 | .002 | No |
| 11-12=13-14 | A4 | 7640.94 | 2325 | M1 vs. A4 | 0.41 | 1 | .523 | Yes |
| 11-12=13-14=15-16 | A5 | 7641.25 | 2326 | A4 vs. A5 | 0.30 | 1 | .581 | Yes |
| [5-6=7-8=9-10] ≠ [11-12=13-14=15-16] | A6 | 7643.13 | 2328 | M1 vs. A6 | 2.60 | 4 | .627 | Yes |
| Community and Neighborhood Activities (Bonferroni Correction=.01/5=.002) | ||||||||
| 5-6=7-8 | B1 | 7641.62 | 2325 | M1 vs. B1 | 1.09 | 1 | .297 | Yes |
| 5-6=7-8=9-10 | B2 | 7641.65 | 2326 | B1 vs. B2 | 0.03 | 1 | .860 | Yes |
| 5-6=7-8=9-10=11-12 | B3 | 7646.23 | 2327 | B2 vs. B3 | 4.57 | 1 | .032 | Yes |
| 5-6=7-8=9-10=11-12=13-14 | B4 | 7648.96 | 2328 | B3 vs. B4 | 2.73 | 1 | .098 | Yes |
| 5-6=7-8=9-10=11-12=13-14=15-16 | B5 | 7653.13 | 2329 | B4 vs. B5 | 4.17 | 1 | .041 | Yes |
| [5-6=7-8=9-10] ≠ [11-12=13-14=15-16] | B6 | 7641.90 | 2328 | M1 vs. B6 | 1.36 | 4 | .850 | Yes |
| School Participation Activities (Bonferroni Correction=.01/5=.002) | ||||||||
| 5-6=7-8 | C1 | 7641.05 | 2325 | M1 vs. C1 | 0.52 | 1 | .472 | Yes |
| 5-6=7-8=9-10 | C2 | 7641.09 | 2326 | C1 vs. C2 | 0.04 | 1 | .845 | Yes |
| 5-6=7-8=9-10=11-12 | C3 | 7648.44 | 2327 | C2 vs. C3 | 7.35 | 1 | .007 | Yes |
| 5-6=7-8=9-10=11-12=13-14 | C4 | 7661.87 | 2328 | C3 vs. C4 | 13.43 | 1 | .000 | No |
| 13-14=15-16 | C5 | 7640.54 | 2325 | M1 vs. C5 | 0.01 | 1 | .933 | Yes |
| [5-6=7-8=9-10=11-12] ≠[13-14=15-16] | C6 | 7648.45 | 2328 | M1 vs. C6 | 1.80 | 4 | .772 | Yes |
| [5-6=7-8=9-10] ≠ [11-12=13-14=15-16] | C7 | 7642.34 | 2328 | M1 vs. C7 | 7.91 | 4 | .095 | Yes |
| Strong invariance model (Subscale scores) | M1 | 7640.53 | 2324 | --- | --- | -- | --- | --- |
| School Learning Activities (Bonferroni Correction=.01/5=.002) | ||||||||
| 5-6=7-8 | D1 | 7641.02 | 2325 | M1 vs. D1 | 0.48 | 1 | .352 | Yes |
| 5-6=7-8=9-10 | D2 | 7641.48 | 2326 | D1 vs. D2 | 0.47 | 1 | .494 | Yes |
| 5-6=7-8=9-10=11-12 | D3 | 7645.09 | 2327 | D2 vs. D3 | 3.60 | 1 | .058 | Yes |
| 5-6=7-8=9-10=11-12=13-14 | D4 | 7645.62 | 2328 | D3 vs. D4 | 0.53 | 1 | .467 | Yes |
| 5-6=7-8=9-10=11-12=13-14=15-16 | D5 | 7648.71 | 2329 | D4 vs. D5 | 3.10 | 1 | .078 | Yes |
| [5-6=7-8=9-10] ≠ [11-12=13-14=15-16] | D6 | 7642.42 | 2328 | M1 vs. D6 | 1.89 | 4 | .757 | Yes |
| Health and Safety Activities (Bonferroni Correction=.01/5=.002) | ||||||||
| 5-6=7-8 | E1 | 7640.70 | 2325 | M1 vs. E1 | 0.16 | 1 | .687 | Yes |
| 5-6=7-8=9-10 | E2 | 7641.12 | 2326 | E1 vs. E2 | 0.42 | 1 | .516 | Yes |
| 5-6=7-8=9-10=11-12 | E3 | 7646.55 | 2327 | E2 vs. E3 | 5.43 | 1 | .020 | Yes |
| 5-6=7-8=9-10=11-12=13-14 | E4 | 7648.27 | 2328 | E3 vs. E4 | 1.73 | 1 | .189 | Yes |
| 5-6=7-8=9-10=11-12=13-14=15-16 | E5 | 7649.03 | 2329 | E4 vs. E5 | 0.76 | 1 | .384 | Yes |
| [5-6=7-8=9-10] ≠ [11-12=13-14=15-16] | E6 | 7641.66 | 2328 | M1 vs. E6 | 8.50 | 4 | .075 | Yes |
| Social Activities (Bonferroni Correction=.01/5=.002) | ||||||||
| 5-6=7-8 | F1 | 7641.09 | 2325 | M1 vs. F1 | 0.56 | 1 | .455 | Yes |
| 5-6=7-8=9-10 | F2 | 7641.12 | 2326 | F1 vs. F2 | 0.02 | 1 | .877 | Yes |
| 5-6=7-8=9-10=11-12 | F3 | 7652.10 | 2327 | F2 vs. F3 | 11.00 | 1 | .001 | No |
| 11-12=13-14 | F4 | 7640.63 | 2325 | M1 vs. F4 | 0.09 | 1 | .760 | Yes |
| 11-12=13-14=15-16 | F5 | 7640.63 | 2326 | F4 vs. F5 | 0.001 | 1 | .929 | Yes |
| [5-6=7-8=9-10] ≠ [11-12=13-14=15-16] | F6 | 7641.22 | 2328 | M1 vs. F6 | 0.68 | 4 | .953 | Yes |
| Advocacy Activities (Bonferroni Correction=.01/5=.002) | ||||||||
| 5-6=7-8 | G1 | 7640.60 | 2325 | M1 vs. G1 | 0.07 | 1 | .794 | Yes |
| 5-6=7-8=9-10 | G2 | 7641.06 | 2326 | G1 vs. G2 | 0.46 | 1 | .500 | Yes |
| 5-6=7-8=9-10=11-12 | G3 | 7649.25 | 2327 | G2 vs. G3 | 8.19 | 1 | .004 | Yes |
| 5-6=7-8=9-10=11-12=13-14 | G4 | 7650.31 | 2328 | G3 vs. G4 | 1.06 | 1 | .304 | Yes |
| 5-6=7-8=9-10=11-12=13-14=15-16 | G5 | 7651.85 | 2329 | G4 vs. G5 | 1.54 | 1 | .215 | Yes |
| [5-6=7-8=9-10] ≠ [11-12=13-14=15-16] | G6 | 7642.37 | 2328 | M1 vs. G6 | 1.84 | 4 | .766 | Yes |
Note. Bold values represent the final latent mean models. Adapted from Verdugo, Arias et al. (2016).
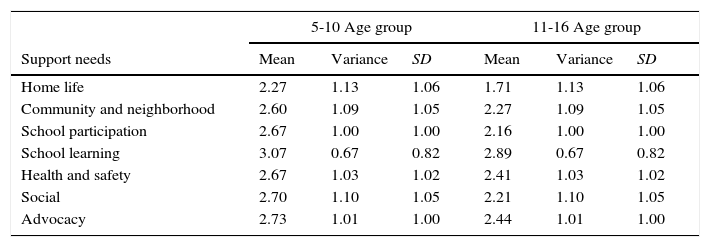
Using the final latent mean model (highlighted in Table 4) for each construct as a baseline model, latent variances were compared across age groups. As provided in Table 5, each support need construct had the same variances and corresponding standard deviations (var.). Table 6 provides latent means, variances, and standard deviations in 5-10 and 11-16 age groups consistent with the mean level groupings.
Tests for Latent Variance Comparisons in each Support Need Construct.
| Model | Model Name | χ2 | df | Model Comparison | Δχ2 | Δ df | p | Constraint Tenable |
|---|---|---|---|---|---|---|---|---|
| Home Life Activities (Bonferroni Correction=.01/5=.002) | ||||||||
| Final Latent Mean Model | FA | 7643.13 | 2328 | - | - | - | - | - |
| 5-6=7-8 | A1 | 7644.40 | 2329 | FA vs. A1 | 1.27 | 1 | .260 | Yes |
| 5-6=7-8=9-10 | A2 | 7644.60 | 2330 | A1 vs. A2 | 0.20 | 1 | .658 | Yes |
| 5-6=7-8=9-10=11-12 | A3 | 7646.94 | 2331 | A2 vs. A3 | 2.34 | 1 | .126 | Yes |
| 5-6=7-8=9-10=11-12=13-14 | A4 | 7646.99 | 2332 | A3 vs. A4 | 0.05 | 1 | .826 | Yes |
| 5-6=7-8=9-10=11-12=13-14=15-16 | A5 | 7648.35 | 2333 | A4 vs. A5 | 1.37 | 1 | .242 | Yes |
| Community and Neighborhood Activities (Bonferroni Correction=.01/5=.002) | ||||||||
| Final Latent Mean Model | FB | 7641.90 | 2328 | - | - | - | - | - |
| 5-6=7-8 | B1 | 7642.06 | 2329 | FA vs. B1 | 0.16 | 1 | .686 | Yes |
| 5-6=7-8=9-10 | B2 | 7643.05 | 2330 | B1 vs. B2 | 0.99 | 1 | .320 | Yes |
| 5-6=7-8=9-10=11-12 | B3 | 7646.83 | 2331 | B2 vs. B3 | 3.78 | 1 | .052 | Yes |
| 5-6=7-8=9-10=11-12=13-14 | B4 | 7646.93 | 2332 | B3 vs. B4 | 0.09 | 1 | .763 | Yes |
| 5-6=7-8=9-10=11-12=13-14=15-16 | B5 | 7646.97 | 2333 | B4 vs. B5 | 0.04 | 1 | .840 | Yes |
| School Participation Activities (Bonferroni Correction=.01/5=.002) | ||||||||
| Final Latent Mean Model | FC | 7642.34 | 2328 | - | - | - | - | - |
| 5-6=7-8 | C1 | 7642.48 | 2329 | FC vs. C1 | 0.14 | 1 | .711 | Yes |
| 5-6=7-8=9-10 | C2 | 7643.98 | 2330 | C1 vs. C2 | 1.50 | 1 | .221 | Yes |
| 5-6=7-8=9-10=11-12 | C3 | 7646.29 | 2331 | C2 vs. C3 | 2.32 | 1 | .128 | Yes |
| 5-6=7-8=9-10=11-12=13-14 | C4 | 7646.39 | 2332 | C3 vs. C4 | 0.10 | 1 | .758 | Yes |
| 5-6=7-8=9-10=11-12=13-14=15-16 | C5 | 7648.49 | 2333 | C4 vs. C5 | 2.10 | 1 | .147 | Yes |
| School Learning Activities (Bonferroni Correction=.01/5=.002) | ||||||||
| Final Latent Mean Model | FD | 7642.24 | 2328 | - | - | - | - | - |
| 5-6=7-8 | D1 | 7643.78 | 2329 | FD vs. D1 | 1.35 | 1 | .244 | Yes |
| 5-6=7-8=9-10 | D2 | 7648.70 | 2330 | D1 vs. D2 | 4.93 | 1 | .026 | Yes |
| 5-6=7-8=9-10=11-12 | D3 | 7649.03 | 2331 | D2 vs. D3 | 0.33 | 1 | .568 | Yes |
| 5-6=7-8=9-10=11-12=13-14 | D4 | 7649.04 | 2332 | D3 vs. D4 | 0.01 | 1 | .944 | Yes |
| 5-6=7-8=9-10=11-12=13-14=15-16 | D5 | 7649.62 | 2333 | D4 vs. D5 | 0.58 | 1 | .445 | Yes |
| Health and Safety Activities (Bonferroni Correction=.01/5=.002) | ||||||||
| Final Latent Mean Model | FE | 7641.66 | 2328 | - | - | - | - | - |
| 5-6=7-8 | E1 | 7642.27 | 2329 | FE vs. E1 | 0.61 | 1 | .436 | Yes |
| 5-6=7-8=9-10 | E2 | 7646.20 | 2330 | E1 vs. E2 | 3.94 | 1 | .047 | Yes |
| 5-6=7-8=9-10=11-12 | E3 | 7646.92 | 2331 | E2 vs. E3 | 0.72 | 1 | .396 | Yes |
| 5-6=7-8=9-10=11-12=13-14 | E4 | 7647.16 | 2332 | E3 vs. E4 | 0.24 | 1 | .625 | Yes |
| 5-6=7-8=9-10=11-12=13-14=15-16 | E5 | 7648.02 | 2333 | E4 vs. E5 | 0.86 | 1 | .353 | Yes |
| Social Activities (Bonferroni Correction=.01/5=.002) | ||||||||
| Final Latent Mean Model | FF | 7641.22 | 2328 | - | - | - | - | - |
| 5-6=7-8 | F1 | 7641.26 | 2329 | FF vs. F1 | 0.05 | 1 | .832 | Yes |
| 5-6=7-8=9-10 | F2 | 7644.85 | 2330 | F1 vs. F2 | 3.58 | 1 | .058 | Yes |
| 5-6=7-8=9-10=11-12 | F3 | 7649.10 | 2331 | F2 vs. F3 | 4.26 | 1 | .039 | Yes |
| 5-6=7-8=9-10=11-12=13-14 | F4 | 7649.18 | 2332 | F3 vs. F4 | 0.07 | 1 | .784 | Yes |
| 5-6=7-8=9-10=11-12=13-14=15-16 | F5 | 7649.35 | 2333 | F4 vs. F5 | 0.18 | 1 | .676 | Yes |
| Advocacy Activities (Bonferroni Correction=.01/5=.002) | ||||||||
| Final Latent Mean Model | FG | 7642.37 | 2328 | - | - | - | - | - |
| 5-6=7-8 | G1 | 7642.44 | 2329 | FG vs. G1 | 0.07 | 1 | .797 | Yes |
| 5-6=7-8=9-10 | G2 | 7647.76 | 2330 | G1 vs. G2 | 5.32 | 1 | .021 | Yes |
| 5-6=7-8=9-10=11-12 | G3 | 7648.42 | 2331 | G2 vs. G3 | 0.66 | 1 | .417 | Yes |
| 5-6=7-8=9-10=11-12=13-14 | G4 | 7648.59 | 2332 | G3 vs. G4 | 0.17 | 1 | .677 | Yes |
| 5-6=7-8=9-10=11-12=13-14=15-16 | G5 | 7648.76 | 2333 | G4 vs. G5 | 0.17 | 1 | .680 | Yes |
Note. Adapted from Verdugo, Arias et al. (2016).
Latent means, variances, and standard deviations.
| 5-10 Age group | 11-16 Age group | |||||
|---|---|---|---|---|---|---|
| Support needs | Mean | Variance | SD | Mean | Variance | SD |
| Home life | 2.27 | 1.13 | 1.06 | 1.71 | 1.13 | 1.06 |
| Community and neighborhood | 2.60 | 1.09 | 1.05 | 2.27 | 1.09 | 1.05 |
| School participation | 2.67 | 1.00 | 1.00 | 2.16 | 1.00 | 1.00 |
| School learning | 3.07 | 0.67 | 0.82 | 2.89 | 0.67 | 0.82 |
| Health and safety | 2.67 | 1.03 | 1.02 | 2.41 | 1.03 | 1.02 |
| Social | 2.70 | 1.10 | 1.05 | 2.21 | 1.10 | 1.05 |
| Advocacy | 2.73 | 1.01 | 1.00 | 2.44 | 1.01 | 1.00 |
Note. Adapted from Verdugo, Arias et al. (2016).
The results suggest that the same set of items can be meaningfully and reliability used to measure support needs in children ages 5-16 on the SIS-C Spanish (i.e., measurement invariance was established). This is consistent with work with the SIS-C in the U.S. (Shogren et al., 2015), and suggests etic properties and external validity of the items on the SIS-C as has been established with the SIS-A. When exploring age-related differences at the latent level, however, there were latent mean differences in support need domain scores across age cohorts in the Spanish sample. These findings suggested that there are age-related influences on the mean levels of support needs of children with intellectual disability in the domains assessed on the SIS-C Spanish, and that these differences must be considered in developing norms for the SIS-C Spanish and in planning for support needs for Spanish children of differing ages. Although in a U.S. sample Shogren et al. (2015) found that each age cohort (5-6, 7-8, 9-10, 11-12, 13-14, and 15-16) differed from each other, the present study suggested that in the Spanish cohort, differences tended to be concentrated in the means of younger and older children (5-10 year olds vs. 11-16 year olds), suggesting there were cross-cultural differences in the constructs measured on the SIS-C Spanish that must be considered in developing norms and in planning for supports.
There were not any differences in the latent variances and standard deviations across age cohort in the Spanish sample, suggesting limited variability across age groups in the sample, signifying the Spanish sample was relatively homogenous. Overall, the pattern across support need domains suggested students ages 5-10 and 11-16 tended to differ most from each other in the Spanish context, although school participation tended to have a slightly higher differentiation with 5-12 year olds scoring more similarly in initial testing. When testing the same age break across all support need domains, however, it was discovered that models fit best across domains with 5-10 and 11-16 year olds, suggesting across support need domains there was the most differentiation based on these two 5 year age bands in the Spanish sample. More differentiation (and variability) that has been found with research with the U.S. sample (see Shogren et al., 2015) could have resulted from the larger sample size in the U.S. versus the Spanish standardization sample (which is a limitation of this study), or it may be a function of differences in the U.S. vs. Spanish context (e.g., larger population and diversity in the U.S.). Although leveraging the U.S. sample for norming purposes for the SIS-C Spanish Translation allows for a smaller norming sample to be collected and does not affect the estimates of latent parameters (see Seo, Shaw et al., in press), further work is needed to explore the cross-cultural differences.
The SIS-C Spanish is a reliable and valid way to assess the intensity and pattern of support needed by children ages 5-16 and contributes to the breakthrough in the construction of assessment tools designed to children and adolescents with intellectual disabilities in Spain (Arias, Verdugo, Navas, & Gomez, 2013; Goméz et al., 2014; Verdugo et al., 2015). The implications of the differences between 5-10 and 11-16 year olds in the Spanish sample suggests that planning teams need to be cognizant that children's support needs change as they age. Support need differences emerging in preadolescence may be related to the physiological and psychological changes affecting this age group, and may carry over to the adolescent years in the Spanish context. It is important to recognize that that issues of intensity of support should not be confused with importance of support (i.e., just because older children, in general, need less intense supports than younger children does not mean that addressing their support needs is less critical). Selecting actual supports that are aligned with a child's support needs and enhance human functioning can most certainly be informed by assessment information, but identifying and arranging individualized supports ultimately requires systematic and differential planning, particularly as children transition to preadolescence. This holds true across cultural contexts.
Work on this research was funded by the Spanish Ministry of the Economy and Competitiveness (R&D Projects, PSI2012- 36278), and the Autonomous Community of Castile and Leon (R&D Projects, SA120U13)
