


The ability to recognize others’ facial emotions has become increasingly important after the COVID-19 pandemic, which causes stressful situations in emotion regulation. Considering the importance of emotion in maintaining a social life, emotion knowledge to perceive and label emotions of oneself and others requires an understanding of affective dimensions, such as emotional valence and emotional arousal. However, limited information is available about whether the behavioral representation of affective dimensions is similar to their neural representation. To explore the relationship between the brain and behavior in the representational geometries of affective dimensions, we constructed a behavioral paradigm in which emotional faces were categorized into geometric spaces along the valence, arousal, and valence and arousal dimensions. Moreover, we compared such representations to neural representations of the faces acquired by functional magnetic resonance imaging. We found that affective dimensions were similarly represented in the behavior and brain. Specifically, behavioral and neural representations of valence were less similar to those of arousal. We also found that valence was represented in the dorsolateral prefrontal cortex, frontal eye fields, precuneus, and early visual cortex, whereas arousal was represented in the cingulate gyrus, middle frontal gyrus, orbitofrontal cortex, fusiform gyrus, and early visual cortex. In conclusion, the current study suggests that dimensional emotions are similarly represented in the behavior and brain and are presented with differential topographical organizations in the brain.
Emotions affect our daily lives, especially how we decide, remember, learn, and perceive the world (Levine & Burgess, 1997). However, how well we understand our emotions and those of others is related to our mental health (Gyurak et al., 2011; Lerner et al., 2015; Okon-Singer et al., 2015; Schlegel et al., 2017), as appropriate emotion processing could influence our physiological health because emotional experiences impact our physiological responses (DeSteno et al., 2013). The knowledge of how people recognize others’ facial emotions is becoming increasingly important after the COVID-19-pandemic that causes stressful situations in emotion regulation (Hamilton et al., 2021; Schelhorn et al., 2022; Zochowska et al., 2022). Emotion knowledge is defined as one's ability to perceive and label emotions of oneself and others (Izard et al., 2001; Trentacosta & Fine, 2010). Emotion perception based on this knowledge is used to maintain successful social relationships (Keltner & Haidt, 1999; Oatley et al., 2006). To recognize the emotions of others with ease and efficiency, it is necessary to appropriately detect and interpret relevant sensory stimuli with emotional cues (Damasio, 1999; Peelen et al., 2010). Facial expressions are representative of the most common and important emotional cues (Ekman, 1976; Little et al., 2011). Besides, a widely accepted theory about emotional states is that basic emotions include happiness, anger, sadness, fear, disgust, and surprise (Brooks et al., 2019; Ekman, 1992; Gu et al., 2019; Smith et al., 2005).
Further, according to the dimensional theory of emotion (Hamann, 2012; Russell, 1980, 2003), emotional states can be represented by affective dimensions in bipolar space, such as valence and arousal (core affects). The valence dimension is situated in a pleasant (positive)-to-unpleasant (negative) direction, whereas the arousal dimension is situated in an excited-to-calm direction (Hamann, 2012; Mehrabian & Russell, 1974; Russell, 1980). The separation approach of the nature of emotion has been widely used in emotion studies that utilized of its parsimony and applicability, proving its empirical accountability for a wide range of effects (Kensinger & Schacter, 2006; Lang & Bradley, 2010; Lang & Davis, 2006). Although emotion is well-represented in our physiological system and can be measured using biomarkers (Egger et al., 2019; Izard et al., 2001), the two dimensions of emotional state may be differentially reflected in peripheral and physiological processes (Anders et al., 2004; Bernat et al., 2006; Codispoti et al., 2006; Cook III et al., 1992; Cuthbert et al., 1996; Vrana et al., 1988). Based on this dissociation of dimensional emotions, several studies have attempted to characterize distinct neural responses to the emotional valence and arousal (e.g., Blair et al., 1999; Ethofer et al., 2009; Gerdes et al., 2010; Nielen et al., 2009; Posner et al., 2009). However, a previous study reported that basic emotions do not conflict with the affective dimensions but are represented by core affects (Gu et al., 2019). For example, happiness represents positive valence and high arousal, whereas sadness represents negative valence and low arousal. Uncovering these dimensions of emotion is crucial as it is the cornerstone for the underlying understanding of an emotion perception system.
Multivariate pattern analysis (MVPA) is becoming increasingly popular in functional magnetic resonance imaging (fMRI) studies. Mass-univariate analysis focuses on the localization of activation responses to stimuli, whereas MVPA focuses on representational content via pattern information (Carlson et al., 2003; Haxby et al., 2014, 2001; Lewis-Peacock & Norman, 2014). Similarity-based MVPA, which is called representational similarity analysis (RSA) (Kriegeskorte et al., 2008), enables the exploration of relationship between multi-voxel patterns and stimuli by mapping them onto higher-order representational spaces (Haxby et al., 2014; Kragel & LaBar, 2016; Kriegeskorte & Kievit, 2013; Popal et al., 2019). Furthermore, using RSA, representational geometries can be compared between different sources such as means of measurement (e.g., fMRI, electroencephalograhy, magnetoencephalography, and functional near-infrared spectroscopies), brain regions, behavioral responses, and computational models (Kriegeskorte et al., 2008; Lee & Almeida, 2021; Nili et al., 2014). It is necessary to combine the data obtained from various modalities in social neuroscience (Popal et al., 2019) and emotion studies (Brooks et al., 2019; Chavez & Heatherton, 2015; Chen et al., 2020; Grootswagers et al., 2020; Li et al., 2022; Sievers et al., 2021; Skerry & Saxe, 2015; Ventura-Bort et al., 2022; Wegrzyn et al., 2017). In particular, RSA has been used to predict neural patterns from both dimensional (valence and arousal) or discrete emotions (see review in Kragel & LaBar, 2016; as proven in Saarimaki et al., 2016). However, these studies did not consider whether the dimensional emotions of the brain are similar to those of behavior despite emotion perception occurring in the conscious (behavioral) and unconscious (neural) manners (Gyurak et al., 2011).
Here, we tested this broader issue by comparing the representation of emotion in behavior, brain, and computational models. Specifically, we focused on the similarity of behavioral patterns for emotion perception in affective dimensions. To this end, we constructed a simple but intuitive behavioral paradigm inspired by the construction of representational spaces, wherein participants categorized emotional faces according to each emotional dimension by clustering the face images with the same emotion and physically spacing the clusters in accordance with perceived valence or arousal. Importantly, we included a condition in which the participants categorized emotional face images by applying valence and arousal dimension information simultaneously, reproducing the process of emotion perception more similar to real-life circumstances. This behavioral paradigm differs from those in previous studies on emotion, wherein each dimension was rated separately (e.g., Chavez & Heatherton, 2015; Grootswagers et al., 2020; Li et al., 2022; Skerry & Saxe, 2015; Ventura-Bort et al., 2022).
Although efforts have been made to explore both behavioral and neural correlates of emotion response (e.g., Dore et al., 2017) or use neural patterns as predictors of emotion regulation functions (Lee et al., 2008), they have focused only on certain types of emotion categories, emotional functions, or brain regions. To better understand how emotions are processed at explicit (or conscious) and implicit (or unconscious) levels, we considered both behavioral and neural methods for estimating affective emotions that psychologists typically depend on for dimensional measurements of continuous valence and arousal levels (Toisoul et al., 2021). Therefore, in this study, we aimed to investigate how the dynamics between behavioral and neural correlates in response to all emotion categories are reflected in the brain as topographical distribution. To explore how affective dimensions are projected onto the brain, we constructed topographic maps of their distribution by comparing representational geometries derived from behavioral and neural patterns of 246 regions parcellated in the human Brainnetome Atlas (http://atlas.brainnetome.org) (Fan et al., 2016). Finally, using emotional dimension topography, we tested whether emotion knowledge is derived from perceived or semantic information. We predicted that emotion representation in the brain and behavior differs according to affective dimensions. We also predicted that the emotion-processing brain regions will show dominance in using perceived information rather than brain semantic information, i.e., experienced an emotion rather than recognizing it by knowledge. These findings suggest that emotion knowledge is represented in both the brain and behavior differently according to affective dimensions.
Materials and methodsParticipantsIn total, 31 healthy participants (9 males and 22 females, aged 20–35 years, mean = 25.0, standard deviation [SD] = 3.9) participated in this study. All participants were right-handed and had normal or corrected-to-normal vision. None of the participants reported any history of neurological or psychiatric disorders. The current study was approved by the Institutional Review Board of the Korea Brain Research Institute, and all participants provided written informed consent.
Experimental design and proceduresAll participants completed two tasks: a behavior task (affective dimension judgment) on Day 1 and an fMRI task (emotion perception) on Day 2 with a gap of approximately 1 week (mean = 6.1 days, SD = 2.0). For the two tasks, we used a set of seven different facial-emotion expressions (happy, sad, angry, surprise, fear, disgust, and neutral) for 4 individuals (total 28 images, 7 emotions × 2 males and 2 females), randomly selected from the Yonsei Face Database (Chung et al., 2019) that consisted of total 518 emotional face images of 74 individuals (37 males and 37 females) (see Fig. 1).
 Thirty-one participants performed an affective dimension judgment task on Day 1. Behavioral representational dissimilarity matrices (RDMs) were calculated based on the Euclidean distance of all pairs of face stimulus clusters arranged on the screen. (B) On Day 2, the participants performed an emotion perception task during functional magnetic resonance imaging. Neural RDMs were calculated using the dissimilarity (1 − correlation) of all pairs of neural activity patterns. (C) Computational RDM was calculated with dissimilarity between visual features extracted in the highest layer on a deep learning model. Behavioral RDMs were correlated with neural RDMs to compare behavioral and neural representations. Computational RDM was correlated with neural RDMs to compare perceived and semantic representations.")
Overview of experimental procedures and analysis process. Emotion representation was constructed using behavioral responses, neural activity patterns, and computational visual features. (A) Thirty-one participants performed an affective dimension judgment task on Day 1. Behavioral representational dissimilarity matrices (RDMs) were calculated based on the Euclidean distance of all pairs of face stimulus clusters arranged on the screen. (B) On Day 2, the participants performed an emotion perception task during functional magnetic resonance imaging. Neural RDMs were calculated using the dissimilarity (1 − correlation) of all pairs of neural activity patterns. (C) Computational RDM was calculated with dissimilarity between visual features extracted in the highest layer on a deep learning model. Behavioral RDMs were correlated with neural RDMs to compare behavioral and neural representations. Computational RDM was correlated with neural RDMs to compare perceived and semantic representations.
On the first day of visitation, participants conducted an affective dimension judgment task comprising three sessions. In this experiment, the participants were instructed to arrange facial-emotion images on the computer screen according to their dimensions of emotion. In the first trial, the full set of facial-emotion images (7 emotions × 4 people) was presented around a circle (Fig. 2A). Participants were then told to place facial-emotion images on the screen according to their affective dimension by clicking and dragging each image. However, from the second to the last trials, the subsets of facial-emotion images were randomly presented to them to estimate an optimal similarity between images. In the valence dimension session, participants were instructed to place the facial-emotion image in the left (negative) or right (positive) direction. While in the arousal dimension session, the facial-emotion image was required to be placed either at the top (high) or bottom (low) level, and in the valence and arousal dimension session, participants placed the facial-emotion images by considering the negative or positive direction and high or low level. All participants conducted each session for 20 min and completed 26 trials on average (mean = 25.7, SD = 10.5).
Emotion perception task Example of an emotion-similarity judgment for valence, arousal, and valence & arousal. (B) Example of an emotion perception functional magnetic resonance imaging task.")
After 1 week, participants performed an emotion perception task during fMRI and completed five runs. In this task, participants were presented with emotional facial images (7 emotions × 4 people) of two males and two females, one after the other, and the data collected were used for the behavioral task assessment. During fMRI, each face image was presented for 1 s and separated by 5 s of fixation. In total, 96 vol per run were obtained, including 12 s of initial fixation and 12 s of closing fixation (Fig. 2B). All emotional facial images with 1000 × 600 pixels in size (approximately 10° of visual angle) were presented to the participants using Psychtoolbox-3 (http://psychtoolbox.org).
Magnetic resonance imaging data acquisition and processingAll structural and functional MRI data were obtained using a Siemens Magnetom Skyra 3.0T scanner with a 20-channel head coil (Erlangen, Germany). A high-resolution structural T1-weighted image was obtained using the following parameters: magnetization prepared rapid gradient echo sequence; acquisition matrix, 256 × 256; field of view, 230 mm; voxel size, 0.9 × 0.9 × 0.9 mm3; repetition time (TR), 2400 ms; and echo time (TE), 2.3 ms. fMRI data were acquired axially using a T2*-weighted single-shot echo-planar imaging (EPI) sequence using the following parameters: generalized auto-calibrating partially parallel acquisitions; acquisition matrix, 64 × 64; field of view, 192 mm; 36 (interleaved) slices; voxel size, 3.0 × 3.0 × 3.0 mm3; TR, 2000 ms; TE, 28 ms; flip angle, 90°; and gap, 0.9 mm.
Standard preprocessing of fMRI data was conducted using statistical parametric mapping (SPM12, http://www.fil.ion.ucl.ac.uk/spm/, Wellcome Trust centre for Neuroimaging, London, UK) (Friston et al., 1995) and an in-house MATLAB toolbox (MathWorks, Inc.). All fMRI data (EPIs) underwent slice timing correction, head motion correction (realignment), co-registration of T1-weighted images to the mean EPI, and spatial normalization to convert the EPIs into the Montreal Neurological Institute template space using nonlinear transformation in SPM12. The normalized EPIs were interpolated to 2.0 × 2.0 × 2.0 mm3 voxels, and spatial smoothing was not conducted to prevent spill-over effects between voxels (Todd et al., 2013).
Behavioral representation of emotion perceptionTo construct the geometrical models of behavioral, neural, and computational representations of emotions, we performed RSA (Kriegeskorte et al., 2008).
For behavioral representations, we used a multi-arrangement method (Kriegeskorte & Mur, 2012; Mur et al., 2013) in MATLAB (MathWorks, Inc.). The participants completed an emotion-similarity judgment task composed of 28 emotional facial expression images. The images were arranged according to the dimensions of emotion (i.e., valence, arousal, and valence & arousal) on the two-dimensional (2D) screen. The distance between the images was calculated using the mean of the Euclidean distances between each pair of emotional face clusters in each trial. The estimated dissimilarities were used to construct the representational dissimilarity matrices (RDMs) for behavioral emotion representation. The group-averaged behavioral RDM was constructed by averaging the behavioral RDMs of all participants.
Neural representation for emotion perceptionFor neural representations, we concatenated five runs and performed a general linear model (GLM) analysis that explained a response variable with a linear combination of categorical covariates. In the GLM analysis, each of the 28 emotions was modeled as a condition. The GLM was modeled using the following equation: y=Xβ+e, where y is the fMRI signal, β is the coefficient, and e is noise. Beta was converted into t-values that were used to construct neural RDMs in the 246 brain regions by calculating the correlation distance (i.e., 1–Pearson's r) of all pairs of 28 emotions. The group-average neural RDM was constructed by averaging the neural RDMs of all participants.
Neural encoding of dimensions of emotion derived from behavioral judgmentBased on the previous study (Parkinson et al., 2017), we used GLM decomposition to encode dimensions of emotion into the brain. Each neural RDM can be modeled using a linear combination of behavioral RDMs. To remove the variance accounted for the remaining RDMs from each RDM, we merely modeled each RDM with the other RDMs as predictor variables in an ordinary least squares regression and then took the residuals. This calculation was repeated 246 times.
Emotion representation of semantic visual informationTo extract semantic visual features from emotional face images, we conducted transfer learning using ResNet152, which is a deeper network of up to 152 layers (He et al., 2016). Total 518 emotional face images (e.g., 7 emotions × 74 individuals) were divided into a training dataset (N = 511) and testing dataset (N = 7). Because ResNet152 was pretrained on over a million images in ImageNet to classify images into 1000 object categories, we replaced the last fully connected (FC) layer with a new FC layer with seven output nodes and then applied a soft-max function to classify seven emotional categories. The classification accuracy was calculated for a testing image in the testing dataset. This process was performed using 74-fold cross-validation. The mean classification accuracy was 0.9575 (SD = 0.0876). Using this trained model, the visual features of each face image were extracted from the last FC layer. All processing for transfer learning was accelerated using graphics processing units (NVIDIA GeForce RTX 3090) in Python 3.9.7, PyTorch 1.11.0, and CUDA 11.5.
Statistical evaluation of representational geometriesWe performed a correlation analysis to examine the relationship between the representation of dimensional emotions in the brain and behavior. For statistical inference, a permutation-test was conducted by calculating actual correlation between two RDMs (e.g., neural RDM vs. behavioral RDM, or neural RDM vs. computational RDM). After randomizing only the labels of one RDM, the correlation was calculated. This process was repeated 10,000 times to generate a null distribution of the correlation coefficients. If the actual correlation coefficient is within the top 5% of the null distribution, we can reject the null hypothesis that all labels in the RDM have consistent patterns. To test which representational geometries or topographies of affective dimensions are more similar to each other, we tested their linear combinations using the Meng–Rosenthal–Rubin method (Meng et al., 1992).
ResultsRepresentational geometry of affective dimensions in behaviorFig. 3 shows behavioral representational geometries and multidimensional scaling plots of affective dimensions. In the valence RDM, happy was dissimilar to angry, sad, disgust, fear, and neutral, but was similar to surprise (Fig. 3A). In the arousal RDM, angry was dissimilar to neutral, happy, and surprise, but was similar to disgust, fear, and sad. The valence & arousal RDM had the same results on the valence and arousal RDMs. Emotions were differently distributed in a 2D space according to affective dimensions (Fig. 3B). Valence RDM was highly similar to valence & arousal RDM, and arousal RDM was highly similar to valence & arousal RDM (Fig. 3C). However, valence and arousal RDMs were less similar to each other. The correlation distance of valence–arousal was significantly higher than those of valence–valence & arousal (Meng's Z = 12.99, p < 0.0001) and of arousal–valence and arousal (Z = 12.72, p < 0.0001). However, there was no significant difference in correlation distance between valence–valence & arousal and arousal–valence & arousal (Z = 0.39, p = 0.6961).
 Representational dissimilarity matrices for valence, arousal, and valence & arousal. (B) Multidimensional scaling plots. (C) Statistical comparison of behavioral representational dissimilarity matrices for valence, arousal, and valence and arousal. ⁎⁎⁎p < 0.0001. n.s. non-significant.")
Representational geometry of affective dimensions derived from behavioral judgment. (A) Representational dissimilarity matrices for valence, arousal, and valence & arousal. (B) Multidimensional scaling plots. (C) Statistical comparison of behavioral representational dissimilarity matrices for valence, arousal, and valence and arousal. ⁎⁎⁎p < 0.0001. n.s. non-significant.
Fig. 4 shows whole-brain topography of affective dimensions. Topographic distributions of behavioral dimensions of emotion were calculated by encoding behavioral RDMs into each of the local neural RDMs using the GLM decomposition (Fig. 4A). Behavioral representations of emotion were differently distributed in the whole brain according to affective dimensions (Fig. 4B). Valence topography was highly similar to valence & arousal topography, and arousal topography was highly similar to valence & arousal topography (Fig. 4C). However, valence & arousal topography were less similar to each other. The correlation distance between valence and arousal topographies was significantly higher than those of valence–valence & arousal topographies (Z = 10.87, p < 0.0001) and arousal–valence & arousal topographies (Z = 12.35, p < 0.0001). However, there was less significant difference in correlation distance between valence and valence & arousal and between arousal and valence & arousal (Z = 2.46, p = 0.0141).
 General linear model decomposition of affective dimensions. (B) Whole-brain neural encoding of affective dimensions. (C) Statistical comparison of topographies for valence, arousal, and valence & arousal. ⁎⁎⁎p < 0.0001, ⁎p < 0.05.")
Topography of affective dimensions derived from neural encoding. (A) General linear model decomposition of affective dimensions. (B) Whole-brain neural encoding of affective dimensions. (C) Statistical comparison of topographies for valence, arousal, and valence & arousal. ⁎⁎⁎p < 0.0001, ⁎p < 0.05.
Fig. 5 presents the brain regions with significant correlations between neural and behavioral RDMs in each affective dimension. Among the 246 regions of interest, brain regions were selected with a threshold false discovery rate of < 0.05 and the top 5% of beta values (Fig. 5).
.")
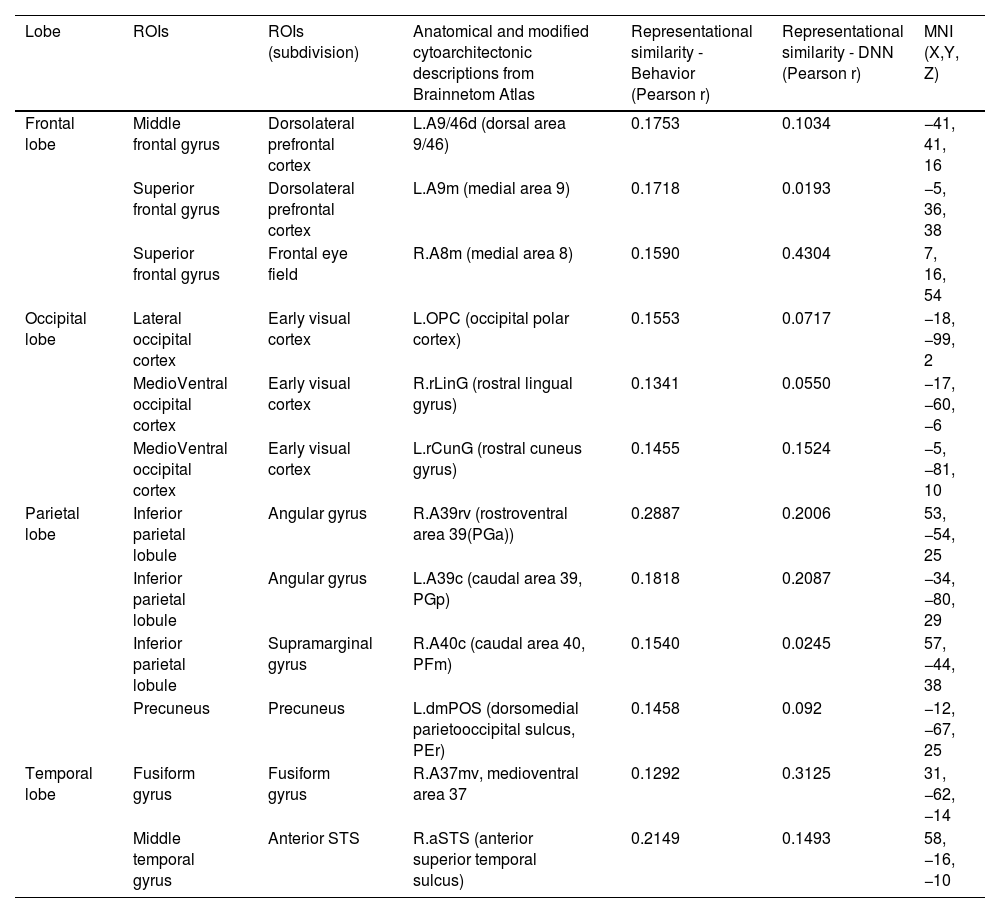
Perceived similarity for valence dimension was significantly distributed in regions such as the left dorsolateral prefrontal cortex (A9/46d, A9m), precuneus (dmPOS), right frontal eye fields (A8m), supramarginal gyrus (A40c), fusiform gyrus (A37mv), anterior superior temporal sulcus (aSTS), early visual cortex (OPC, rLinG, rCunG), and angular gyrus (A39rv, A39c) bilaterally.
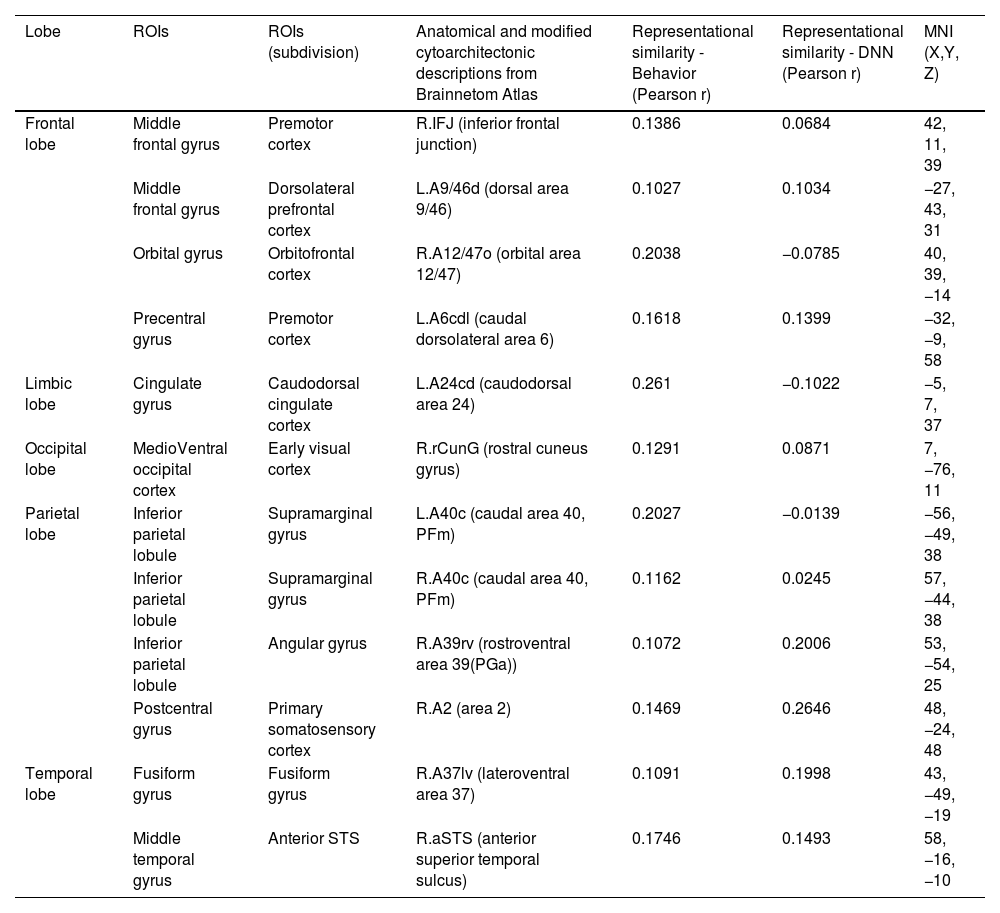
Significantly higher correlations of emotion similarity for arousal were distributed in the left dorsolateral prefrontal cortex (A9/46d), precentral gyrus (A6cdl), cingulate area (A24cd), right middle frontal gyrus (IFJ), orbitofrontal cortex (A12/47o), primary somatosensory cortex (A2), angular gyrus (A39rv), right fusiform gyrus (A37lv), aSTS, early visual cortex (rCunG), and bilateral supramarginal gyrus (A40c).
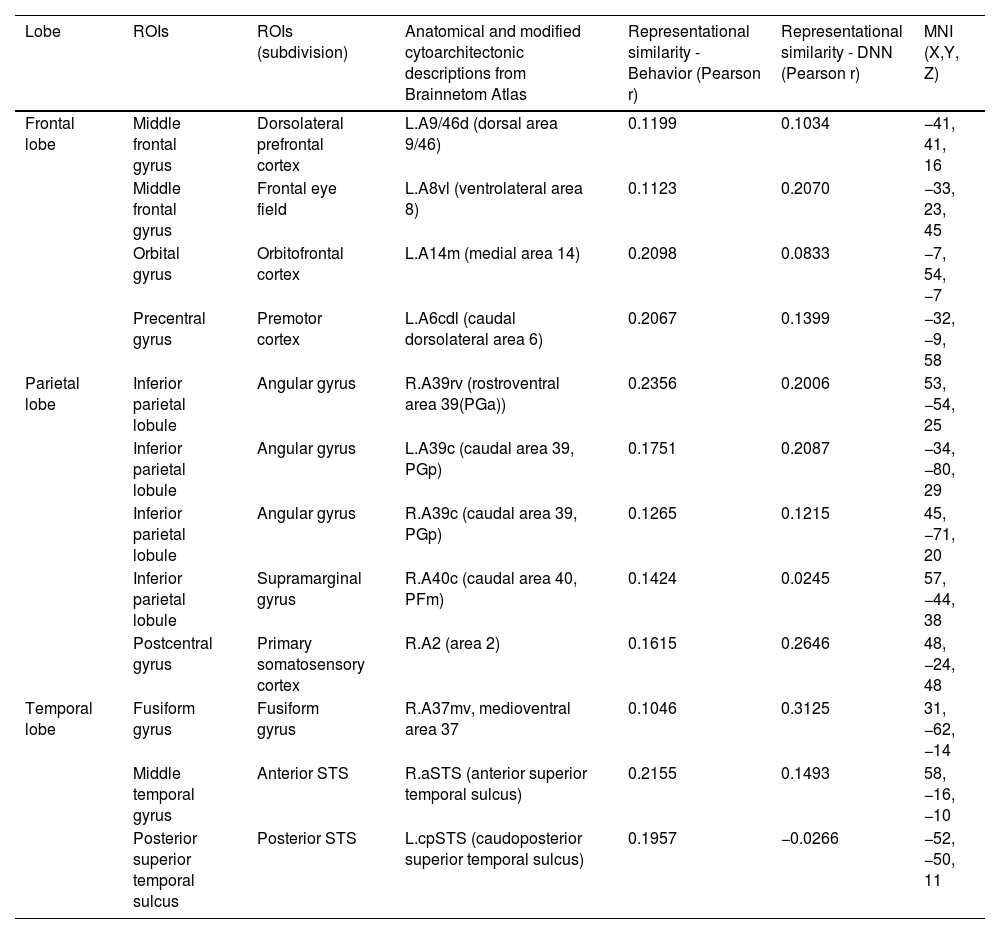
For the dimension in which valence & arousal were combined, significantly higher correlations of emotion similarity were distributed in the left dorsolateral prefrontal cortex (A9/46d), orbitofrontal cortex (A14m), frontal eye field (A8vl), precentral gyrus (A6cdl), posterior superior temporal sulcus (cpSTS), right supramarginal gyrus (A40c), primary somatosensory cortex (A2), fusiform gyrus (A37mv), aSTS, and angular gyrus (A39rv, A39c) bilaterally. Detailed information on the perceived similarity of the affective dimensions are summarized for valence (Table 1), arousal (Table 2), and valence & arousal (Table 3).
Brain regions showing high behavioral representations of emotion on valence topography (a threshold of the top 5% of correlation coefficients, total 12 regions).
Brain regions showing high behavioral representations of emotion on arousal topography (a threshold of the top 5% of correlation coefficients, total 12 regions).
Brain regions showing high behavioral representations of emotion on valence & arousal topography (a threshold of the top 5% of correlation coefficients, total 12 regions).
We further tested whether emotion representation in the above mentioned brain regions is driven by perceived emotion or semantic visual information of the stimuli. In the valence dimension, perceived emotion similarity was higher than semantic visual similarity in the left dorsolateral prefrontal cortex (A9/46d, A9m), precuneus (dmPOS), right angular gyrus (A39rv), supramarginal gyrus (A40c), and aSTS (Fig. 6). In contrast, semantic visual similarity was higher than perceived emotion similarity in the left angular gyrus (A39c), right frontal eye fields (A8m), fusiform gyrus (A37mv), and early visual cortex (OPC, rLinG, rCunG) bilaterally.

For the arousal dimension, a higher perceived similarity than semantic similarity was observed in the left preceantral gyrus (A6cdl), cingulate area (A24cd), right orbitofrontal cortex (A12/47o), premotor cortex (IFJ), early visual cortex (rCunG), aSTS, and bilateral supramarginal gyrus (A40c). A higher semantic similarity than perceived similarity was observed in the left dorsolateral prefrontal cortex (A9/46d), right primary somatosensory cortex (A2), angular gyrus (A39rv), and fusiform gyrus (A37lv).
For the valence and arousal dimensions, a higher perceived similarity than semantic similarity was found in the left dorsolateral prefrontal cortex (A9/46d), orbitofrontal cortex (A14m), precentral gyrus (A6cdl), cpSTS, right angular gyrus (A39rv, A39c), supramarginal gyrus (A40c), and aSTS. Semantic visual similarity was higher in the left frontal eye field (A8vl), angular gyrus (A39c), right primary somatosensory cortex (A2), and fusiform gyrus (A37mv) than perceived emotion similarity.
Topographical organization of emotion knowledgeFig. 7 summarizes the topographical organization of emotional knowledge. Emotion representations were situated differently in the brain according to affective dimensions. Valence-specific regions included the dorsolateral prefrontal cortex (A9m), frontal eye fields (A8m), precuneus (dmPOS), and early visual cortex (rCunG, rLinG, OPC) (Fig. 7). In contrast, arousal-specific regions included the cingulate gyrus (A24cd), middle frontal gyrus (IFJ), orbitofrontal cortex (A12/47o), fusiform gyrus (A37lv), and early visual cortex (rCunG). The valence & arousal regions were the frontal eye field (A8vl), orbitofrontal cortex (A14m), and cpSTS. Specifically, the dorsolateral prefrontal cortex (A9/46d), aSTS, angular gyrus (A39rv), and supramarginal gyrus (A40c) were commonly included in the valence, arousal, and valence & arousal dimensions.
Discussion
All knowledge on emotion is reflected in judgment or thought. Understanding how emotion knowledge is transferred from behavior to the brain is critical for harmonizing social interactions with other people. This study aimed to investigate the representational geometry of affective dimensions in the behavior and topography of affective dimensions in the brain. Using behavioral patterns for emotion judgment and topographic mapping of the brain, we showed that affective dimensions were similarly represented in the behavior and brain. Although we could not directly compare the affective dimensions of the behavior and brain, our findings distinctly demonstrated similar directions in the dimensional emotions of the behavior and brain. Remarkably, these dynamics between affective dimensions that contributed to neural patterns optimally reflected those between behavioral dimensions of emotion. For example, behavioral representational geometries and brain topographies of valence, arousal, and valence & arousal were significantly similar (Figs. 3 and 4). However, when the correlations of topographies were compared, we found that valence–arousal was significantly dissimilar to valence–valence & arousal and arousal–valence & arousal. In contrast, valence–valence & arousal were similar (behavior) or less similar (brain) to arousal. These findings may provide supporting evidence that behavioral decisions on emotion perception along each dimension of emotion are reflected in the brain through their dynamics. Emerging evidence on the topographic organization of dimensional emotion enables the study of emotion knowledge transfer from an emotional response in the brain to a change in behavior.
We further reported that the valence and arousal dimensions represented perceived emotions differently within the brain. We investigated which brain regions reflected each behavioral emotional dimension well and found different topographical distributions of the regions. First, we observed brain regions showing similar emotional neural representations for all behavioral dimensions of emotion (valence, arousal, and valence & arousal) (Fig. 5). For example, the fusiform gyrus (A37mv, A37lv) is involved in the processing of emotional facial expressions (Dricu & Fruhholz, 2020; Harry et al., 2013; Petro et al., 2013; Said et al., 2010). The right aSTS plays an important role in emotion perception when processing facial expressions (Narumoto et al., 2001). Intuitively, regions with more general executive functions also shared similar emotion representations with all three behavioral dimensions involved in emotion regulation, such as the angular gyrus (A39c, A39rv) (Kim et al., 2015). In particular, the dorsolateral prefrontal gyrus cortex (A9/46d, A9m) and supramarginal gyrus (A40c) are suggested to be involved in emotion regulation through attention deployment (Morawetz et al., 2016). Our findings suggest that common neural representations exist in the emotional dimension.
More importantly, emotional dimension-specific brain regions were observed. For instance, the left dorsomedial parietooccipital sulcus (dmPOS) and right frontal eye field (A8m) shared similar emotion representation with the valence dimension. While the frontal eye field modulates visual attention (Corbetta, 1998; Munoz & Everling, 2004; Schafer & Moore, 2007), similar to the dorsolateral prefrontal cortex and supramarginal gyrus, its right side (A8vl) also showed similar emotion representation with the valence and arousal dimensions in these regions. Interestingly, the left medial parietooccipital sulcus is a region related to self-projection (Buckner & Carroll, 2007; Chrastil, 2018; Spreng et al., 2009), which includes the dmPOS that shares similar emotion representation with the valence dimension only. In other words, a region that is more specifically involved in social functioning is selectively correlated with the valence dimension in terms of emotion representation. Similarly, the left cingulate gyrus (A24cd) only showed similar emotion representation for the arousal dimension; this is in line with previous findings on the assessment of internal emotional states (Grabenhorst et al., 2008; Rolls, 2015). The orbitofrontal regions showed high emotion representation for the arousal dimension (A12/47o) and valence and arousal dimension (A14m), which were both engaged in emotion regulation mainly through reward evaluation and learning (Elliott et al., 2000; Gourley et al., 2016; Hooker & Knight, 2006; Noonan et al., 2010; Plassmann et al., 2010). Other regions highly correlated with emotion representation of both arousal and valence and arousal dimensions are the premotor cortex (A6cdl, IFJ) and primary somatosensory cortex (A2), each contributing to emotion perception through the mirror neuron system (Gallaher, 2001) and body representation (Critchley et al., 2004; Gallo et al., 2018). Overall, this discriminative distribution of regions indicates that emotion is represented in the brain topologically unique to each emotional dimension.
The early visual cortex (rLinG, rCunG, OPC) shared similar emotion perception with both valence and arousal dimensions, but not with the valence & arousal dimension. In contrast, cpSTS shared similar emotion perception with only the valence & arousal dimension. These findings show that the neural representation of perceived emotion for the sum of each dimension of emotion is not equal to that for combined dimensions of emotion. Thus, we believe that our study provides evidence that behavioral emotion representation can be predicted from neural emotion representation derived from different topological distributions of regions relevant to different dimensions of emotion and their combinations.
To further test whether the relationship between behavioral and neural emotion representations is derived from perceived or semantic information, we compared perceived emotion and semantic visual similarities in the brain representation of affective dimensions. Perceived information was calculated from the similarity between neural and behavioral representations, whereas semantic information was extracted from the visual features of the facial stimulus in the last layer (Dharmaretnam & Fyshe, 2018; Lee & Almeida, 2021). This comparison is based on the assumption that the emotion-processing regions can cope with perceived emotion information rather than semantic information, compared with other regions, which might “know” rather than “feel” emotional cues. In our results, the emotion similarity representation of regions with more cognitive functions, such as the dorsolateral prefrontal cortex (A9/46d, A9m), supramarginal gyrus (A40c), dmPOS, aSTS, and cpSTS, tended to have a higher correlation with that of behavioral dimensions than the deep neural network (DNN). However, regions that are more relevant to visual processing of stimuli, such as the frontal eye field (A8m, A8vl), early visual cortex (rLinG, rCunG, OPC), and fusiform gyrus (A37mv, A37lv), tended to have a higher correlation with the DNN than the behavioral dimensions. It can be interpreted that the regions with a more regulative role in emotion processing represent emotion from the emotion information perceived from the stimuli, and that the areas that are more relevant to visual perception tend to rely on high-level visual information of the stimuli.
One notable limitation of our study is the range of emotions employed for determining affective dimensions. Although this study focused on the representations of affective dimensions, an unbalanced range of emotions was used for the valence dimension, such as negative valence (sad, angry, fear, and disgust) and positive valence (happy and surprise). Therefore, this limitation should be considered in future affective dimension studies.
In conclusion, we found that affective dimensions were similarly represented in both the brain and behavior. Specifically, behavioral patterns to emotions along dimensions reflected in the brain with similar geometrical orientation directly reflected the physiological representation observed in behavior. In addition, valence and arousal are represented in distinct brain networks.
FundingThis research was supported by KBRI basic research program through Korea Brain Research Institute funded by Ministry of Science and ICT (23-BR-05–01, 23-BR-05–02).
CRediT authorship contribution statementYoonsang Lee: Investigation, Formal analysis, Data curation, Visualization, Writing – original draft, Writing – review & editing. Yeji Seo: Investigation, Data curation, Formal analysis, Writing – original draft, Writing – review & editing. Youngju Lee: Writing – review & editing. Dongha Lee: Conceptualization, Formal analysis, Visualization, Funding acquisition, Supervision, Methodology, Writing – original draft, Writing – review & editing.
