


In order to assess mental health status, and the classification of both the overreporting and underreporting scales and indexes, 102 psychiatric prison inmates deemed mentally incompetent to stand trial completed the Spanish adaptation of the MMPI-2 under standard instructions (honest responding). The results showed patterns of consistent, non-random, nor extremely acquiescent responses. Moreover, no-outlier responses were detected. In line with the psychiatric diagnosis, all the psychiatric prison inmates were classified by the basic clinical scales as clinical cases of the psychotic dyad i.e., schizophrenia and paranoid ideation. The overreporting scales and indexes (i.e., F, K, Fb, F-K, Fp, Ds and FBS) classified the participants as malingerers, whereas the L, Wsd, and Od underreporting scales as good feigners. These scales assessing impression management i.e., consciously faking good biased responses, did not classify overreporters. Thus, they are robust indicators of honest responding among psychiatric prison inmates. The implications of these results for the practice of forensic psychology are discussed.
Se ha realizado un estudio ex post facto en una población de 102 penados psiquiátricos que respondieron bajo instrucciones estándar a la adaptación española del MMPI-2, con el objetivo de conocer el estado mental informado en el MMPI-2, así como el comportamiento de los indicadores de simulación y de disimulación. En los protocolos de respuesta no se observaron casos de outliers, patrones de respuestas totalmente azarosos o extremadamente aquiescentes, al tiempo que eran consistentes. Todos los penados psiquiátricos fueron clasificados, en consonancia con el diagnóstico psiquiátrico, en las escalas clínicas básicas como casos clínicos en la díada psicótica (i.e., esquizofrenia e ideación paranoide). Las escalas e índices de simulación utilizados (i.e., F, K, Fb, F-K, Fp, Ds y FBS) los clasificaron como simuladores, en tanto las escalas de medida de la disimulación L, Wsd y Od los clasificaron como disimuladores. Estas escalas, que forman parte del manejo de la impresión, esto es, de la manipulación favorable y consciente de la imagen, no informan de casos en poblaciones de simuladores. Así, éstas escalas serían indicadores robustos de no simulación. Finalmente, se discuten las implicaciones de estos resultados para la práctica forense.
One of the most crucial and complex tasks for forensic psychology and psychiatry is to establish psychological causal relations between people and their actions. The normative principle of culpability implies individuals deemed mentally incompetent cannot be held criminally responsible nor liable to punishment i.e., they lack guilt and cannot act criminally. In clinical terms, individuals who cannot be held criminally responsible on the grounds of mental incompetence are readily diagnosed, but translating this diagnosis to the field of forensics is unsustainable given that malingering is not suspected in clinical contexts, and thus remains undiagnosed (Rogers, 2008). In contrast, in forensic settings a differential diagnosis of malingering is a crucial requirement that should be based, not on clinical impressions or judgements, but on the exigencies of a reliable technique grounded on replicable empirical findings, and a known error rate ending in a tail (i.e., it is inadmissible for an honest subject to be identified as a malingerer) (American Psychiatric & Association, 2013; Graham, 2011; Greene, 2011).
As the goal of forensic evaluation is twofold i.e., to assess mental health, and to establish a differential diagnosis of malingering, a multimethod approach is required combining clinical interviews and psychometric instruments, of which the MMPI is the most extensively used (Graham, 2011; Greene, 2011; McDermott, 2012; Rogers, Sewell, Martin, & Vitacco, 2003). Thus, the aim of this field study was to assess self-reported mental health on the MMPI-2, as well as the response patterns of the over- and under-reporting markers, under honest response evaluation conditions i.e., standard instructions in a sample of psychiatric prison inmates.
MethodParticipantsThe sample consisted of a 102 Spanish psychiatric prison inmates, 93 men (91.2%), and 9 women (8.8%); age range 22 to 77 years (M = 39.28, SEM = 1.04). All subjects freely volunteered to participate and gave their informed consent. Though normally people with psychiatric disorders can be subject to evaluation (Greene, 2011), 58 were excluded due to a lack of cognitive competence or willingness to be evaluated. The main psychiatric diagnosis (51.0%) was schizophrenia and other psychotic disorders; followed by personality disorders (24.5%), and disorders related to illicit substance abuse (16.7%). In the remaining 7.8%, the main diagnosis was depressive disorder or infancy, childhood, and adolescent disorders.
This sample was contrasted with a second sample of 100 second degree prison inmates, convicted for offences against people, consisting of 90 males and 10 women aged 20 to 73 years (M = 41.09, SEM = 1.08).
Experimental designA quasi-experimental ex post facto study was designed with field data from psychiatric prison inmates, non-psychiatric prison inmates, the normative population, and the clinical population. Thus, the mental health of psychiatric prison inmates was measured on the MMPI-2, the consistency of responses and the validity of the protocols of psychiatric prison inmates were evaluated, taking as contrastive criterion normative and clinical populations, and a standard prison sample. The design sensitivity analysis, showed that for the comparison of the means of a sample of 102 participants with a given value, the probability of detecting (1-β) significant differences (α < .05) for a medium effect size, was 99%; and 100% for the comparison of proportions with a given value (.05 and .02), and 99% for the analysis of the association between variables.
InstrumentsThe psychometric instrument employed in this study was the adapted Spanish version of the MMPI-2 (Hathaway & McKinley, 1999). In order to measure the mental health of participants, the standard clinical scales were used, but on ethical and legal grounds, the Masculinity-Femininity scales were excluded. To analyse distortions in the responses, the standard validity scales, the Cannot Say (?), K, F, and L scales, and the additional validity markers were used since they are more useful than the original ones for the design of forensic practice (Fariña, Arce, Vilariño, & Novo, 2014), in relation to overreporting and underreporting (Baer & Miller, 2002; Rogers et al., 2003): the Back Infrequency Scales (Fb), Gough Dissimulation (Ds) (Gough, 1954), which was preferred to the revised version (Ds-r) since the Ds outperforms the Ds-r in the consistency of cut scores, and minimizes the risk of false-positives (Rogers et al., 2003), Faking-Bad (FBS) (Lees-Haley, English, & Glenn, 1991), Infrequency Psychopathology (Fp) (Arbisi & Ben-Porath, 1995) for assessing overreporting; and the Superlative scales (S) (Butcher & Han, 1995), Wiggins’ Social Desirability (Wsd) (Wiggins, 1959), Edwards’ Social Desirability (So) (Edwards, 1957), and Other Deception scale (Od) (Nichols & Greene, 1991), for the analysis of underreporting. Furthermore, the scales and indexes for the measurement of the consistency of responses, the TRIN and VRIN scales, and the |F-Fb| index were used.
ProcedureAccess to the clinical histories, and prison reports and records was granted in compliance with prevailing ethical and legal standards. All evaluations were undertaken individually and in private by staff trained in forensic clinical evaluation, under a relaxed friendly atmosphere that had been established previously in one or more sessions, according to the subject's ability to pay attention, concentration, memory, and the fatigue observed in task completion. No case exceeded 50minutes of continuous evaluation. In line with the guidelines proposed by Graham (2011) for evaluating in clinical-forensic settings, the evaluator ensured the responses reflected the true condition of the subject, and responded to any doubts or questions. Participants were informed of the objective of the study, the importance in collaborating with honest responses was underscored, and they were assured their data would remain anonymous and confidential. Finally, participants were debriefed and interviewed to ascertain the degree of motivation and implication in the task through the recall and comprehension of instructions, and by ensuring participants had understood and performed the task correctly (Palmer, Borrás, Pérez-Pareja, Sesé, & Vilariño, 2013; Rogers, 2008). The results confirmed the correct execution: concordance with the clinical diagnosis registered in medical records, there were no cases of unwillingness to cooperate with the evaluation, outliers, or patterns of completely random or extremely acquiescent responses.
The same procedure and steps were applied to the sample of second degree prison inmates. The evaluation was undertaken as part of the classification process during the prison admission stage.
ResultsThree steps (Arce, Fariña, Carballal, & Novo, 2006, 2009) relate the research model and knowledge transfer to forensic settings in the analysis of MMPI protocols. The first step is related to the total invalidation of the protocol i.e., unwillingness to cooperate in the evaluation, outliers, and patterns of completely random or extremely acquiescent responses. Thus, the results of contingencies on the No-Responses Scale (?) showed that all of the psychiatric prison inmates under assessment collaborated with the evaluation (r<10; Graham, 2011). Moreover, there were no cases of totally random patterns of responses in VRIN (r≥18), extremely acquiescent in TRIN (r≥18) or outliers in K (r>26) (Greene, 2008). Nevertheless, a 52% rate of extremely elevated scores (T70 + 5SD, i.e., T ≥120) were observed in F, and 25% in Fb, which could be related to a random response profile though it is also a distinctive sign of severely disorganized or acute psychotic patients (Graham, 2011; Greene, 2011), which is precisely the psychiatric diagnosis of the subjects in this study. Likewise, extremely high scores (|F-Fb|≥19; Greene, 2008) were observed in the F-Fb index i.e., they are not representative of the clinical population (p < .001) in 45.1% of psychiatric prison inmates. The crosscheck of each contingency in which |F-Fb| was ≥19, confirmed it was always a product of F>Fb, that is, the prevalence of positive psychotic symptomatology (F) over depressive symptomatology (Fb) (Greene, 2011). The psychiatric diagnosis of these subjects confirmed this predominance. Thus, the results of the F and Fb scales, and the F-Fb index concur with the diagnosis for this population. Having verified collaboration i.e., that no case was truly an outlier or no randomly responded protocols, we may conclude that the responses obtained were characteristic/representative of these types of populations so they may be included for analysis.
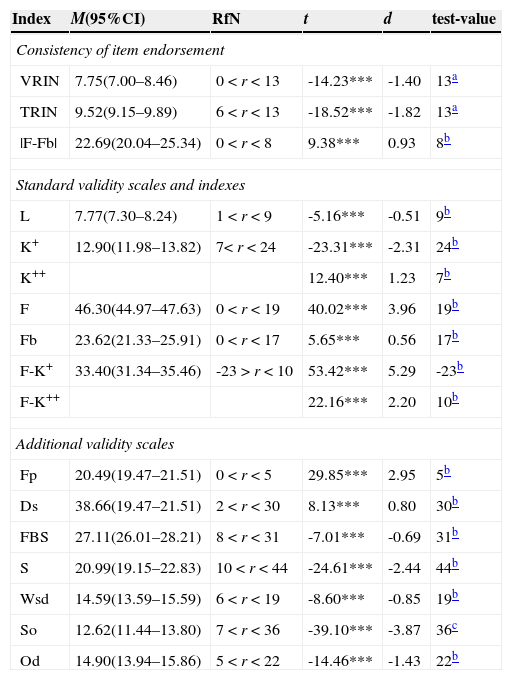
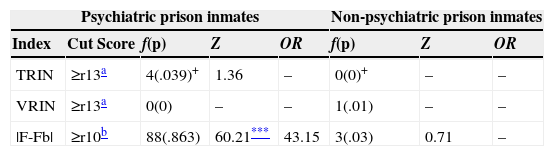
The second step in evaluating the consistency of the responses was in terms of acquiescent responses, indiscriminate true or false responses (TRIN), random responses (VRIN), and change (or stability) in response style (F-Fb). The results (see Table 1) reveal that the TRIN and VRIN means are within the region of normality, and are significantly distant from the criterion of inconsistency, with a large effect size. Moreover, the study of cases (see Table 2) showed all means fell within the region of normality in VRIN, whereas the prevalence for TRIN was as expected.
Measures, confidence interval for the mean, region of normality, and comparison of measures.
| Index | M(95%CI) | RfN | t | d | test-value |
|---|---|---|---|---|---|
| Consistency of item endorsement | |||||
| VRIN | 7.75(7.00–8.46) | 0 < r < 13 | -14.23*** | -1.40 | 13a |
| TRIN | 9.52(9.15–9.89) | 6 < r < 13 | -18.52*** | -1.82 | 13a |
| |F-Fb| | 22.69(20.04–25.34) | 0 < r < 8 | 9.38*** | 0.93 | 8b |
| Standard validity scales and indexes | |||||
| L | 7.77(7.30–8.24) | 1 < r < 9 | -5.16*** | -0.51 | 9b |
| K+ | 12.90(11.98–13.82) | 7< r < 24 | -23.31*** | -2.31 | 24b |
| K++ | 12.40*** | 1.23 | 7b | ||
| F | 46.30(44.97–47.63) | 0 < r < 19 | 40.02*** | 3.96 | 19b |
| Fb | 23.62(21.33–25.91) | 0 < r < 17 | 5.65*** | 0.56 | 17b |
| F-K+ | 33.40(31.34–35.46) | -23 > r < 10 | 53.42*** | 5.29 | -23b |
| F-K++ | 22.16*** | 2.20 | 10b | ||
| Additional validity scales | |||||
| Fp | 20.49(19.47–21.51) | 0 < r < 5 | 29.85*** | 2.95 | 5b |
| Ds | 38.66(19.47–21.51) | 2 < r < 30 | 8.13*** | 0.80 | 30b |
| FBS | 27.11(26.01–28.21) | 8 < r < 31 | -7.01*** | -0.69 | 31b |
| S | 20.99(19.15–22.83) | 10 < r < 44 | -24.61*** | -2.44 | 44b |
| Wsd | 14.59(13.59–15.59) | 6 < r < 19 | -8.60*** | -0.85 | 19b |
| So | 12.62(11.44–13.80) | 7 < r < 36 | -39.10*** | -3.87 | 36c |
| Od | 14.90(13.94–15.86) | 5 < r < 22 | -14.46*** | -1.43 | 22b |
Note. df(100); M = mean; 95%CI = 95% confidence interval; RfN = Region for normality i.e., 90% of the distribution (two-tailed: 5% lower and 5% upper); criteria for the RfN taken from clinical setting of Caldwell and Greene (Greene, 2008, 2011), and for TRIN and VRIN, as both are universal for the normative population (Butcher et al., 1989, 2001); d = Cohen's d.
*p < .05; **p < .001.
test-value = 95th percentile for clinical setting (Greene, 2011); +test-value for underreporting; ++ test-value for overreporting.
Classification rates of the item endorsement consistency indexes.
| Psychiatric prison inmates | Non-psychiatric prison inmates | ||||||
|---|---|---|---|---|---|---|---|
| Index | Cut Score | f(p) | Z | OR | f(p) | Z | OR |
| TRIN | ≥r13a | 4(.039)+ | 1.36 | – | 0(0)+ | – | – |
| VRIN | ≥r13a | 0(0) | – | – | 1(.01) | – | – |
| |F-Fb| | ≥r10b | 88(.863) | 60.21*** | 43.15 | 3(.03) | 0.71 | – |
Note.
98th percentile for clinical settings (Greene, 2008); – indicate that the ORs were not calculated as the prevalence of observed cases was not statistically significant; +TRIN raw scores ≤5 were also indicative of inconsistency (indiscriminate tendency to false response), registering the same rate of cases as was expected (.02) for psychiatric prison inmates, and none for non-psychiatric prison inmates;
As for changes in response style, the F-Fb index, the proportion of cases observed (.86) was significantly higher (see Table 2) than expected (.02) with a large effect size (OR>4.25). In comparison to non-psychiatric prison inmates, a significantly higher prevalence in the change in response style, χ2(1, N = 202) = 138.11, p < .001, ϕ = .84, was observed in psychiatric prison inmates. In short, the response of psychiatric prison inmates was characterized by a non-acquiescent and non-random pattern of responses, and a change in response style throughout the evaluation.
The third step, involved the analysis of protocol validity, which was only performed on populations that excluded systematically inconsistent responses or protocols with totally random patterns of responses (rVRIN<18), extremely acquiescent responses (rTRIN<18), and outliers (rK≤25). As these conditions were met, we continued to proceed accordingly. The results were subdivided, according to the availability in the commercial version of the MMPI-2, into original validity markers (available), and additional markers (unavailable, professionals have no direct access). The results of the original validity markers (see Table 1) show that the means for the L and K scales fell within the region of normality, whereas the means for the F and Fb scales fell outside and were significantly distant, with a large and moderate effect size, respectively, from normality towards overreporting (an alternative hypothesis would be suffering from severe injury, which was the case). Finally, the F-K index revealed a significant bias in responses towards overreporting among the population of psychiatric prison inmates, with a large effect size.
The additional markers were subdivided into overreporting markers: the Fp, Ds, and FBS scales; and underreporting markers: the S, Wsd, So, and Od scales (see Table 1). The mean for the Fp and Ds scales was significantly higher than the cut-off point for suspected overreporting with a large effect size, whereas the mean for the FBS fell within the region of normality. Finally, the population of psychiatric prison inmates scored within the region of normality in all of the scales evaluating underreporting.
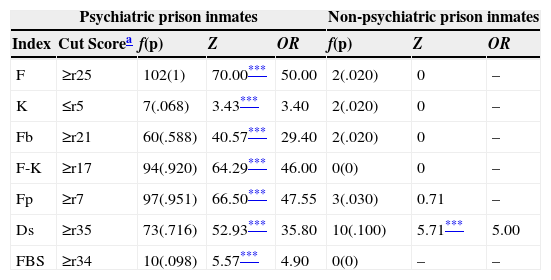
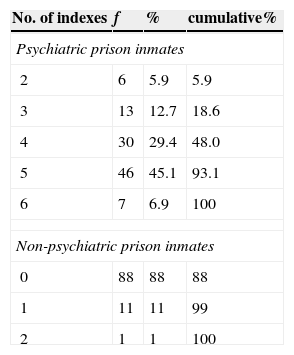
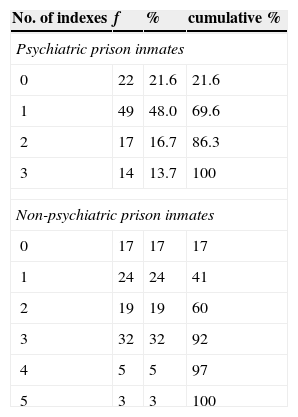
In terms of classification, all of the overreporting markers (see Table 3) showed a significant rate of classification of psychiatric prison inmates as overreporting responders, ranging from 6.8% of K, to 100% of F, whereas non-psychiatric inmates only scored high on the Ds Scale. Accumulatively, at least two markers (see Table 4) were found to be indicative of, reaching a maximum of 6 markers (mode = 5) for psychiatric prison inmates, whilst for non-psychiatric prison inmates, two overreporting markers were found in one subject, only one in 11 subjects, and none in 88 (mode).
Classification rate of overreporting markers in psychiatric and non-psychiatric prison inmates.
| Psychiatric prison inmates | Non-psychiatric prison inmates | ||||||
|---|---|---|---|---|---|---|---|
| Index | Cut Scorea | f(p) | Z | OR | f(p) | Z | OR |
| F | ≥r25 | 102(1) | 70.00*** | 50.00 | 2(.020) | 0 | – |
| K | ≤r5 | 7(.068) | 3.43*** | 3.40 | 2(.020) | 0 | – |
| Fb | ≥r21 | 60(.588) | 40.57*** | 29.40 | 2(.020) | 0 | – |
| F-K | ≥r17 | 94(.920) | 64.29*** | 46.00 | 0(0) | 0 | – |
| Fp | ≥r7 | 97(.951) | 66.50*** | 47.55 | 3(.030) | 0.71 | – |
| Ds | ≥r35 | 73(.716) | 52.93*** | 35.80 | 10(.100) | 5.71*** | 5.00 |
| FBS | ≥r34 | 10(.098) | 5.57*** | 4.90 | 0(0) | – | – |
Note.
98th percentile for clinical setting from Caldwell (Greene, 2008); test-value for Z-test and Ors = .02 (T70).
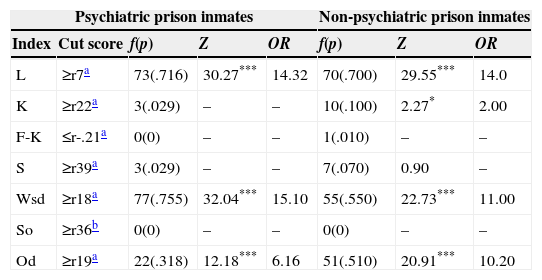
The assessment of underreporting on the additional (S, Wsd, So, and Od) scales showed the mean for the population of psychiatric prison inmates was within the region of normality (see Table 1). Strikingly (suspected malingering being the hypothesis), the assessment of cases on the underreporting scales (see Table 5) showed that L, Wsd and Od were significant, and highly (larges effect sizes in L and Wsd, and moderate in Od) sensitive to it. A similar effect was observed in the population of non-psychiatric prison inmates (the suspected hypothesis linked to obtaining prison benefits) with a significant prevalence rate in L, Wsd, and Od, and a large effect sizes, and a small effect sizes in K. Accumulatively, the data (see Table 6) revealed evidence of underreporting in 78.4% psychiatric prison inmates: in 48% with one indicator, in 16.7% two markers, and in 13.7% three markers. Comparatively, a similar number of underreporting markers was observed in psychiatric prison inmates (not suspected) as in non-psychiatric (suspected), χ2(1, N = 202) = 8.68, ns, ϕ = .058.
Classification rate of underreporting markers in psychiatric and non-psychiatric prison inmates.
| Psychiatric prison inmates | Non-psychiatric prison inmates | ||||||
|---|---|---|---|---|---|---|---|
| Index | Cut score | f(p) | Z | OR | f(p) | Z | OR |
| L | ≥r7a | 73(.716) | 30.27*** | 14.32 | 70(.700) | 29.55*** | 14.0 |
| K | ≥r22a | 3(.029) | – | – | 10(.100) | 2.27* | 2.00 |
| F-K | ≤r-.21a | 0(0) | – | – | 1(.010) | – | – |
| S | ≥r39a | 3(.029) | – | – | 7(.070) | 0.90 | – |
| Wsd | ≥r18a | 77(.755) | 32.04*** | 15.10 | 55(.550) | 22.73*** | 11.00 |
| So | ≥r36b | 0(0) | – | – | 0(0) | – | – |
| Od | ≥r19a | 22(.318) | 12.18*** | 6.16 | 51(.510) | 20.91*** | 10.20 |
Note.
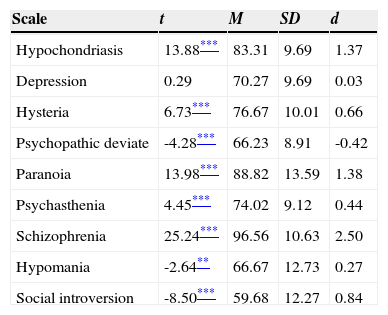
The comparison between the means for the population of psychiatric prison inmates (see Table 7) and the standard clinical scales with the decision criterion for clinical cases (test-value = T70), informed of the diagnostic impression of clinical cases (T>70) in hypochondriasis (excessively worried about health), conversion hysteria (somatization), paranoia, psychasthenia (obsessive-compulsive disorder, and generalized anxiety and stress), schizophrenia, and depression (T = 70). In contrast, the population of non-psychiatric inmates suffered from psychopathic deviation (i.e., antisocial), hypomania (bipolar disorder, manic), and social introversion (introversion, general subjective distress and negative affect). Strikingly, this population did not suffer from antisocial personality disorder, thus chronicity of delinquency was not to be expected.
One-sample t-test.
| Scale | t | M | SD | d |
|---|---|---|---|---|
| Hypochondriasis | 13.88*** | 83.31 | 9.69 | 1.37 |
| Depression | 0.29 | 70.27 | 9.69 | 0.03 |
| Hysteria | 6.73*** | 76.67 | 10.01 | 0.66 |
| Psychopathic deviate | -4.28*** | 66.23 | 8.91 | -0.42 |
| Paranoia | 13.98*** | 88.82 | 13.59 | 1.38 |
| Psychasthenia | 4.45*** | 74.02 | 9.12 | 0.44 |
| Schizophrenia | 25.24*** | 96.56 | 10.63 | 2.50 |
| Hypomania | -2.64** | 66.67 | 12.73 | 0.27 |
| Social introversion | -8.50*** | 59.68 | 12.27 | 0.84 |
Note. df(101); test-value: T = 70.
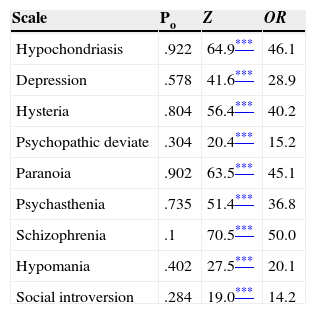
The prevalence of diagnostic impression of disorders (see Table 8) was significantly high with a more than large effect sizes (OR>20, that is, >1.5SD) on all the scales, particularly in the psychotic dyad, paranoia and schizophrenia, that the law of precedence relates to mental incompetence, with 90.2%, and 100% classification rates, respectively.
Comparison of the prevalence of clinical cases in psychiatric prison inmates with the probability expected for the normative population.
| Scale | Po | Z | OR |
|---|---|---|---|
| Hypochondriasis | .922 | 64.9*** | 46.1 |
| Depression | .578 | 41.6*** | 28.9 |
| Hysteria | .804 | 56.4*** | 40.2 |
| Psychopathic deviate | .304 | 20.4*** | 15.2 |
| Paranoia | .902 | 63.5*** | 45.1 |
| Psychasthenia | .735 | 51.4*** | 36.8 |
| Schizophrenia | .1 | 70.5*** | 50.0 |
| Hypomania | .402 | 27.5*** | 20.1 |
| Social introversion | .284 | 19.0*** | 14.2 |
Note. N = 102. Po= Proportion of pathology observed in the psychiatric prison inmates; test-value = .02 (T70).
From the results of this study we may draw the following conclusions.
Total invalidity of the protocol. No cases of outliers, totally random patterns of responses or extremely acquiescent responses were found in the responses of non-psychiatric prison inmates. Moreover, psychiatric prison inmates who are in sufficient cognitive conditions to be evaluated at the time of the evaluation, can be evaluated with this instrument (Greene, 2011).
Analysis of the consistency of responses. The protocols of this study were consistent. The results of the responses of psychiatric prison inmates showed no systematic tendency of responses in a true or false direction (TRIN). Likewise, psychiatric prison inmates did not exhibit a pattern of random responses (VRIN). In short, the responses of psychiatric prison inmates were consistent. Similarly, the responses of people instructed to malinger (Arce, Pampillón, & Fariña, 2002; Arce et al., 2006, 2009) were also consistent. However, the explanation for both is grounded on different assumptions: the honest responses of psychiatric prison inmates and clinical populations, and the adoption of a response strategy sensitive to the content of malingering items (Greene, 2011), that is, they evaluate if the content is favourable or unfavourable for the malingering of a psychopathological profile.
Analysis of change in response style. In psychiatric prison inmates, a significant and even acute change in response style was observed on the F-Fb index (F was located in the first 370 items, and Fb from 370 onwards), suggesting it was an indicator of inconsistency. However, this assumption is theoretically flawed and cannot be substantiated by the data given that F and Fb measure different constructs, thus one cannot determine from the discrepancies between both which individuals have changed their response style. A very elevated score on F is indicate of very severe psychological symptoms, that is, positives (i.e., hallucinations and/or delusions) that are infrequent in the clinical population, but not so in the prison clinical records reviewed in this study (the antecedents, psychiatric diagnosis, and legal rulings validate the presence of these symptoms), in that very high scores on the Fb were related to depressive thoughts, suicidal ideation, and other related symptoms (Greene, 2011). In short, the change in response style is more apparent than real given that the scales involved do not measure the same construct. Moreover, empirical findings reveal that this index requires the combination of VRIN in order to be effective for detecting random responses. Nevertheless, VRIN validated all of the protocols of the population of psychiatric prison inmates. In any case, incremental validity of this combination is minimum (Greene, 2011). Bearing in mind that a change in response style does not imply inconsistency, which may be observed in populations of psychiatric prison inmates, but not in malingerers, nor in the general clinical population (Butcher et al., 1989, 2001; Greene, 2008), the corroboration of this change is a positive indicator of honest responses.
Measures of overreporting. The scales and indexes measuring overreporting (i.e., F, K, Fb, F-K, Fp, Ds, and FBS), classified, in comparison to the clinical population, a significantly high number of psychiatric prison inmates as overreporters. Moreover, this classification had an accumulative effect (mode = 5). Thus, the means for the prison inmate population were in the region of overreporting, with the exception of the FBS and K scales that fell within the region of normality. In terms of suggested overreporting strategies, the F family (i.e., F, Fb, F-K, and Fp), with the underlying assumption that malingering is related to unusual symptoms, in particular psychotic ones, was extremely sensitive in this population with overreporting classification rates ranging from 58% for the Fb, more than 90% for the Fp and F-K, to a 100% of the F. In particular, the Fp suggested the presence of a strategy for malingering of rare symptoms i.e., infrequently informed symptoms (e.g., < .05) in clinical population; and the F, Fb, and F-K scales of quasi-rare symptoms i.e., infrequently informed symptoms in the normative population. However, these symptoms that appear in the diagnosis and medical records were, in this case, markers of genuine severe mentally disordered cases, and not malingering. The Ds Scale, with a mean in the region of overreporting, and significantly high overreporting classification rate suggested the use of a malingering strategy “erroneous stereotypes” i.e., endorsing symptoms not endorsed by the normal clinical population. Finally, the means for the K Scales (low scores indicated exaggeration of problems), and the FBS (related to the malingering of personal injury) were within normality, with significant overreporting classification rates, but with a smaller effect sizes than previous ones. Succinctly, to a greater or lesser extent, all of the measures of overreporting exhibited significant rates classifying psychiatric prison inmates as overreporters in honest response conditions i.e., they would be false positives (identifying a genuine patient as a malingerer). As this effect is accumulative, these scales and indexes for evaluating overreporting are not valid for this purpose in the context of psychiatric prison inmates.
Measures of underreporting. The means for underreporting among psychiatric prison inmates were in the region of normality, which was surprising since it is the opposite to malingering (hypothesis to be contrasted in this case in forensic practice), and severe psychopathological injury, the L, Wsd, and Od scales significantly classified more underreporters than was initially expected. These three measurement scales were part of the “Impression Management” factor of Paulhus (1984) model that embraces the conscious and favourable manipulation of self-image, versus the unconscious Self-Deceptive Enhancement (K, F-K, So, and S scales). Conscious underreporting markers were not observed among overreporters as intentionality is required for the distortion of response, which is contradictory to overreporting (Arce et al., 2002, 2006, 2009). Thus, the detection of conscious underreporting markers, with a prevalence of around 80%, would be in line with the forensic technique of the Global Evaluation System (Arce & Fariña, 2005), a positive no overreporting criterion validating the protocol obtained.
The standard and additional validity markers. The commercial version of the MMPI-2 only includes the standard validity scales and indexes (i.e., L, F, K, F-K, and Fb), thus the analysis of overreporting would rest on F, K, Fb, and F-K, and underreporting on L, K, and F-K. Nonetheless and under these circumstances, the hypothesis of overreporting was strongly suggested (100% of cases in F; more than 90% of F-K, and nearly 60% in K), whereas for underreporting this only occurred in L, given that K and F-K were not sensitive to underreport. This annuls the efficacy of the resulting forensic technique since it maintains the hypothesis of overreporting, and undermines the value of the underreporting markers as a positive criterion: only L was sensitive to underreporting, leading to a lack of intermeasure consistency (K and F-K were not sensitive). Notwithstanding, taking all of the original and additional markers as a whole, the populations of psychiatric prison inmates, and non-psychiatric prison inmates in the prison admission stage were vastly different in terms of the overreporting markers i.e., strongly present in the population of psychiatric prison inmates (mode = 5), and strongly absent in second degree prison inmates in the prison admission stage (mode = 0). From all of these, a forensic technique for discriminating between both populations, that eliminates the probability of false positives (classification of honest responses as overreporting) in line with forensic standards, could be driven.
Diagnostic impression. The most prevalent diagnostic impression (p = 1) of a mental condition among psychiatric prison inmates on the standard clinical scales was schizophrenia followed by paranoia, which was concordant (convergent validity) with the diagnosis, psychiatric records, and court rulings on mentally incompetence owing to schizophrenia or paranoid delusion disorder. Profiles corresponding to a “psychotic V” configuration were observed, that is, extremely high scores (T>80) in schizophrenia and paranoia, and low scores in psychasthenia, characteristic of individuals with disordered thinking, delusions, and hallucinations, a psychopathology that legally defines a person as mentally incompetent (Arce et al., 2002). Thus, the main diagnostic impression of an incapacitating psychotic disorder on the MMPI-2 was validated. It is worth noting the “psychosomatic v” configuration (higher hypochondriasis and hysteria than depression) implied the population of psychiatric prison inmates converted psychological problems into physical symptoms, chronic psychopathology, and resistance to treatment (e.g., minimizing problems, resistance to change). Due to the minimization of symptoms, this configuration was associated to high scores on the underreporting scales, and in particular the L scale (Greene, 2011).
Psychiatric prison inmates and antisocial behaviour. Psychopathy (Psychopathic Deviation Scale), understood as a permanent pattern of antisocial behaviour, was not a distinctive characteristic of the psychiatric prison population in comparison to other clinical populations. Thus, the relationship between antisocial and delinquent behaviour, and psychiatric prison inmates was weak.
This study is subject to several limitations. First, the results of this study are not generalizable to other populations of psychiatric prison inmates as cognoscitive incompetent from giving informed consent or being evaluated were grounds for exclusion from this study. Second, the psychometric instrument has no diagnostic value, but provides diagnostic impressions of mental health, and for establishing a differential diagnosis of overreporting. The forensic psychologist must corroborate these impressions of mental health with the clinical interview, behavioural observation, and other tests (Vilariño, Arce, & Fariña, 2013). Third, the results and inferences are not generalizable to instruments other than the MMPI-2. Fourth, the statistical significance and power do not imply any intrinsic validity in judicial context.
FundingThis research was funded by the Project with reference EDU2011-24561 (Dirección General de Investigación y Gestión del Plan Nacional de I+D+i; Spanish Ministry of Science and Innovation).
Available online 11 October 2014
