


The purpose of this paper is to investigate economic value added (EVA), as a performance measurement model, as compared to six traditional accounting performance measures vis-à-vis the market value of firms listed on Tehran Stock Exchange (TSE). The paper also explores the effect of the degree of operating leverage, financial leverage, and efficiency on market value added.
The paper uses a sample of 450 firm-year observations from the Iranian market and applies pooled ordinary least square and panel data regression. The results indicate that EVA has no superiority over other performance measures, and that return on sales and return on assets are more powerful than EVA in explaining firm market value. Due to EVA's lack of correlation with market value, investors cannot use it as an internal value creation measure along with the traditional performance measures. This paper is one of the first studies on the relevance of traditional accounting and value-based performance measures in explaining TSE market values. The results extend EVA's role in explaining market values, and address its effect on investors’ decisions in a continental Asian market with characteristics similar to that of Iran.
In today's competitive world, a main business goal is to create value and wealth for shareholders. Businesses that focus on shareholder value are much healthier and improve the overall economy (Kim, 2004). As a result, companies need reliable and accurate activity measures.
Over the last few years, traditional performance measures have been criticized due to their inability to incorporate the full cost of capital, thus impugning accounting income as a consistent firm value predictor (Ehrbar, 1998; Rappaport, 1986; Stewart, 1991). Furthermore, they do not provide strategic value management guidance (Kim, 2004). In recent years, new measures have been introduced, including economic value added (EVA), market value added (MVA), cash value added (CAV), cash flow return on investment (CFROI), discounted economic profit (DEP), and shareholder value added (SVA). EVA was first introduced by Stern, Stewart and Coin (1991), as a measure that calculated the value added after deducting the cost of capital. Stewart (1991) claimed that EVA is superior to other measures, and many researchers have supported EVA as well (Bao & Bao, 1998; Grant, 2003; Lee & Kim, 2009; Lehn & Makhija, 1996; Milunovich & Tsuei, 1996; O’Byrne, 1996; Uyemura, Kantor, & Pettit, 1996; Worthington & West, 2004). On the other hand, some researchers have rejected Stewart's claim, noting a weak relationship at best between EVA and a firm's market value or stock returns (Biddle, Bowen, & Wallace, 1997; Chen & Dodd, 1997, 2001; De Villiers & Auret, 1997; De wet, 2005; Ismail, 2006; Kramer & Pushner, 1997; Kyriazis & Anastassis, 2007, Kumar & Sharma, 2011a, 2011b; Sparling & Turvey, 2003; Turvey, Lake, Van Duren, & Sparing, 2000; Worthington & West, 2001).
This study compares EVA to traditional firm performance measures, that is, return on assets (ROA), return on equity (ROE), return on capital employed (ROCE), return on sales (ROS), earnings per share (EPS) and dividend per share (DPS). Another purpose is to test whether the efficiency and degree of operating and financial leverage have any correlation with TSE-listed firms’ MVA. To our knowledge, this study is the first to address value-based and traditional firm performance measures in Iran and their effect on MVA. The study also tests and correlates these variables with MVA as an external measure of performance so as to find whether EVA has any superiority over traditional performance accounting measures. Moreover, the relationship of efficiency, degree of operating leverage, and degree of financial leverage with firms’ market value is examined. The results of this study could help managers determine which variables contribute most to MVA. A better knowledge of the drivers of MVA should also allow investors to improve their strategic and tactical asset allocations.
The study explores the value relevance of both traditional accounting and value-based performance measures to emerging markets. In other words, we would like to test whether the lack of conclusive evidence regarding EVA is confined to mature markets or applies also to large, emerging Asian markets such as the Tehran Stock Exchange (TSE).
Therefore, we believe it is important to conduct a new study that, for the first time, uses Iranian data and applies more reliable regression techniques for a sample of cross-sectional time series data. We test an Iranian sample of 450 firm-year observations for the period 2003–2008, and report evidence that supports Chen and Dodd (1997), Biddle, Bowen, and Wallace (1998), and Kumar and Sharma (2011a, 2011b), that is, earnings are more associated with stock return and market value than EVA. Further, we show that ROS and ROA are more powerful than EVA in explaining firm market value. The remainder of the paper is organized as follows: Section two discusses the background literature. Section three discusses the research methodology, sample, and variables. Section four presents the results and discusses the findings of the study. Finally, section five summarizes the findings and concludes the discussion.
Prior literature and hypothesis developmentEVA is one of the first value-based management measures and has been the subject of many studies. According to Stern, Stewart, and Chew (1996), EVA's value stems from its ability to be the main part of an integrated financial management system, leading to decentralized decision making. EVA measures the difference between the return on a firm's capital and the cost of that capital (Epstein & Young, 1998).
The value of EVA has long been debated. Stewart (1991) argued that EVA can be a good predictor of future business performance, while Anderson and Bey (1998) concluded that EVA varies over time and it is significantly correlated with accounting variables. However, Appleby (1997) argued that EVA is a lagging indicator. Nonetheless, EVA can be used for different internal management activities such as CEO performance (Coles, McWilliams, & Sen, 2001), optimal resource usage (Rompho, 2009; Zimmerman, 1997), and strategic goals (Bahri, St-Pierre, & Sakka, 2011).
MVA is the present value of all future EVA; to create market value, firms need to achieve positive EVA (Zafiris & Bayldon, 1999), which represents the amount of wealth created for shareholders (a negative MVA represents the amount of capital wasted by management) (Kim, 2004). Successful firms add to their MVA and thus increase the value of invested capital. From an investor's viewpoint, MVA is the best external measure of a firm's performance. Also, MVA can represent the net present value of a company's current and contemplated capital investment projects. Moreover, MVA is closely associated with the ability of a business to create value in the future.
Stewart's 1991 evaluation of 613 American companies in terms of average EVA during the period 1987–1988 indicated that companies with a positive EVA correlate very highly with MVA, both for the changes in values and the average values used, while in companies with a negative EVA, the correlation was quite low. Stern, Stewart, and Chew (1994) argued that accounting measures such as earnings, earnings growth, dividends, dividend growth, return on equity (ROE), and even cash flow are not the key operating measures of firm performance, but EVA is one such measure that is closely linked to a firm's market value. They also showed that EVA has a significant effect on MVA. Lehn and Makhija (1996) studied 241 large US companies during the period 1987–1993 and found that EVA and MVA are positively related to stock returns, and that EVA has a slight edge over the traditional performance measures. Uyemura et al. (1996) studied the relationship between MVA and five performance measures—that is, EVA, net income, ROA, EPS, and ROE—in a sample of 100 US banks during the period 1986–1995 and found that EVA has the highest MVA correlation.
Athanassakos (2007) selected 300 Canadian companies to see whether they used value-based management methods and investigated the stock price of those companies embracing such methods. The results suggested that companies that use EVA had a better stock price than those not using it. Fernandez (2003) analyzed 582 US companies using EVA, MVA, net operating profit after tax (NOPAT), and weighted cost of capital (WACC), and calculated the 10-year correlations between the yearly MVA increase and yearly EVA, NOPAT, and WACC. Fernandez found that the correlation between the increase in yearly MVA and NOPAT was greater than its correlation with EVA. De wet and Hall (2004) studied the relationship between EVA, MVA, and leverage, and found that debt increases lead to increased financial costs, but, to the same extent, reduced capital costs. Thus, financial leverage does not affect MVA.
Zaima, Turetsky, and Cochran (2005) studied the relationship between EVA and MVA while controlling for the economic effect of the market. Results showed that EVA and gross domestic product significantly affect MVA vis-à-vis managerial decisions made after controlling for the systematic economic effect. Kyriazis and Anastassis (2007) examined the Athens Stock Exchange's EVA information content and reported that although it is useful as a performance evaluator, there is no significant relationship with MVA, and it has no superiority to other measures. Lee and Kim (2009) selected 353 companies between 1985 and 2004 and compared three new performance measures—that is, refined EVA, EVA, and MVA—to three traditional ones, finding that MVA and refined EVA are more effective for evaluating hospitality industry company performance.
De wet (2005) compared EVA and traditional accounting measures as drivers of shareholder value in 89 South African companies during the period 1994–2004 and found stronger correlation between MVA and operating cash flow (OCF), but very little correlation between MVA and EPS and MVA and DPS. Kramer and Pushner (1997) studied the relationship between EVA and MVA in 1000 companies during the period 1982–1992 and found no clear evidence to support the contention that EVA is the best internal corporate success measure. Misra and Kanwal (2007) studied Indian companies between 2002 and 2006 and argued that traditional accounting measures cannot predict corporate performance and that EVA is significantly associated with MVA. Biddle et al. (1998) studied 6174 companies during the period 1984–1993 and rejected Stewart's claim of EVA superiority, arguing that net income before extraordinary items is more effective in explaining stock returns and firm value. Finegan (1991) studied 450 medium-sized US enterprises and concluded that EVA has greater explanatory power than such measures as capital growth, ROC, EPS, and cash flow. Using 1000 firms between 1983 and 1994, Biddle et al. (1997) studied whether EVA's relative information content exceeds that of OCF or earnings, and whether EVA offers any incremental valuation advantage. Biddle et al. found that earnings provide a superior metric of relative information, and that EVA provides no superiority in its association with stock returns or firm value.
Grant (2003) confirmed the relationship between EVA and corporate valuation using a sample of 983 US companies between 1985 and 1993, with results that supported Stern et al.’s claims. Ismail, in a 2006 study of UK companies, tested EVA's relative and incremental information content and other performance measures using panel data regression. The results failed to support Stern et al.’s hypothesis as net operating income after taxes and net income outperformed EVA and residual income.
Kim (2006) provided empirical evidence on the relative and incremental information content of EVA and traditional performance measures, earnings, and cash flow in the US hospitality industry. EVA's information content and other explanatory variables indicated that earnings are more useful than cash flow in explaining hospitality firms’ market value. Kramer and Peters (2001) examined EVA's ability to serve as a proxy for MVA across 53 US industries and found that the, “marginal costs of using economic value added as a proxy for market value added are not justified by any marginal benefits”. Riahi-Belkaoui (1993) examined the relative and incremental content of value added, earnings, and cash flows in the US context. The results indicated that the information content of value added is a major market return determinant, providing incremental information content beyond both net income and cash flow.
Kumar and Sharma (2011a) compared EVA with traditional performance measures in 873 non-financial Indian companies during the period 2000–2008 and found that NOPAT and OCF are more effective than EVA for evaluating firm performance; regarding market value, EVA contributes less than NOPAT, OCF, EPS, and RONW. Kumar and Sharma (2011b) studied 608 Indian companies and found that traditional measures do not have a significant effect on companies’ MVA and that EPS is negatively related to market value. Moreover, the results of this research indicated that NOPAT and OCF are superior to EVA in explaining company market value.
Considering the literature, the following hypotheses are formulated:
H1:EVA is superior to the traditional measures of performance in determining the value and market value of Iranian firms.
- •
H1a:There is a positive relationship between EVA and MVA.
- •
H1b:There is a positive relationship between earnings per share and MVA.
- •
H1c:There is a positive relationship between dividend per share and MVA.
- •
H1d:There is a positive relationship between return on assets and MVA.
- •
H1e:There is a positive relationship between return on equity and MVA.
- •
H1f:There is a positive relationship between return on capital employed and MVA.
- •
H1g:There is a positive relationship between return on sales and MVA.
- •
H2:There is a positive relationship between efficiency and MVA.
- •
H2a:There is a positive relationship between sales on fixed assets and MVA.
- •
H2b:There is a positive relationship between sales to capital employed and MVA.
- •
H3:There is a negative relationship between leverage and MVA.
- •
H3a:There is a negative relationship between degree of operating leverage and MVA.
- •
H3b:There is a negative relationship between degree of financial leverage and MVA.
- •
H4:EVA, along with the traditional accounting performance measures, has information content.
The sample company financial data was collected using software provided by the Tehran Stock Exchange (TSE). This study uses all TSE-listed firms during the period of 2003–2008 for which data was available. As of the end of 2003, there were 328 firms listed on TSE, which is one of the oldest and biggest capital markets in the Middle East. Because of the specific nature of their activities, firms related to banking and financial institutions were excluded. Moreover, companies with long periods without transactions (more than two months) were excluded. The final sample consisted of 75 firms, and a balanced panel set of 450 firm-year observations was obtained.
MeasuresIndependent variablesThe theoretical model of this research considers EVA, EPS, DPS, ROA, ROE, ROCE, ROS, SOA, SOCE, DOL and DFL as independent variables. These variables are expected to be related to the dependent variable. The method of the present research is similar to that of Kim (2006), Irala (2007), Stewart (1991), Milunovich and Tsuei (1996), O’Byrne (1996), and Uyemura et al. (1996). EVA attempts to capture the true economic profit of a company (Maditinos, Sevic, & Theriou, 2009), and can be calculated as follows where EBIT is earnings before interest and tax:

In order to calculate EVA, we made certain adjustments as proposed by Stern et al., such as non-cash expenses due to accounting records (except depreciation). To remove the effect of such expenses, several reserves such as allowance for bad debts and inventory obsolescence, investment and accrued expense reserves, employees’ termination benefits, and deferred tax are added to capital employed; any increase in these reserves is added to profit after tax. What is meant by capital employed in the above relation is the sum of interest-bearing debts and equity, which is modified by the following adjustments:
- •
Adding accounting reserves such as allowance for doubtful accounts
- •
Adding research and development and marketing costs
- •
Adding abnormal accumulation of losses minus abnormal earnings after tax
Earnings per share (EPS) are calculated by dividing net income by the average number of common shares outstanding. Dividend per share (DPS) is calculated by dividing dividends by average number of common shares outstanding. Return on assets (ROA) is a profitability ratio and is calculated by dividing net income by average total assets. Return on equity (ROE) is defined as the ratio of net income over the book value of equity. Return on capital employed (ROCE) is equal to earnings before interest and tax divided by average capital employed. Return on sales (ROS), is determined by scaling operating (net) profits by total sales recorded over the same period. Sales on fixed assets (SOA) are calculated by dividing sale by the total fixed assets, and sales on capital employed (SOCE) are equal to sales divided by average capital employed. Finally, the impact of different levels of operating and financial leverage on MVA is evaluated. Degree of operating leverage (DOL) calculated by dividing change in operating income by change in sales. A business would benefit if it can estimate the DOL as the impact of the leverage on the percentage of sales can be quite striking if not taken seriously. Degree of financial leverage (DFL) is calculated in a ratio: percent change in net profit before tax divided by percent change in sales. This ratio also helps in determining the suitable leverage for achieving business goals. The higher leverage of the company, the more risk it has, with businesses subsequently needing to treat it as similar to having a debt.
Dependent variableMVA, popularized by Stewart (1991), is used as the dependent variable and represents the value-added created for the shareholder investments supplied during a certain period. In other words, MVA is the difference between a company's market value, as reflected primarily in its share price, and the book value of the equity. Table 1 summarizes variable definitions and descriptions.
Definition of the research variables.
| Variables | Definition | Adapted from |
|---|---|---|
| Dependent variable | ||
| Market value added (MVA) | Market capitalization – book value of equity | Nappi-Choulet, Missonier-Piera, and Cancel (2009); Kumar and Sharma (2011a, 2011b); Lee and Kim (2009); De wet (2005) |
| Independent variables | ||
| Economic value added (EVA) | Earnings before interest and tax−(cost of capitala×capital employed) | Chen and Dodd (1997), Biddle et al. (1998), Kumar and Sharma (2011a, 2011b); De wet (2005) |
| Earnings per share (EPS) | Net income/average common stock | De wet (2005); Kumar and Sharma (2011a, 2011b); Finegan (1991); Milunovich and Tsuei (1996) |
| Dividend per share (DPS) | Dividend/average common stock | De wet (2005) |
| Return on assets (ROA) | Net income/total average assets | Lehn and Makhija (1996); Turvey et al. (2000); De wet (2005) |
| Return on equity (ROE) | Net income/stockholder equity | Lehn and Makhija (1996); Turvey et al. (2000); De wet (2005) |
| Return on capital employed (ROCE) | Profit before interest and tax/average capital employed | Worthington and West (2004); Zafiris and Bayldon (1999) |
| Return on sales (ROS) | Net income/sales | Lehn and Makhija (1996); Turvey et al. (2000) |
| Sale on fixed assets (SOA) | Sales/total average fixed assets | Herrmann, Inoue, and Thomas (2003) |
| Sales on capital employed (SOCE) | Sales/average capital employed | Firth (1979) |
| Degree of operating leverage (DOL) | % change in operating income/% change in sales | Chiou and Su (2007); De wet and Hall (2004) |
| Degree of financial leverage (DFL) | % change in net profit before tax/% change in sales | Chiou and Su (2007); De wet and Hall (2004) |
This paper employs both pooled and panel data techniques to estimate the regression models. To assess the variables’ relative information content, the coefficient of determination (R2) of various performance measures is examined and analyzed. Comparison of the R2 of various performance measures will provide a direct test of Stern et al.’s claim about EVA's performance measure superiority. One interesting finding related to the literature is that most researchers have used R2 and panel data regression model to measure value relevance (Garvey & Milbourn, 2000; Ismail, 2006; Kramer & Pushner, 1997; Sparling & Turvey, 2003). Our methodology is based on the similar work of Kim (2006), and Kumar and Sharma (2011a, 2011b).
Panel data models are powerful research instruments that account for the effects of cross-sectional data. This in turn may help us estimate the appropriate empirical model. We use general models for panel data that enable an empirical estimate of the relationship between independent variables and MVA. We formulate behavioral differences between the various cross-section elements as follows:
where Yit is the MVA of firm i in year t, αi is the intercept coefficient of firm i, β is a row vector of slope coefficients of the regressors, and Xit is a column vector of firm-specific variables for firm i in year t, which represents the explanatory variables reported in Table 1, ¿it is the error term. According to Green (2003), the panel data suggests the use of fixed or random effects that control for unobserved firm and/or year effects. In order to distinguish the preferable set of results statistically, the results of the Lagrange multiplier and Hausman tests are presented. If the Lagrange test gives a significant result, then the panel results are preferred over the pooled results. If the Hausman test gives a significant result, then the fixed effect results are preferred to the random effects. As pointed out by Hsiao (1986), simple least squares estimation of pooled cross-section and time series data may be seriously biased.Results and discussionDescriptive statistics and correlation


Table 2 independent and dependent variable descriptive statistics show that all the research variables have positive mean and median. In addition, the average EVA of these companies is IRR 54,867.79, and their average MVA is IRR 718,968.30, indicating that, overall, these companies are able to earn higher returns than cost of capital. On average, these companies earned 18.11 percent profit by employing their assets and the earned profit in return for equity and capital employed is 63.53 percent and 165 percent respectively, which are considerable values. Moreover, these companies have earned 28.44 percent profit from their sales. According to this table, these companies have had IRR 1682.10 EPS during six years and have distributed IRR 1154.30 of dividends. Furthermore, MVA has a higher mean and median than EVA. Moreover, the sales of these companies have been 7.22 times their capital employed and they have earned 83 percent profit by employing their assets, suggesting the high efficiency of these companies’ managers. Finally, the degree of financial and operating leverage of the companies are 2.39 and 2.58, respectively.
Descriptive statistics.
| Variables | Obs. | Mean | Median | Minimum | Maximum | Std. dev. | Kurtosis | JB statistics |
|---|---|---|---|---|---|---|---|---|
| EVA | 450 | 54,876.79 | 7500.267 | −1,559,183 | 5,341,148. | 392,750.7 | 119.3191 | 164,118.8 |
| EPS | 450 | 1682.137 | 1372.000 | 21.00000 | 9445.000 | 1401.675 | 11.73871 | 1195.329 |
| DPS | 450 | 1154.316 | 958.0000 | 6.000000 | 6088.000 | 896.6407 | 7.435686 | 373.3801 |
| ROA | 450 | 0.181150 | 0.161439 | −0.048808 | 0.537375 | 0.110010 | 2.937176 | 25.36832 |
| ROE | 450 | 0.635359 | 0.577245 | −0.425244 | 2.893375 | 0.437294 | 6.906811 | 289.5248 |
| ROCE | 450 | 1.658579 | 1.355005 | 0.014158 | 9.415000 | 1.378990 | 10.32478 | 880.8615 |
| ROS | 450 | 0.284442 | 0.247728 | 0.001213 | 2.163353 | 0.195520 | 32.64937 | 11,122.11 |
| SOA | 450 | 0.830590 | 0.770902 | 0.021677 | 2.904223 | 0.363070 | 7.010449 | 279.9068 |
| SOCE | 450 | 7.220198 | 5.104050 | 0.115319 | 170.6526 | 11.24836 | 158.4964 | 293050.0 |
| DOL | 450 | 2.398147 | 0.872043 | −179.8356 | 497.4044 | 31.77217 | 212.0458 | 526592.6 |
| DFL | 450 | 2.537872 | 0.910335 | −26.19032 | 204.8651 | 15.12364 | 119.2053 | 164747.3 |
| MVA | 450 | 718968.3 | 152079.5 | −147,889.0 | 11,484,434 | 1,593,588. | 22.63292 | 5392.971 |
Note: EVA (economic value added), EPS (earnings per share), DPS (dividend per share), ROA (return on assets), ROE (return on equity), ROCE (return on capital employed), ROS (return on sale), SOA (sales on fixed assets), SOCE (sales on capital employed), DOL (degree of operating leverage), DFL (degree of financial leverage), MVA (market value added).
Moreover, a test of normality used in this research is Jarque–Bera, which examines whether data skewness and kurtosis match a normal distribution. The results of this test at the 0.05 significance level show that all the data is normally distributed (Table 2). The results of correlation analysis presented in Table 3 indicate that there is no multicollinearity between independent variables.
Correlation matrix.
| Variable | EVA | ROA | ROE | ROCE | ROS | EPS | DPS | SOCE | SOA | DOL | DFL | MVA |
|---|---|---|---|---|---|---|---|---|---|---|---|---|
| EVA | 1.0000 | |||||||||||
| ROA | 0.0074 | 1.0000 | ||||||||||
| ROE | −0.0205 | 0.6777** | 1.0000 | |||||||||
| ROCE | −0.0002 | 0.4321** | 0.5744** | 1.0000 | ||||||||
| ROS | −0.0240 | 0.6653** | 0.4922** | 0.2485** | 1.0000 | |||||||
| EPS | −0.0293 | 0.4231** | 0.5255** | 0.1913 | 0.2335** | 1.0000 | ||||||
| DPS | −0.0427 | 0.5128** | 0.5897** | 0.6581** | 0.2914** | 0.7540** | 1.0000 | |||||
| SOCE | −0.0026 | −0.1073 | 0.0708* | 0.5706** | −0.1803** | 0.5402** | 0.4086** | 1.0000 | ||||
| SOA | −0.0101 | 0.0715 | 0.0181 | 0.1567 | −0.0839** | 0.1109 | 0.0958 | 0.2904** | 1.0000 | |||
| DOL | −0.0055 | 0.0698 | 0.0388 | 0.0369 | 0.0339* | 0.0487 | 0.0110 | −0.0123 | −0.0687 | 1.0000 | ||
| DFL | 0.0038 | 0.0149 | −0.0103 | −0.0123 | 0.0014 | −0.0146 | −0.0246 | −0.0240 | −0.0757 | 0.6197** | 1.0000 | |
| MVA | 0.0591* | 0.4414** | 0.3228** | 0.0587** | 0.4422** | 0.0952** | 0.1979** | −0.1029 | −0.2067** | −0.0085 | −0.0171 | 1.0000 |
Note: EVA (economic value added), ROA (return on assets), ROE (return on equity), ROCE (return on capital employed), ROS (return on sale), EPS (earnings per share), DPS (dividend per share), SOA (sales on fixed assets), SOCE (sales on capital employed), DOL (degree of operating leverage), DFL (degree of financial leverage), MVA (market value added).
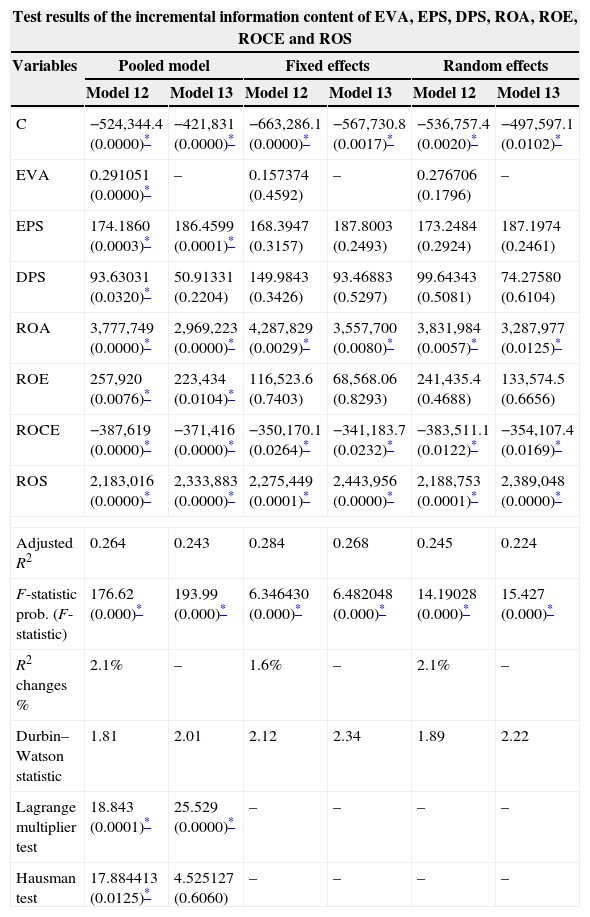
Table 4 shows the results for every independent variable's relative information content tests. The assessment is made by conducting four separate regressions for each performance measure (EVA, EPS, DPS, ROA, ROE, ROCE and ROS). This estimation is done by regressions based on Eqs. (1)–(7). Then, regression Models 8, 9, 10, and 11 are used to test the second and third hypotheses. Finally, regression Models 12 and 13 are used to examine the information content of EVA and other measures (Hypothesis 4). The first hypothesis demands examining whether EVA and the traditional performance measures are related to MVA prior to testing. To examine these relationships, seven sub-hypotheses are developed and tested. According to Tables 4 and 5, the Lagrange Multiplier test is statistically significant, suggesting the suitability of panel models over the pooled model. However, the Hausman tests suggest that the fixed effects method is an adequate parameterization of Models 1 and 12, whereas the random effects method is required for Models 2–9 and 13.
Test results of the relative information content of EVA, EPS, DPS, ROA, ROE, ROCE and ROS.
| This table reports results from pooled and panel data model. The dependent variable is Market Value Added(MVA) | |||||||||||
|---|---|---|---|---|---|---|---|---|---|---|---|
| Models | Pooled model | Fixed effects model | Random effects model | Lagrange multiplier test | Hausman test | ||||||
| Constant | Beta (p value) | Adj. R2 | Constant | Beta (p value) | Adj. R2 | Constant | Beta (p value) | Adj. R2 | |||
| Model 1 (EVA) | 70,580 (0.000)* | 0.23982 (0.005)* | 0.003 | 71,634 (0.000)* | 0.0478 (0.843) | 0.06 | 71,700 (0.000)* | 0.1614 (0.4954) | 0.003 | 45.797 (0.0000)* | 5.851763 (0.0156)* |
| Model 2 (EPS) | 51,388 (0.000)* | 115.69 (0.000)* | 0.011 | 55,037 (0.000)* | 94.610 (0.143) | 0.063 | 53,385 (0.002)* | 104. 15 (0.098) | 0.005 | 44.591 (0.0000)* | 0.407975 (0.5230) |
| Model 3 (DPS) | 32,566 (0.000)* | 323.24 (0.000)* | 0.039 | 35,741 (0.014)* | 296.825 (0.002)* | 0.086 | 342,146 (0.048)* | 309.53 (0.001)* | 0.031 | 42.733 (0.0000)* | 0.214531 (0.6432) |
| Model 4 (ROA) | −31,807 (0.000)* | 54,533 (0.000)* | 0.172 | −46,493 (0.007)* | 62,292 (0.000)* | 0.343 | −35,180 (0.053) | 563,150 (0.000)* | 0.165 | 29.969 (0.0000)* | 0.476848 (0.4899) |
| Model 5 (ROE) | 49,374 (0.237) | 10,031 (0.000)* | 0.093 | 10,205 (0.516 | 92,360 (0.000)* | 0.122 | 68,755 (0.678) | 97,385 (0.000)* | 0.083 | 34.117 (0.0000)* | 0.416298 (0.5188) |
| Model 6 (ROCE) | 58,171 (0.000)* | 77,357 (0.000)* | 0.004 | 61,954 (0.000)* | 55,247 (0.397) | 0.059 | 60,265 (0.000)* | 65,118 (0.306) | 0.001 | 45.203 (0.0000)* | 0.451539 (0.5016) |
| Model 7 (ROS) | −30,749 (0.000)* | 35,188 (0.000)* | 0. 192 | −30,749 (0.035)* | 35,188 (0.000)* | 0. 191 | −31,964 (0.063) | 35,607 (0.000)* | 0. 184 | 33.769 (0.0000)* | 0.093212 (0.7601) |
| Model 8 (SOA) | 14,540 (0.000)* | −88,424 (0.000)* | 0.041 | 13,643 (0.000)* | −77,713 (0.005)* | 0.081 | 14,129 (0.000)* | −83,518 (0.001)* | 0.030 | 42.155 (0.0000)* | 0.322367 (0.5702) |
| Model 9 (SOCE) | 81,490 (0.000)* | −14,049 (0.000)* | 0.009 | 79,036 (0.000)* | −10,629 (0.194) | 0.062 | 801,862 (0.000)* | −12,232 (0.130) | 0.004 | 42.680 (0.0000)* | 1.468847 (0.2268) |
| Model 10 (DOL) | 71,513 (0.000)* | −444.6 (0.596) | −0.0002 | 71,533 (0.000)* | −529.64 (0.8554) | 0.05 | 715,257 (0.000)* | −495.60 (0.8633) | −0.003 | 44.749 (0.0000)* | 0.006687 (0.9348) |
| Model 11 (DFL) | 71,841 (0.000)* | −1754 (0.319) | −0.0002 | 71,735 (0.000)* | −1326.4 (0.8280) | 0.05 | 71,778 (0.000)* | −1501.5 (0.8037) | −0.003 | 44.637 (0.0000)* | 0.038385 (0.8447) |
Notes: EVA (economic value added), EPS (earnings per share), DPS (dividend per share), ROA (return on assets), ROE (return on equity), ROCE (return on capital employed), ROS (return on sale), SOA (sales on fixed assets), SOCE (sales on capital employed), DOL (degree of operating leverage), DFL (degree of financial leverage). Pooled and panel data regression analysis model are performed based on Eq. (1): MVAi,t=β0+β1 (EVAi,t)+єi,t; (2): MVAi,t=β0+β1 (EPSi,t)+єi,t; (3): MVAi,t=β0+β1 (DPSi,t)+єi,t; (4): MVAi,t=β0+β1 (ROAi,t)+єi,t;(5): MVAi,t=β0+β1 (ROEi,t)+єi,t; (6): MVAi,t=β0+β1 (ROCEi,t)+єi,t; (7): MVAi,t=β0+β1 (ROSi,t)+єi,t; (8): MVAi,t=β0+β1 (SOAi,t)+єi,t; (9): MVAi,t=β0+β1 (SOCEi,t)+єi,t; (10): MVAi,t=β0+β1 (DOLi,t)+єi,t; (11): MVAi,t=β0+β1 (DFLi,t)+єi,t.
Regression significant at 5 percent level of significance. Durbin–Watson statistics (D–W) of the residuals report 1.92–2.22, respectively, for regression equations (1)–(11). We present p-values for significance in parentheses.
Regression analysis.
| Test results of the incremental information content of EVA, EPS, DPS, ROA, ROE, ROCE and ROS | ||||||
|---|---|---|---|---|---|---|
| Variables | Pooled model | Fixed effects | Random effects | |||
| Model 12 | Model 13 | Model 12 | Model 13 | Model 12 | Model 13 | |
| C | −524,344.4 (0.0000)* | −421,831 (0.0000)* | −663,286.1 (0.0000)* | −567,730.8 (0.0017)* | −536,757.4 (0.0020)* | −497,597.1 (0.0102)* |
| EVA | 0.291051 (0.0000)* | – | 0.157374 (0.4592) | – | 0.276706 (0.1796) | – |
| EPS | 174.1860 (0.0003)* | 186.4599 (0.0001)* | 168.3947 (0.3157) | 187.8003 (0.2493) | 173.2484 (0.2924) | 187.1974 (0.2461) |
| DPS | 93.63031 (0.0320)* | 50.91331 (0.2204) | 149.9843 (0.3426) | 93.46883 (0.5297) | 99.64343 (0.5081) | 74.27580 (0.6104) |
| ROA | 3,777,749 (0.0000)* | 2,969,223 (0.0000)* | 4,287,829 (0.0029)* | 3,557,700 (0.0080)* | 3,831,984 (0.0057)* | 3,287,977 (0.0125)* |
| ROE | 257,920 (0.0076)* | 223,434 (0.0104)* | 116,523.6 (0.7403) | 68,568.06 (0.8293) | 241,435.4 (0.4688) | 133,574.5 (0.6656) |
| ROCE | −387,619 (0.0000)* | −371,416 (0.0000)* | −350,170.1 (0.0264)* | −341,183.7 (0.0232)* | −383,511.1 (0.0122)* | −354,107.4 (0.0169)* |
| ROS | 2,183,016 (0.0000)* | 2,333,883 (0.0000)* | 2,275,449 (0.0001)* | 2,443,956 (0.0000)* | 2,188,753 (0.0001)* | 2,389,048 (0.0000)* |
| Adjusted R2 | 0.264 | 0.243 | 0.284 | 0.268 | 0.245 | 0.224 |
| F-statistic prob. (F-statistic) | 176.62 (0.000)* | 193.99 (0.000)* | 6.346430 (0.000)* | 6.482048 (0.000)* | 14.19028 (0.000)* | 15.427 (0.000)* |
| R2 changes % | 2.1% | – | 1.6% | – | 2.1% | – |
| Durbin–Watson statistic | 1.81 | 2.01 | 2.12 | 2.34 | 1.89 | 2.22 |
| Lagrange multiplier test | 18.843 (0.0001)* | 25.529 (0.0000)* | – | – | – | – |
| Hausman test | 17.884413 (0.0125)* | 4.525127 (0.6060) | – | – | – | – |
Notes: EVA (economic value added), EPS (earnings per share), DPS (dividend per share), ROA (return on assets), ROE (return on equity), ROCE (return on capital employed), ROS (return on sale), SOA (sales on fixed assets), SOCE (sales on capital employed), DOL (degree of operating leverage), DFL (degree of financial leverage). Pooled and panel data regression analysis model are performed based on Eq. (12): MVAit=β0+β1 (EVAit)+β2 (EPSit)+β3 (DPSit)+β4 (ROAit)+β5 (ROEit)+β6 (ROCEit)+β7 (ROSit)+¿it; (13): MVAit=β0+β1 (EPSit)+β2 (DPSit)+β3 (ROAit)+β4 (ROEit)+β5 (ROCEit)+β6 (ROSit)+¿it.
Hypothesis H1a states that EVA is positively associated with MVA. Table 4 presents the regression results for the dependent variables MVA. Table 4 and Model 1 (β=0.0478, p>0.05) show that there is a positive, yet not significant relationship between EVA and MVA. Consequently, Hypothesis H1a is not confirmed. This result is consistent with the findings of Biddle et al. (1997), De Villiers and Auret (1997), Kramer and Pushner (1997), Chen and Dodd (1997, 2001), Turvey et al. (2000), Worthington and West (2001), Sparling and Turvey (2003), De wet (2005), Ismail (2006), and Kyriazis and Anastassis (2007). Moreover, our results about the relationship between EVA and MVA are inconsistent with many previous studies, such as Stewart (1991), Stern et al. (1994), Kumar and Sharma (2011a, 2011b), Milunovich and Tsuei (1996), and Uyemura et al. (1996). Hypothesis 1b predicts a positive link between EPS and MVA. The data provided in Table 4 and Model 2 show that the EPS beta coefficient is (β=104.15) and (p>0.05); thus, there is no relationship between EPS and MVA. Therefore, Hypothesis H1b is not supported. This is inconsistent with the findings of Uyemura et al. (1996), Finegan (1991), and Milunovich and Tsuei (1996). However, our results are consistent with the findings of Kumar and Sharma (2011a, 2011b).
In contrast to De wet (2005), DPS is found to have a positive (β=309.53) impact on Iranian firms’ MVA. As can be seen in Table 4, the calculated p-value is 0.001, which is less than the confidence level (0.05). In other words, it can be concluded that DPS is positively associated with MVA. Therefore, Hypothesis H1c is accepted. Consequently, Table 4 and the coefficients obtained for Model 4 (β=563,150, p<0.05) show that ROA is positively associated with MVA. Hence, Hypothesis H1d is also accepted. The results of regression analysis for ROE in Table 4 and Model 5 show that its relationship with MVA is positive (β=97,385, p<0.05). This is consistent with our expectations and Hypothesis H1e is supported.
ROCE has a positive relationship with MVA, but this relationship is not statistically significant (Model 6: β=65,118, p>0.05); therefore, Hypothesis H1f is rejected. The results show that ROS produces a positive effect on MVA (Model 7: β=35,607, p<0.05); therefore, Hypothesis H1g is supported. This finding is consistent to Uyemura et al. (1996), Lehn and Makhija (1997), De wet (2005) and Kumar and Sharma (2011a, 2011b). Moreover, Table 4 shows the results of the independent variable relative information content tests. The assessment is made by analyzing seven separate regressions for each performance measure, that is, EVA, DPS, EPS, ROA, ROE, ROCE, and ROS. This estimation is done by pooled and panel data regressions based on Eqs. (1)–(7). Table 4 provides the coefficients and adjusted R2 values for each variable. First, we find that some of the regressions are significant. Similarly, the coefficient results suggest that, in terms of relative information content, some performance measures are statistically significant at the 0.05 level.
The R2 values of the variables presented in Table 4 (3.1 percent for DPS; 16.5 percent for ROA; 8.3 percent for ROE; 18.4 percent for ROS) reject the first hypothesis, that is, EVA is not superior to the traditional performance measures. Considering these values, we can argue that ROS is superior to other measures in explaining the market value of Iranian firms. After this measure, ROA has the highest R2 coefficient, and ROE, and DPS come next. Of greater concern is the finding that there is absolutely no relationship between EVA and MVA. This is surprising, and it can be argued that the measures based on accounting profit are superior in explaining these firms’ market value. Therefore, the hypothesis that the relative information content of EVA is superior to traditional measures (H1) is rejected, and we can conclude that ROS and ROA are better predictors of Iranian firms’ market value change. Our results about the variables’ relative information content are consistent with many international studies (e.g., Biddle et al., 1998; Chen & Dodd, 1997; De wet, 2005; Kumar & Sharma, 2011a; Kumar & Sharma, 2011b; Ray, 2001; Worthington & West, 2001).
The third hypothesis states that there is a significant positive relationship between efficiency and firms’ market value. Models 8 and 9 were examined to assess the relationship between these variables, with Table 4 providing the results. First, we found that the coefficient on SOA is negative and significant (p<0.05). It can thus be concluded that there is a significant negative relationship between sales on fixed assets and MVA. Second, we discovered that SOCE was negatively associated with MVA (β=−12,232, p>0.05). Since this relation was not significant, neither Hypothesis H2a nor Hypothesis H2b was supported. SOA represents the efficiency of the management in increasing sales using fixed assets, and SOCE represents the efficiency of the management in increasing sales using capital employed. The negative correlations found between SOA and MVA are quite enigmatic and unexpected.
Hypothesis H3a predicted a negative link between degree of operating leverage and MVA. The relationship was negative and insignificant (β=−495.60, p>0.05). Based on Panel 4 and Model 11 (β=−1501.5, p>0.05), there is a negative relationship between degree financial leverage and MVA; however, the lack of a statistically significant relationship means there is no significant relationship between leverage and MVA in TSE-listed firms and degree of operating and financial leverage cannot explain the dependent variable. Therefore, the models show that we cannot accept Hypotheses H3a and H3b.
Hypothesis H4 states that EVA and the traditional accounting performance measures have information content. In order to determine the incremental information content of EVA, we used two regression models (Eqs. (12) and (13)), with all the variables and another regression model excluding EVA. The overall model suggests that both are significant with F-values (6.34 and 14.19) that are statistically significant at the 0.05 level.
The results of Table 5 and the obtained coefficients reveal that only ROA, ROCE, and ROS are statistically significant and can be included in the model. It can be argued that in both models ROA, ROCE and ROS are significantly associated with the dependent variable. ROCE has negative association, whereas ROA and ROS are positively related with MVA.
Moreover, the R2 of Model 12 is 28.4 percent, indicating that 26.8 percent of changes in Iranian firms’ market value can be explained by these variables. R2 of Model 13 is 24.5 percent, and since EVA has been incorporated in Model 12, but not Model 13, it can be concluded that Model 12 has higher explanatory power. Since adjusted R2 has increased by 2.1 percent, it can be concluded that EVA, along with other performance measures, can explain Iranian firms’ market value. However, EVA's explanatory power is very scant and the relationship is not statistically significant. Therefore, the results show that we cannot accept Hypothesis H4. Considering the obtained beta coefficient, it can be argued that ROA and ROS are most effective determinants of Iranian firms’ market value. Moreover, the regression results (Table 5) reveal that only 24.5 percent (adjusted R2) of changes in the MVA is explained by the regression model, leaving the majority unexplained. This means that, apart from these variables, one should consider other variables such as operating cash flow and residual income to capture the exact variation in the sample firms’ MVA.
According to Tables 4 and 5, we also tested the first order serial correlation and multicollinearity in our data. Serial correlation was analyzed by examining the Durbin–Watson (D-W) statistics. The D-W statistics of the residuals report 1.81–2.34, respectively for regression equations (1)–(13) and range in value from 0 to 3 with an ideal value of 2, indicating that errors are not correlated (Field, 2000). Moreover, in all models, the level of F-statistic is significant, suggesting the regression estimation validity. To detect the presence of multicollinearity, variance inflation factor (VIF) was also analyzed. A general rule is that the VIF should not exceed 10 (Belsley, Kuh, & Welsch, 1980). VIF values of all independent variables were in range with the highest value of 7.492, indicating a low degree of multicollinearity among the variables. Moreover, to determine the absence of multicollinearity problems, the Pearson's correlation coefficients between explanatory variables were tested. Studies have suggested that multicollinearity should be considered a serious problem only if the correlation coefficient between explanatory variables is more than 0.8 (Kennedy, 1985) or more than 0.9 (Tabachnick & Fidell, 1996). As shown in Table 3, the correlation coefficients between explanatory variables are not high. As a result, we can ignore any multicollinearity problems.
ConclusionAt the beginning of this paper, we examined the information content of EVA and six traditional accounting performance measures—that is, EPS, DPS, ROA, ROE, ROCE, and ROS—in explaining the market value of TSE-listed firms. Then, the relationship between efficiency, degree of operating and financial leverage, and market value of these firms was examined. Using a data set of 75 Iranian manufacturing companies for the period 2003–2008, we tested the relative and incremental information content of EVA and conventional performance measures. Regarding incremental information content, EVA is not superior to other performance evaluation measures; moreover, the results show that ROS and ROA have a greater explanatory power than EVA. Further, the results show that one of the efficiency measurement variables is negatively associated with MVA. The results also indicate that TSE-listed firms show no significant relationship between leverage and MVA. The empirical results of the study do not support the claim that EVA is a better performance indicator than traditional accounting measures in explaining market value. We find evidence supporting the earlier work of Biddle et al. (1997), Chen and Dodd (2001), Kim (2006), and Ismail (2006), suggesting that traditional accounting-based measures are more associated with MVA than EVA. Our results, in sum, do not support the claim of Stern et al. that EVA is superior to other measures in explaining MVA. The present findings can have the following implications:
- 1.
Due to the weak correlation between EVA and MVA, investors cannot consider EVA along with the traditional accounting-based measures in their investment decisions. EVA alone cannot predict and explain the market value of the firms listed in the Tehran Stock Exchange and investors should pay little attention to this measure in their decision making.
- 2.
Generally, the results of the present research identified and introduced the measures that can help managers improve companies’ internal performance and increase shareholder wealth.
The results of the research must be interpreted with respect to the following limitations:
- 1.
The independent variables that may affect the dependent variable MVA and were not examined in the present research (that is, product quality, community satisfaction and inflation);
- 2.
The possible effects of sampling limitations, such as exclusion of some samples due to lack of required data;
- 3.
Time limitation, which involved the financial information between 2003 and 2008.
It is recommended that other research be carried out that accounts for size, inflation, and industry classification. Researchers who study the information content of profit, residual income, and operating cash flows should compare these variables’ correlation with MVA to identify which of these measures is more powerful. In addition, the data can be tested using alternative dependent variables (such as stock returns) with the same or a larger data set of a similar or greater time span. Many international studies have used stock returns instead of MVA to examine various performance measures’ value relevance (e.g., Ismail, 2006; Kim, 2006; Maditinos et al., 2009; Worthington & West, 2001).
