


La deficiente minería de cinabrio dejó a San Joaquín altas concentraciones de mercurio en terreros de mina (2.4 – 4164 mg kg1). Numerosas minas contribuyeron a la dispersión de mercurio en suelos agrícolas (0.5 – 314 mg kg-1) y suelos forestales (0.2 – 69.0 mg kg-1). Los sedimentos son un medio de transporte natural del mercurio, que ocasionan su dispersión, especialmente en áreas cercanas a las bocaminas (0.6 – 687 mg kg1). La cercanía de los cultivos de maíz a las minas favorece la acumulación de mercurio en sus distintas estructuras como la raíz, el tallo, la hoja y el grano (0.04 – 8.2 mg kg-1), que se relacionan con la acumulación y volatilización de mercurio en suelos. El vapor de mercurio presente en la población puede indicar una volatilización constante de los terreros y suelos (22 – 153 ng m-3). Los niveles de mercurio encontrados en suelos, en los granos de maíz y en el aire resultaron superiores a los estándares reportados por la Norma Oficial Mexicana y la Organización Mundial de la Salud. El mercurio en el agua de lluvia se debe principalmente a las partículas atmosféricas suspendidas y depositadas más tarde en la superficie (1.5 – 339 μg |-1). En el agua potable se encontró disolución de mercurio (10 – 170 ng |-1), siendo las concentraciones menores a las establecidas por la NOM Y OMS. La contaminación existente en la región de San Joaquín no llega a los niveles de los máximos productores de Hg en el mundo: Almadén (España) e Idrija (Eslovenia); sin embargo, se asemeja a la hallada en otros importantes distritos de segundo nivel mundial como Guizhou (China). La población de San Joaquín y su ambiente presentan una exposición constante a la contaminación del mercurio, por lo que es necesario un monitoreo a largo plazo para determinar sus alcances, en especial para el hombre.
Deficient management of cinnabar mining left the San Joaquín region with high concentrations of mercury in its soils (2.4 – 4164 mg kg-1). Numerous cinnabar mines have contributed to the dispersion of mercury into agricultural (0.5 –314 mg kg-1) and forest (0.2 – 69 mg kg-1) soils. Sediments are a natural means of transportation for mercury, causing its spreading, especially in areas near mine entrances (0.6 – 687 mg kg-1). The nearness of maize crops to mines favors mercury accumulation in the different plant structures, such as roots, stems, leaves, and grain (0.04 – 8.2 mg kg-1); these being related to mercury volatilization and accumulation in soils. Mercury vapor present in the settlements could indicate a constant volatilization from lands and soils (22 – 153 ng m-3). The mercury levels found in the soils, in maize grain, and in the air resulted greater than the standards reported by the Official Mexican Norm (NOM) and the World Health Organization (WHO). Mercury in rainwater is due mainly to the presence of suspended atmospheric particles, later deposited on the surface (1.5 – 339 μg |-1). Mercury dissolution was found in the drinking water (10 – 170 ng |-1), with concentrations below those established by the NOM and the WHO. The contamination existing in the San Joaquín region does not reach the levels of the world’s greatest mercury producers: Almaden (Spain) and Idrija (Slovenia). It is, however, like that found in other important second degree world producers such as Guizhou (China). The population of San Joaquín, as well as its surrounding environment, are constantly exposed to mercury contamination, thus making a long term monitoring necessary to determine its effects, especially to people.
Mercury is an element that is toxic for humans and which could be the cause of chronic diseases in the population of San Joaquín, Querétaro, Mexico. Exposure to mercury, even at low levels, is related to acute and chronic intoxication, resulting in a series of diseases that include neurological, heart attacks, central nervous system damage, kidney injuries, and autism (Li et al., 2008; Bose-O’Reilly et al., 2010). It also affects the biota and, therefore, affects the trophic chain (UNEP, 2002). In the study region, there exist very high mercury levels, beyond any standard in both humans and the environment; e.g. in bones of pre-Hispanic population (17.6 ppm), in agricultural soils (314.6 ppm), in mining tailings (4164.4 ppm), in drinking water (2 ppt), and in the air (414.8 ng m-3) (Hernández-Silva et al., 2009).
In the environment, mercury is found naturally as cinnabar (HgS), but human activities such as mining, increases its presence within the atmospheric, terrestrial, biotical and aquatic systems (Mason, 2002; Selin, 2009). The effect of cinnabar mining represents an environment concern, since abandoned and enriched open air mining tailings are considered permanent sources of atmospheric mercury emissions. The mine drainage could contain high levels of mercury that affect the water and biota quality; therefore, cinnabar tailings increase the mercury content of the soils and sediments of the hydrographic watershed (Rytuba, 2000; Kocman and Horvat, 2011).
The mining activity has been developed since the pre-Hispanic period, because their inhabitants used cinnabar as colorant and in their religious ceremonies. Additionally, this region was a very important mercury production zone in the 60’s and 70’s of the last century. Mexico occupied the 4th place in production worldwide (Langenscheidt, 2006); presently, mercury mining is forbidden.
Through diverse processes such as rock weathering, erosion, lixiviation, oxidation and transportation, mercury may become established in the environment or be transported across great distances, becoming a legacy associated to soil, sediments and plants. Even after many years of mining inactivity, high amounts of mercury can be found in the environment (Parsons and Percival, 2005; García-Sánchez et al., 2009). On the other hand, man can be the receptor of mercury through inhalation of air particles, direct contact, or ingestion through the accumulation of this element in the trophyc chain. These mechanisms have operated in past and present times (Wasserman et al., 2003; Pyatt et al., 2005).
The objective of this work was to establish the impact caused by cinnabar mining in terrestrial systems (air-soil-plant-water) at the mining district of San Joaquín, and compare these values with concentrations reported in other highly contaminated places.
Materials and MethodsStudy areaThe mining region lies in the south of the Sierra Gorda of Querétaro, Mexico. It comprises 172 km2 and is located between 99°40′ and 99°30′ W longitude, and 21°10′ and 20°50′ N latitude. The delimitation of the study area was done by criterion of the hydrological watershed (Figure 1); the characteristics of geology, relief and edaphology; climate and vegetation were also considered. Here is a reference framework for the selection of sampling sites (Figure 2 y Figure 3).
 to its river mouth with the Extóraz river (B).")


Each sampling site of soils and tailings represents a sample made up of 5 subsamples taken at distances of 50 m each, and a depth of 0-25 cm. Sediment samples were collected from 100 m sections along some streams, rivers, and small alluvial terraces. Tailings were sampled from skarn and hydrothermal type mines. Soil sampling was done in function of the two predominant soil uses in the region: the forest area and agriculture. A total of 13 samples were taken from agricultural soils, 26 from forest soils, 27 from tailings, and 27 from sediments. All the samples were air dried at room temperature and sifted in a No. 10 sieve (2mm). Part of the sample was ground down with an agate mortar to obtain a fine and homogeneous sample. From each sample, 0.1 g was weighed, in triplicate, and placed in a direct measure advanced mercury analyzer AMA-254, which uses an incineration technique generating mercury vapor. It is an atomic absorption spectrometer to determine mercury in solid or liquid samples without any previous treatment. Calibration of the equipment was done with standards from the MOSTAR Hungarian stream sediment standard, Slovakian reference material (ISE 982), and WEPAL monitor simple (ISE 921).
Hg in maize plantsLike in the rest of the country, the San Joaquín population consumes maize as its staple food, grown in their own seasonal rainfed plots, some of them located close to the mines. Sampling was done in the harvest time, in three different periods, October 2006 and November 2007 and 2010. Maize plants were collected from agricultural lands, and separated by structures into root, stalk, leaf, and grain; obtaining 15 samples from roots, 17 from stems, 11 from leaves, and 18 from grains. Each structure was washed with HNO3 diluted to 10%, rinsed with deionized water, and dried at room temperature (22°-25°C). The plant material was ground and sifted until achieving particle size under 0.13 mm. Then, 0.1 g was weighed and 5 ml concentrated HNO3 was added for digestion through a MARSPRESS microwave oven. Some drops of concentrated HCI were added to the digestion and taken to volume to 200 ml with 18.2 μS/ cm deionized water. They were kept at 4°C until measurement. Total mercury quantification was done through induction coupled plasma mass spectrometry (ICP-MS) equipment Thermos Series X2.
Hg in rainwaterAt the micro-watershed of Agua de Venado, Agua de Leon and Pondejhe of the study zone, rainwater collectors were installed for total mercury quantification. Information was also collected from a meteorological station in order to determine the predominance of the wind directions. Sample collection of rainwater was compound; each sample included water from all the events in a month. Twenty-four samples were collected from December 2009 to June 2010. The rainwater samples were filtered through a polycarbonate membrane with 0.4 μm pores, using a magnetic filtration system (Gelman 47-mm). The filtrate was acidified to pH = 1.8 with HNO3 0.016N, and 60 ml from the sample was transferred to high density polyethylene bottles; thus, the soluble fraction was obtained. The insoluble fraction is the part that remained on the filters used for the filtration process of the soluble fraction. These filters were subjected to acid digestion using 15 ml HNO3 3M with a digestion time of 45 minutes in a MARSPRESS microwave oven. The digested samples were filtered and taken to volume to 25 ml with deionized water, obtaining a final HNO3 acidity of 0.45N. Both fractions (soluble and insoluble) were refrigerated and kept at 4°C until quantification. Total mercury concentration was determined through inductively coupled plasma optical emission spectrometry (ICP-OES) equipment 710-ES Axial.
Hg in drinking waterDrinking water was sampled from nine settlements in the San Joaquín municipality during March and November, 2007, obtaining a total of 18 samples. The samples were collected in decontaminated nalgene bottles. Preservation of the samples was done with INSTRA nitric acid and they were refrigerated at 4°C until measurement. Total mercury quantification was done through induction coupled plasma mass spectrometry (ICP-MS) equipment Thermo Series X2.
Hg in airThe atmospheric mercury concentrations (elemental mercury in vapor phase) were measured in two sampling sites; the first one was established within the San Joaquín community taking samples continuously for 17 days (March 2011); while the second was located at the Agua de Venado area with 21 days straight measuring (April-May 2011). A TEKRAN 2537A model equipment, facilitated by CENICA INE, was used to determine ultra-trace mercury vapor.
Statistical analysisDescriptive statistical analyses for total mercury content in the data base coming from mining tailings, soils, sediments, maize plants, rainwater, and air samples were taken into consideration. This analysis allows to determine the extent of contamination by mercury within each environmental component, as well as the detection of its maximum and minimum thresholds. For a better understanding of mercury distribution in each component, box and whiskers diagrams were used through STATISTICA Version 10 software.
Results and discussionMercury presents constant flow interactions within the different environmental compartments (atmospheric, terrestrial, aquatic, biotic), causing its mobilization, aspect that has influence on the quality of the environment and health of humans, while, the toxic grade is directly related to the mercury chemical phase that is found in each compartment.
Total mercury contents in the different compartments of the San Joaquín region are shown in Figure 4. This image shows the insertion dynamics of mercury in the different components. Mercury concentrations in each component change substantially, and it can be seen that the greatest contamination source of mercury is found in the open air mining tailings, adding a deficient processing of cinnabar. These tailings are exposed to climatic conditions as well as air and water erosion, which transport mercury particles both to the atmospheric and terrestrial landscape. This has repercussions on the concentration levels of mercury present in air, rainwater, forest and agricultural soils, as well as and in sediments.

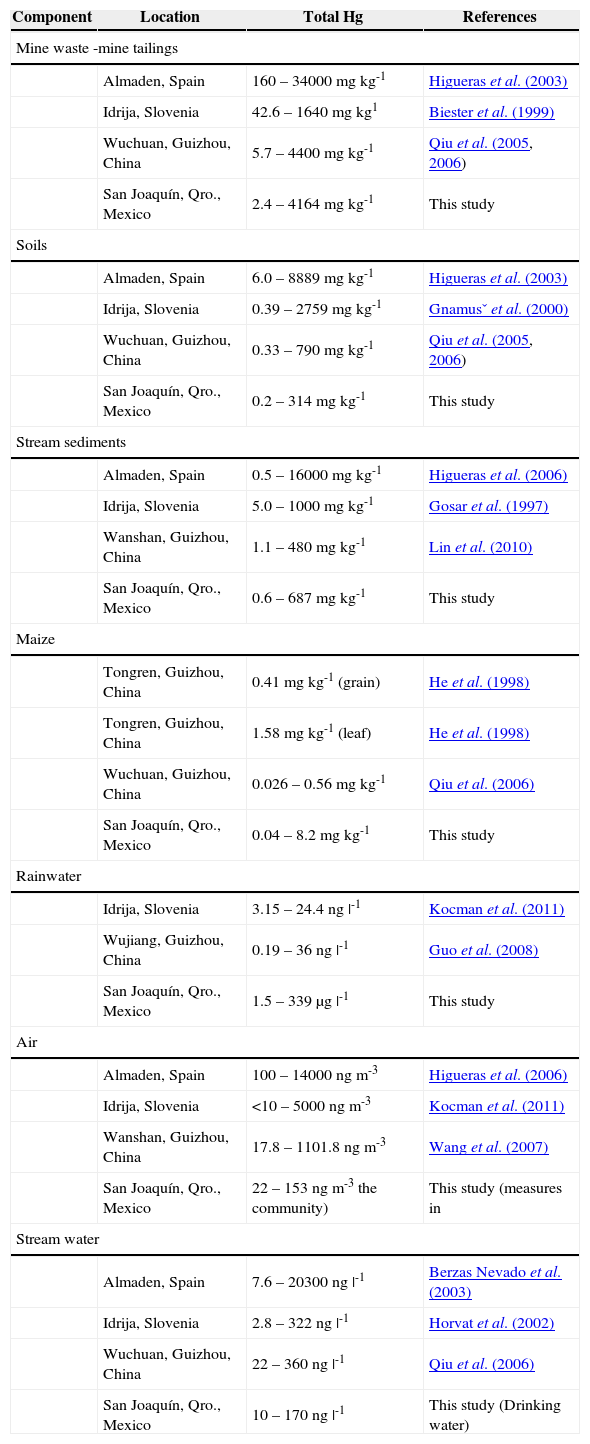
The presence of crops, especially maize, near the entrance of the mines is very common. Thus the plants are exposed to mercury, accumulating it in the different structures (roots, stems, leaves, and grains). Mercury in drinking water has a direct link to human beings, and constant consumption could have some repercussion in the long term (WHO-IPCS, 2004; Cabrera-Vique et al., 2007). In this paper, the causes of mercury distribution are examined and the obtained concentrations are compared with other references, considered as sites with high mercury contamination (Table 1).
Total mercury content in the components of different mining zones of the world well known for their mercury production.
| Component | Location | Total Hg | References |
|---|---|---|---|
| Mine waste -mine tailings | |||
| Almaden, Spain | 160 – 34000 mg kg-1 | Higueras et al. (2003) | |
| Idrija, Slovenia | 42.6 – 1640 mg kg1 | Biester et al. (1999) | |
| Wuchuan, Guizhou, China | 5.7 – 4400 mg kg-1 | Qiu et al. (2005, 2006) | |
| San Joaquín, Qro., Mexico | 2.4 – 4164 mg kg-1 | This study | |
| Soils | |||
| Almaden, Spain | 6.0 – 8889 mg kg-1 | Higueras et al. (2003) | |
| Idrija, Slovenia | 0.39 – 2759 mg kg-1 | Gnamusˇ et al. (2000) | |
| Wuchuan, Guizhou, China | 0.33 – 790 mg kg-1 | Qiu et al. (2005, 2006) | |
| San Joaquín, Qro., Mexico | 0.2 – 314 mg kg-1 | This study | |
| Stream sediments | |||
| Almaden, Spain | 0.5 – 16000 mg kg-1 | Higueras et al. (2006) | |
| Idrija, Slovenia | 5.0 – 1000 mg kg-1 | Gosar et al. (1997) | |
| Wanshan, Guizhou, China | 1.1 – 480 mg kg-1 | Lin et al. (2010) | |
| San Joaquín, Qro., Mexico | 0.6 – 687 mg kg-1 | This study | |
| Maize | |||
| Tongren, Guizhou, China | 0.41 mg kg-1 (grain) | He et al. (1998) | |
| Tongren, Guizhou, China | 1.58 mg kg-1 (leaf) | He et al. (1998) | |
| Wuchuan, Guizhou, China | 0.026 – 0.56 mg kg-1 | Qiu et al. (2006) | |
| San Joaquín, Qro., Mexico | 0.04 – 8.2 mg kg-1 | This study | |
| Rainwater | |||
| Idrija, Slovenia | 3.15 – 24.4 ng |-1 | Kocman et al. (2011) | |
| Wujiang, Guizhou, China | 0.19 – 36 ng |-1 | Guo et al. (2008) | |
| San Joaquín, Qro., Mexico | 1.5 – 339 μg |-1 | This study | |
| Air | |||
| Almaden, Spain | 100 – 14000 ng m-3 | Higueras et al. (2006) | |
| Idrija, Slovenia | <10 – 5000 ng m-3 | Kocman et al. (2011) | |
| Wanshan, Guizhou, China | 17.8 – 1101.8 ng m-3 | Wang et al. (2007) | |
| San Joaquín, Qro., Mexico | 22 – 153 ng m-3 the community) | This study (measures in | |
| Stream water | |||
| Almaden, Spain | 7.6 – 20300 ng |-1 | Berzas Nevado et al. (2003) | |
| Idrija, Slovenia | 2.8 – 322 ng |-1 | Horvat et al. (2002) | |
| Wuchuan, Guizhou, China | 22 – 360 ng |-1 | Qiu et al. (2006) | |
| San Joaquín, Qro., Mexico | 10 – 170 ng |-1 | This study (Drinking water) | |
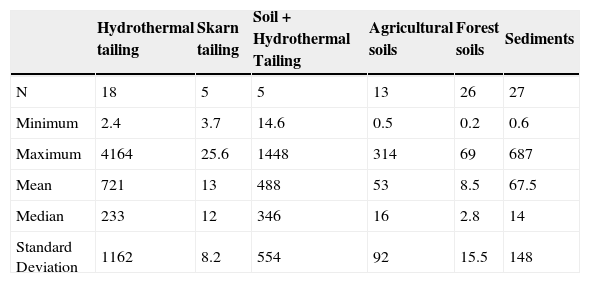
Hydrothermal tailings show total mercury contents ranging from 2.4 to 4164 mg kg-1. It can be seen the range is quite extended; however, most concentrations are somewhere around the median (233 mg kg-1), being the upper limit an extreme value in the region. As expected, the skarn type tailings presented a lower mercury concentration than the hydrotermals, since they present concentrations from 3.7 to 25.6 mg kg-1. Through time, the tailings get mixed with the soil; these kinds of materials showed high content of total mercury, ranging from 14.6 to 1448 mg kg1 (Table 2). These amounts of mercury could be due to inefficient and incomplete cinnabar processing, possible re-absorption of mercury, and direct exposure of the chimney during several years (Biester et al., 1999; Navarro et al., 2009).
Descriptive statistic of mercury content in mine tailings, agricultural soils, forest soils, and sediments (mg/kg).
| Hydrothermal tailing | Skarn tailing | Soil + Hydrothermal Tailing | Agricultural soils | Forest soils | Sediments | |
|---|---|---|---|---|---|---|
| N | 18 | 5 | 5 | 13 | 26 | 27 |
| Minimum | 2.4 | 3.7 | 14.6 | 0.5 | 0.2 | 0.6 |
| Maximum | 4164 | 25.6 | 1448 | 314 | 69 | 687 |
| Mean | 721 | 13 | 488 | 53 | 8.5 | 67.5 |
| Median | 233 | 12 | 346 | 16 | 2.8 | 14 |
| Standard Deviation | 1162 | 8.2 | 554 | 92 | 15.5 | 148 |
N = Number of samples; the maximum limit established for agricultural use 23 mg kg-1 and industrial use 310 mg/kg (NOM, 2004).
Nevertheless, considering the NOM (2004) with regard to concentration levels to be considered as contaminated soil (> 23.0 mg kg-1), it is observed that 37% of the tailing samples analyzed showed mercury concentrations greater than the limit allowed for industrial use 310 mg kg-1 (Figure 5). Mercury concentration in tailings gives the San Joaquín region a high level of contamination. There are a great number of open air mining tailings, located in the surrounding areas of the abandoned mines, becoming a serious risk to people and the environment.

The highest total mercury concentration (4164 mg kg-1) was similar to that reported by Qiu et al. (2005, 2006) in the mining district of Guizhou, China (4400 mg kg-1), but lower than that of Almaden, Spain (34,000 mg kg-1), considered as the place most contaminated by mercury on Earth (Higueras et al., 2003).
Total Hg in soils and sedimentsTotal mercury concentration in agricultural soils is distributed in a wide range, going from 0.5 to 314 mg kg-1 (Table 2), where the highest registered value clearly indicates mercury incorporation into the landscape soils. According to the NOM (2004), 46% of the soil samples analyzed showed mercury concentrations greater than the maximum limit established for agricultural use, 23 mg kg-1 (Figure 5).
The results show that the variations in mercury content in forest soils are lower than the maximum ranges found in agricultural soils. This could be due to the soil processes involved, whether favoring mercury adsorption or hindering its volatilization and/or transformation. Mercury accumulation in forest soils is attributed to the content of organic matter present in the organic horizon (Lacerda et al., 2004; Ettler et al., 2007); with a higher content of organic matter, the soil will have a higher capability to retain mercury.
The land relief of the study region could be an important factor in mercury distribution, given that the forest areas are in a slope >15°, which makes them more susceptible to erosion processes, while agricultural areas are next to forest areas, and therefore are receptors of the mercury eroded by surface runoff. Almeida et al. (2005) mentions that hydric erosion favors re-mobilization of mercury in the surface soil layer.
Moreover, Hernández-Silva et al. (2009) mention that pre-Hispanic agriculture and mining could have been associated in their everyday activities, influencing mercury insertion into agricultural soils near the mines. The soils presented lower mercury contents than those of Idrija, Slovenia (0.39-2759 mg kg-1), Guizhou, China (0.33-790 mg kg-1), and Almaden, Spain (6.0 – 8889 mg kg-1) (Gnamusˇ et al., 2000; Higueras et al., 2003; Qiu et al., 2005).
Total mercury concentrations in sediments varied from 0.6 to 687 mg kg1 (Table 2). According to the obtained values, the mercury content in sediments has a mean value almost equal to the upper limit of the mercury concentration in forest soils, and slightly greater than the mean of agricultural soils. Sediments are a natural means of transportation of mercury loads, causing its dispersion into the drainage network. Several authors (Hines et al., 2000; Feng and Qiu et al., 2008; Lin et al., 2010) point out that mercury concentrations in sediments tend to decrease as they are further from the source of contamination as is demonstrated in Figure 2. The range of total mercury concentrations was similar to that found in Guizhou, China (1.1-480 mg kg-1), but lower than those found in the mining districts of Idrija, Slovenia (5.0-1000 mg kg-1), and Almaden, Spain (0.5-16000 mg kg-1) (Gosar et al., 1997; Higueras et al., 2006; Lin et al., 2010).
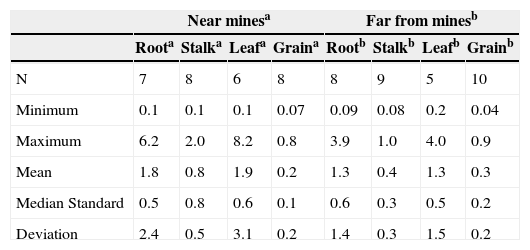
Total Hg in maize cropsThe concentrations of total mercury in the different structures of the maize plants are showed in Table 3. The structures (root, stalk and leaves) close o the mines presented a higher concentration of total mercury than those which are located farther from them, while there was no difference in the maize grain (Figure 6). The maximum concentrations in leaves (8.2 mg Kg-1) and in the grains (0.9 mg Kg-1) resulted higher than those reported by He et al. (1998); being in leaf 1.58 mg kg-1 and in grain 0.41 mg kg-1. The total mercury concentrations found in maize plants (0.04-8.2 mg kg-1) were greater than those found by Qiu et al. (2006) in the mining area of northeast Guizhou, China (0.026-0.57 mg kg-1). In general, there was a greater total mercury accumulation in roots and leaves than in stems and grains.
Total mercury in maize plant structures, samples collected near and far from the mines (mg kg-1).
| Near minesa | Far from minesb | |||||||
|---|---|---|---|---|---|---|---|---|
| Roota | Stalka | Leafa | Graina | Rootb | Stalkb | Leafb | Grainb | |
| N | 7 | 8 | 6 | 8 | 8 | 9 | 5 | 10 |
| Minimum | 0.1 | 0.1 | 0.1 | 0.07 | 0.09 | 0.08 | 0.2 | 0.04 |
| Maximum | 6.2 | 2.0 | 8.2 | 0.8 | 3.9 | 1.0 | 4.0 | 0.9 |
| Mean | 1.8 | 0.8 | 1.9 | 0.2 | 1.3 | 0.4 | 1.3 | 0.3 |
| Median Standard | 0.5 | 0.8 | 0.6 | 0.1 | 0.6 | 0.3 | 0.5 | 0.2 |
| Deviation | 2.4 | 0.5 | 3.1 | 0.2 | 1.4 | 0.3 | 1.5 | 0.2 |
N = Number of samples; the maximum limit established for maize grain 0.5 mg kg-1 and 0.1 mg kg-1 for animal feed (WHO-IPCS, 2004; Sierra et al., 2009).

Plants assimilate organic and inorganic mercury through their radicle system and transport it to the foliage (Hanson et al., 1995). Also, Temmerman et al. (2009) indicate that mercury absorption through plant roots is proportional to the exposition concentration in the soil. Stamenkovic and Gustin (2009) suggest that mercury absorption in foliage occurs through the stomas, and that the accumulation is positively correlated to mercury atmospheric concentration. Another absorption mechanism happens with mercury dissolution in water, incorporating it into foliar tissue (Rea et al., 2004). Atmospheric contamination could be the cause of mercury accumulation in most plants (Patra and Sharma, 2000; Temmerman et al., 2009).
The lowest mercury contents were found in the grains, given that when achieving plant maturity (at the end of harvest) mercury accumulation decreases (Patra and Sharman, 2000). The concentrations of mercury in the maize grain ranged from 0.04 to 0.9 mg kg-1, obtaining higher values to those reported by the World Health Organization of 0.5 mg kg-1 (Figure 6), which is the maximum limit for mercury contaminated food making them unsuitable to be sold for human consumption. In the study region, the maize plant stalk and leaf are used as cattle forage. Sierra et al. (2009) mention that the European legislation establishes a limit of 0.1 mg kg-1 of mercury for animal feed. In this work, higher concentrations than this limit were found; e.g. for the stalk 2.0 mg kg-1 and for leaf 8.2 mg kg1. Bioaccumulation of mercury in maize crops is an entrance source of mercury into the food chain, through foliage consumption by cattle or grains by humans (Rothenberg et al., 2007).
The results show that roots and foliage were more susceptible to mercury accumulation; the former because of the exposition existing with mercury concentration in the soil, and the second due to the atmospheric mercury. However, Molina et al. (2006) and Temmerman et al. (2009) point out that bioaccumulation depends on the absorption mechanism of each plant species. This would explain why in some cases the absorption rate is constant and independent of mercury concentration in the soil; that there is no relationship between mercury content in the soil and in the plant; or that the bioaccumulation of mercury in the plant does not increase even if mercury concentration in the environment increases.
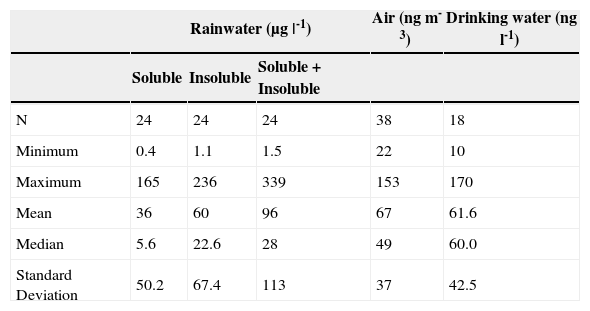
Total Hg in rainwaterThe removal of a contaminant from the atmosphere can happen through precipitation (wet deposition) or by dry deposition (Duce et al., 1983). Total mercury concentrations in rainwater ranged from 1.5 to 339 μg |-1, with a mean 96 μg |-1; 60 μg |-1 corresponding to the insoluble fraction and 36 μg |-1 to the soluble fraction (Table 4 and Figure 7). This agrees with Kocman et al. (2011) since mercury joined with atmospheric particles represents over 50% of the total mercury in the deposition, and the remaining part is dissolved in rainwater. This could suggest that the particles dragged by wind are the main mechanism of atmospheric deposition of mercury in the study area.
Descriptive statistic of mercury content in rainwater, air, and drinking water.
| Rainwater (μg |-1) | Air (ng m-3) | Drinking water (ng l-1) | |||
|---|---|---|---|---|---|
| Soluble | Insoluble | Soluble + Insoluble | |||
| N | 24 | 24 | 24 | 38 | 18 |
| Minimum | 0.4 | 1.1 | 1.5 | 22 | 10 |
| Maximum | 165 | 236 | 339 | 153 | 170 |
| Mean | 36 | 60 | 96 | 67 | 61.6 |
| Median | 5.6 | 22.6 | 28 | 49 | 60.0 |
| Standard Deviation | 50.2 | 67.4 | 113 | 37 | 42.5 |
N = Number of samples; the mercury levels in air are in a range of 2 to 10 ng m-3 (WHO-IPCS, 2004); the maximum limit established for drinking water 0.001 mg |-1 by the NOM (1994) and 6 μg |-1 by the WHO-IPCS (2004).

Duce and Hoffman (1976) concluded that particle removal by rain is approximately twice that of dry deposition. Guo et al. (2008) and Kocman et al. (2011) report concentrations from 0.19 to 36 ng |-1 and 3.15 to 24.4 ng |-1 total mercury in the rainfall of mining zones, being lower those found in this study. This behavior is due to the fact that the samples were collected in 3 to 17 rain events, involving a higher accumulation of particulate material coming from wind erosion. The sampling sites close to the mines and the wind regressive trajectories at 500 m height, indicate that the air masses can drag the particles from the mine tailings, transporting and depositing them, thus causing the soils to be enriched with this pollutant (Figure 3).
Kocman et al. (2011) observed an increase in mercury concentration in the rainfall samples due to the presence of cinnabar particles, as a result of eolian erosion of the surfaces containing cinnabar in the area. Notwithstanding, the particles (aerosols) are not uniformly distributed in the atmosphere, neither spatially nor temporally. This originates differences in mercury deposition, which could explain the variations in the mercury concentration in each rain event.
The results in this study are in agreement with those reported by Guo et al. (2008) who found a positive correlation between precipitation and mercury concentration, establishing that in the rainy season there is a greater wet deposition of mercury. The climatic and orographic conditions of the region favor changes in humidity, temperature, and solar radiation, causing high mercury volatilization in land systems (Gustin et al., 2003; Johnson et al., 2003), which could be contributing to the concentrations of atmospheric mercury.
Hg in airGaseous elemental mercury is the main chemical mercury species released into the atmosphere, it is characterized for being very stable and having low water solubility; it volatilizes at room temperature and is relatively inert to chemical reactions with other atmospheric components. Its residence time is about one year, so once it is released to the atmosphere it can be dispersed or transported to greater distances before being re-deposited in the terrestrial and aquatic ecosystems (Schroeder and Munthe, 1998).
The chemical reactions and the partitioning of mercury in gas and aqueous phases appear to determine mercury residence times in the atmosphere and its deposition at various latitudes (Grandjean, 2008). Kocman et al. (2011) mention that mercury space distribution depends on wind conditions (direction, velocity); on the other hand, the emissions of mercury of the contaminated surfaces depend on temperature. Boening (2000) mentions that the environmental variables such as pH, redox potential, water chemical composition, soil type, and geology affect mercury absorption.
Measurements of total gaseous mercury (TGM) in the air are shown in Table 4. The daily average during the 38 days of measuring was 67 ng m -3, mainly ranging between 40 and 100 ng m-3 (Figure 7). When comparing these concentrations with those reported by Grandjean (2008) in remote areas, of 2-3 ng m-3 in winter, allows to observe the amount of volatilization that exists within the study area. WHO-IPCS (2004) indicate that the mercury levels in air are in a range of 2-10 ng m-3. The mercury values from 40 to 100 ng m-3 obtained in this study, indicate that the San Joaquín population is exposed to a high concentration of mercury in the air, which can be a health hazard.
In general, the concentrations of mercury in the air within the mining populations of Idrija, Slovenia (<10 ng m-3), Guizhou, China (17.8 ng m-3) and San Joaquín (22 ng m-3) are lower than those reported for areas where cinnabar was melted to produce mercury, getting to concentrations from 1101 to 14000 ng m-3 (Higueras et al., 2006; Wang et al., 2007; Kocman et al., 2011). The maximum value of 153 ng m-3 observed in the San Joaquín community is higher than the value reported for the population of Almaden, Spain (100 ng m-3).
Hg in drinking waterThe forms of mercury in drinking water are not well studied, but the mercuric ion is probably the predominant species, present in complexes and chelates with ligands. From the ingestion of drinking water, a small fraction is absorbed. Although the existence of methilmercury has been pointed out in drinking water under certain conditions, its presence is considered unusual enough (UNEP, 2002). Methyl mercury is the result of the methylation of inorganic mercury by the microorganisms that are present in freshwater and saltwater bodies; this methyl mercury produced is capable of entering the aquatic feeding chain and can be bio-accumulated within the muscular tissues of fish (Mason et al., 2005).
The total mercury concentrations in drinking water ranged from 10 to 170 ng |-1 (Table 4 and Figure 7). These contents are below the maximum limit, 0.001 mg |-1, established by the NOM (1994) and the WHO-IPCS (2004) guideline value of 6 μg |-1. This indicates that there is no problem in its use for human consumption. Grandjean (2008) mentions that in drinking water, the mercury concentrations are usually from 5 to 100 ng |-1, becoming a minor public health concern, but the presence of mercury in the water phase in the environment can lead to serious problems, e.g. the intoxication occurred at the Minamata Bay, Japan in 1953 as a result of the ingestion of fish containing methyl mercury coming from polluted waters (Harada, 1995; UNEP, 2002).
The values obtained were lower than those found in the stream water of Idrija, Slovenia (2.8 – 322 ng |-1), Guizhou, China (22 – 360 ng I1), and Almaden, Spain (7.6 – 20300 ng |-1) (Berzas Nevado et al., 2003; Horvat et al., 2002; Qiu et al., 2006). These studies point out the presence of mercury in the water, indicating high concentrations in areas surrounding abandoned cinnabar mines. Cabrera-Vique et al. (2007) suggest a strict vigilance of mercury content in drinking water given the alimentary habits of human beings, since they could be drinking great amounts of water.
ConclusionsThe high production of mercury that happened in the region, especially in the 60’s and 70’s of the last century, left considerable consequences of open air mine tailings and whose dispersion is reflected in the diminishing of the quality of the different environmental compartments. The existing pollution in the San Joaquin region doesn’t reach the levels of the world bigger producers of mercury: Almaden and Idrija (Slovenia); however, it is similar to the ones found in other important world second level mining districts such as: Guizhou (China).
A recurrent pattern of mercury dispersion in the landscape is the existence of high levels of mercury in soils, related to zones with a higher concentration of mine tailings, in which the management and deficient processing of cinnabar have been a constant situation. The dispersion of mercury in soils and sediments is controlled by the distance existing to the mines and the terrain slope that favors constant erosion, transporting mercury to the lower parts.
On the other hand, it is frequent to see at a short distance from the mine mouths and as an economical complement, the existence of plots with maize crops, predominantly, resulting the roots and leaves more susceptible to mercury accumulation, which results in the introduction of the element into the trophyc chain and its bio-accumulation which means a high risk for humans and fauna.
Mercury deposition in the rainwater is especially linked to the atmospheric particles that come from the mercury enriched soils, representing 63% of the deposition, the rest it is found in dissolved form. There exist mercury concentrations in the drinking water of the study area but it doesn’t represent any risk to human health.
The presence of gaseous mercury circulating in the air allows to deduce that there is a continuous volatilization from the soils enriched with mercury. Therefore, the inhabitants keep a constant direct contact with this gas through inhalation. The levels found at the location are greater than the reported standards. These emissions influence mercury accumulation by maize plants.
Based on the previous, the population of San Joaquín and their environment both present a constant exposure to the pollution of mercury, so it is necessary to keep monitoring it in a long term to determine its scope.
Aknowledgments
This investigation is part of the project PAPIIT-UNAM No. 22IN114910. To the laboratory of soils of the Centro de Geociencias, campus UNAM-Juriquilla, Querétaro. To the Geology Institute of Hungary for the analysis performed with the AMA-254 equipment. To Centro Nacional de Investigación y Capacitación Ambiental (CENICA) del Instituto Nacional de Ecología (INE) for the analysis performed with the TEKRAN-2537A equipment. To Consejo Nacional de Ciencia y Tecnología (CONACYT) for the doctoral scholarship.