


Recently, it has been suggested an association between red cell distribution width (RDW) and Crohn's disease activity index (CDAI), but its use is not yet performed in daily clinical practice.
ObjectivesTo determine whether RDW can be used as a marker of Crohn's disease (CD) activity.
MethodsThis was a cross-sectional study including patients with CD, observed consecutively in an outpatient setting between January 1st and September 30th 2013. Blood cell indices, erythrocyte sedimentation rate (ESR), and C-reactive protein were measured. CD activity was determined by CDAI (active disease if CDAI≥150). Associations were analyzed using logistic regression (SPSS version 20).
Results119 patients (56% female) were included in the study with a mean age of 47 years (SD 15.2). Twenty patients (17%) had active disease. The median RDW was 14.0 (13–15). There was an association between RDW and disease activity (p=0.044). After adjustment for age and gender, this association remained consistent (OR 1.20, 95% CI 1.03–1.39, p=0.016). It was also found that the association between RDW and disease activity was independent of hemoglobin and ESR (OR 1.36, 95% CI 1.08–1.72, p=0.01) and of biologic therapy (OR 1.19, 95% CI 1.03–1.37, p=0.017). A RDW cutoff of 16% had a specificity and negative predictive value for CDAI≥150 of 88% and 86%, respectively.
ConclusionIn this study, RDW proved to be an independent and relatively specific marker of CD activity. These results may contribute to the implementation of this simple parameter, in clinical practice, aiming to help therapeutic decisions.
Recentemente, tem vindo a ser sugerida uma associação entre o valor de RDW e a atividade da doença de Crohn (DC), mas a sua utilização não está ainda implementada na prática clínica diária.
ObjetivosDeterminar se o RDW pode ser utilizado como marcador de atividade da DC.
MétodosEstudo transversal, em doentes com DC, observados consecutivamente em consulta de Doença Inflamatória Intestinal, entre 1 de janeiro e 30 de setembro de 2013. Analisaram-se índices do hemograma, proteína C reativa e velocidade de sedimentação. A gravidade da doença foi avaliada pelo Crohn's disease activity index (doença ativa se CDAI≥150). As associações foram estudadas usando a regressão logística (SPSS Statistics V20).
ResultadosIncluídos 119 doentes (56% do sexo feminino), com idade média de 47 anos (DP 15,2 anos). Vinte doentes (17%) tinham doença ativa. O valor do RDW mediano foi 14,0% (13-15). Verificou-se uma associação entre RDW e atividade da doença (p=0,044). Após ajuste para a idade e o sexo, esta associação manteve-se consistente (OR 1,20; 95% CI 1,03-1,39; p=0,016). Verificou-se ainda que a associação do valor do RDW com a atividade da doença foi independente do valor da hemoglobina e da velocidade de sedimentação (OR 1,36; 95% CI 1,08-1,72; p=0,01) e da terapêutica biológica (OR 1,19; 95% CI 1,03-1,37; p=0,017). Para um valor de corte de RDW de 16%, a especificidade e o valor preditivo negativo de CDAI≥ 150 foram de 88% e 86%, respetivamente.
ConclusãoNeste estudo, o valor do RDW demonstrou ser um marcador independente e relativamente específico da atividade da doença de Crohn. Estes resultados poderão contribuir para a aplicação deste parâmetro simples, na prática clinica diária, visando auxiliar decisões terapêuticas.
Crohn's disease (CD) is a chronic inflammatory bowel disease (IBD) characterized by a relapsing-remitting clinical behavior.1 For this reason, the assessment of the severity of IBD and the monitoring of disease activity are important issues.2
Currently, endoscopy with biopsy is considered the gold standard for the evaluation of mucosal inflammation.2,4 However, endoscopy is invasive and requires good bowel cleansing, a procedure that is poorly accepted by patients and potentially harmful.1,2 Therefore, CD activity index (CDAI) is still accepted to grade CD activity by international guidelines, namely European Crohn's and Colitis Organization (ECCO). Despite being based mainly in clinical parameters, it remains the principal index for evaluating CD patients’ outcomes in clinical studies. Clinical remission is accepted as a CDAI of <150.3
To improve non-invasive monitoring of CD activity, numerous biomarkers (e.g. C-reactive protein (CRP), erythrocyte sedimentation rate (ESR), leukocyte and platelet counts, albumin, fecal calprotectin and lactoferrin)5 have been proposed but few have proven to be clinically useful in IBD.1,6 Nevertheless, CRP has been included as an ancillary test to monitor CD activity by ECCO guidelines.3
Red cell distribution width (RDW) is a quantitative measure of variability in the size of circulating erythrocytes.7,8 It is routinely measured by automated hematology analyzers and is usually reported as a component of the complete blood count (CBC),9 thus not implying additional costs.10,11 Until recently, it was used mainly to differentiate iron deficiency anemia from thalassemia trait.11,12 However, in the last years, numerous studies have shown that a higher RDW is associated with several pathologic conditions, including heart failure,9 acute coronary syndrome,13 atherosclerosis,14 pulmonary impairment,15 and venous thromboembolism.16 Also, some studies have suggested that RDW may be an inflammatory marker for IBD, mainly in an inpatient setting.17,18
Since RDW is easily accessible and relatively cheap, understanding its prognostic significance in the context of CD could be useful to optimize clinical decisions. Consequently, we hypothesized that RDW may be a surrogate marker of CD activity, not only in an inpatient setting, but also in an outpatient setting. Accordingly, the purpose of this study was, firstly, to determine whether RDW is associated with CDAI; and, secondly, to identify a possible RDW cutoff with clinical applicability for an outpatient setting.
2Materials and methods2.1Design, setting, and participantsThis was a cross-sectional observational study performed at the Gastroenterology Department of a large district hospital (Prof. Doutor Fernando Fonseca Hospital, Amadora, Portugal).
All CD patients (ascertained by standard clinical, radiological, histological, and endoscopic criteria)3 observed in the IBD outpatient clinic between January 1st and September 30th 2013, with laboratory evaluation up to 2 months before the clinic visit were included in the study. Patients with follow-up at our clinic for less than 6 months, with laboratory evaluation done more than 2 months before the clinic visit, or with lack of information to assess CDAI were excluded from the study.
2.2Variables and primary outcomeSpecific patients’ characteristics considered were the following: age, sex, Montreal classification of CD,20 blood cell indices (RDW, hemoglobin, mean cellular volume (MCV), leukocyte (WBC) and platelet (PLT) counts), inflammatory biochemical parameters (CRP and ESR), and medication related to CD. In our Department, CD management follows ECCO guidelines.21
Primary outcome was defined as CD activity measured by CDAI. This index is a numerical calculation derived from the sum of eight items, each considered after adjustment with a weighting factor. CDAI items include: number of liquid or very soft stools, abdominal pain score, general wellbeing, symptoms related to CD (arthritis or arthralgia, iritis or uveitis, mucocutaneous lesions (e.g. erythema nodosum, pyoderma gangrenosum, aphthous stomatitis), anal disease (e.g. fissure, fistula), external fistula (e.g. skin, bladder, vagina), fever >37.8°C), antidiarrheal medications use, abdominal mass, 47 minus hematocrit (males) or 42 minus hematocrit (females) and 1−x (1−body weight divided by a standard weight).19 Patients who had CDAI≥150 were accepted as having active disease, whilst CDAI<150 defined clinical remission.3
2.3Statistical analysisContinuous variables were reported as mean and standard deviation (SD), if normally distributed, or median and interquartile range (IQR), if non-normally distributed. Categorical variables were reported as absolute number (n) and proportion (%).
Group comparisons of continuous variables were performed using Student t-test or Mann–Whitney test, as appropriate. χ2 test or Fisher's exact test were used for group comparisons of categorical variables.
Logistic regression was used to study associations with the primary outcome. Selection of variables for multivariate analysis was based on clinically relevant knowledge and univariate comparisons yielding a p<0.15. A forward stepwise process was used for the selection of variables to be included in final models. Collinear behavior was studied and corrected where applicable. Models’ discriminative ability was assessed by c-statistic.
A RDW cutoff point with clinical utility was studied through analysis of the coordinate points of ROC curve. Sensitivity, specificity, negative predictive value, and positive predictive value were calculated for the selected cutoff point.
All statistical tests were two-sided and a p<0.05 was considered to be significant.
Statistical analyses were performed using SPSS®, version 20.0 (IBM, New York).
3Results3.1Baseline characteristicsDuring the study period considered, 119 patients were included. Females comprised 56.3% (n=67) and mean age was 47 years (SD, 15.2 years).
According to the Montreal classification,20 the predominant features present from the onset of disease were an age between 17 and 40 years (A2) (n=67; 56.3%); terminal ileal disease location (L1) (n=62; 52%); and non-stenosing and non-penetrating disease behavior (B1) (n=66; 56%). Perianal disease was diagnosed in 24% (n=28) of patients.
Thiopurines and anti-tumor necrosis factor-α (anti-TNF-α) drugs were in use by 40.3% (n=48) and 21% (n=25), respectively (with 8.4% (n=10) patients taking both drugs).
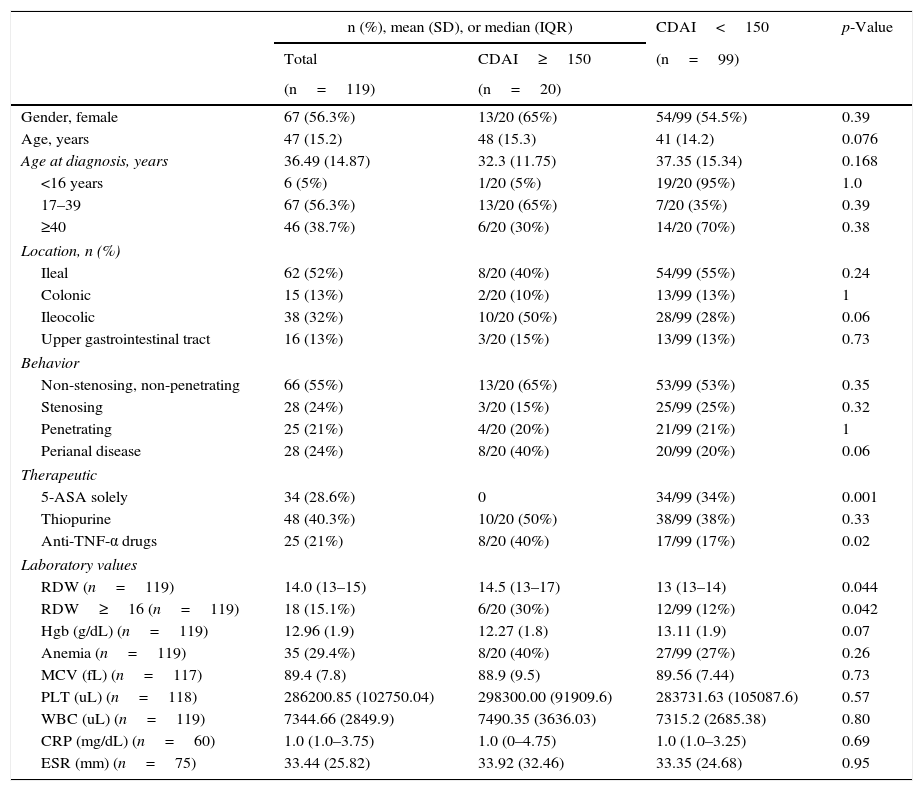
Baseline characteristics are depicted in Table 1.
Overall baseline characteristics and univariate comparisons based on disease activity measured by CDAI.
| n (%), mean (SD), or median (IQR) | CDAI<150 | p-Value | ||
|---|---|---|---|---|
| Total | CDAI≥150 | (n=99) | ||
| (n=119) | (n=20) | |||
| Gender, female | 67 (56.3%) | 13/20 (65%) | 54/99 (54.5%) | 0.39 |
| Age, years | 47 (15.2) | 48 (15.3) | 41 (14.2) | 0.076 |
| Age at diagnosis, years | 36.49 (14.87) | 32.3 (11.75) | 37.35 (15.34) | 0.168 |
| <16 years | 6 (5%) | 1/20 (5%) | 19/20 (95%) | 1.0 |
| 17–39 | 67 (56.3%) | 13/20 (65%) | 7/20 (35%) | 0.39 |
| ≥40 | 46 (38.7%) | 6/20 (30%) | 14/20 (70%) | 0.38 |
| Location, n (%) | ||||
| Ileal | 62 (52%) | 8/20 (40%) | 54/99 (55%) | 0.24 |
| Colonic | 15 (13%) | 2/20 (10%) | 13/99 (13%) | 1 |
| Ileocolic | 38 (32%) | 10/20 (50%) | 28/99 (28%) | 0.06 |
| Upper gastrointestinal tract | 16 (13%) | 3/20 (15%) | 13/99 (13%) | 0.73 |
| Behavior | ||||
| Non-stenosing, non-penetrating | 66 (55%) | 13/20 (65%) | 53/99 (53%) | 0.35 |
| Stenosing | 28 (24%) | 3/20 (15%) | 25/99 (25%) | 0.32 |
| Penetrating | 25 (21%) | 4/20 (20%) | 21/99 (21%) | 1 |
| Perianal disease | 28 (24%) | 8/20 (40%) | 20/99 (20%) | 0.06 |
| Therapeutic | ||||
| 5-ASA solely | 34 (28.6%) | 0 | 34/99 (34%) | 0.001 |
| Thiopurine | 48 (40.3%) | 10/20 (50%) | 38/99 (38%) | 0.33 |
| Anti-TNF-α drugs | 25 (21%) | 8/20 (40%) | 17/99 (17%) | 0.02 |
| Laboratory values | ||||
| RDW (n=119) | 14.0 (13–15) | 14.5 (13–17) | 13 (13–14) | 0.044 |
| RDW≥16 (n=119) | 18 (15.1%) | 6/20 (30%) | 12/99 (12%) | 0.042 |
| Hgb (g/dL) (n=119) | 12.96 (1.9) | 12.27 (1.8) | 13.11 (1.9) | 0.07 |
| Anemia (n=119) | 35 (29.4%) | 8/20 (40%) | 27/99 (27%) | 0.26 |
| MCV (fL) (n=117) | 89.4 (7.8) | 88.9 (9.5) | 89.56 (7.44) | 0.73 |
| PLT (uL) (n=118) | 286200.85 (102750.04) | 298300.00 (91909.6) | 283731.63 (105087.6) | 0.57 |
| WBC (uL) (n=119) | 7344.66 (2849.9) | 7490.35 (3636.03) | 7315.2 (2685.38) | 0.80 |
| CRP (mg/dL) (n=60) | 1.0 (1.0–3.75) | 1.0 (0–4.75) | 1.0 (1.0–3.25) | 0.69 |
| ESR (mm) (n=75) | 33.44 (25.82) | 33.92 (32.46) | 33.35 (24.68) | 0.95 |
n, frequency; SD, standard deviation; IQR, inter-quartile range; CDAI, Crohn's disease activity index; RDW, red cell distribution width; Hgb, hemoglobin; WBC, white blood cell count; PLT, platelet count; Anti-TNF-α, anti-tumor necrosis factor-α; ESR, erythrocyte sedimentation rate; CRP, C-reactive protein.
Anemia was defined as hemoglobin <13g/dL if male gender; or hemoglobin <12g/dL if female gender.
Anemia (defined as hemoglobin <13g/dL if male gender; or hemoglobin <12g/dL if female gender)22 was present in 29.4% (n=35) of patients.
The median RDW was 14.0 (13–15); the median CRP was 1.0mg/dL (1.0–3.75) and mean ESR was 33mm.
Concerning CD activity measured by CDAI, 17% (n=20) of CD patients had active disease (CDAI≥150) whereas 83% (n=99) were in clinical remission.
Ten patients with CDAI≥150 had CRP≥1.0mg/dL.
3.2Univariate analysisIn univariate comparisons, RDW (14.5 (13–17) vs 13 (13–14); p=0.044), and anti-TNF-α drugs (40% vs 17%; p=0.044) were the only factors associated with CDAI≥150.
Albeit not statistically significant associated with CDAI, there was a trend toward association between age, ileocolic location, perianal disease and hemoglobin value and active disease (Table 1). The other variables analyzed, with a special focus on CRP and ESR, were not significantly different between patients with CDAI<150 and patients with CDAI≥150.
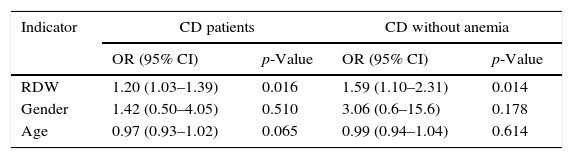
3.3Multivariate analysisIn multivariate analysis, after adjusting for age and gender, RDW was associated with CDAI≥150. In the sub-population of patients without anemia, RDW was also associated with CDAI, even after adjusting for age and gender (Table 2).
Independent indicators association with active CD by multivariate logistic regression analysis.
| Indicator | CD patients | CD without anemia | ||
|---|---|---|---|---|
| OR (95% CI) | p-Value | OR (95% CI) | p-Value | |
| RDW | 1.20 (1.03–1.39) | 0.016 | 1.59 (1.10–2.31) | 0.014 |
| Gender | 1.42 (0.50–4.05) | 0.510 | 3.06 (0.6–15.6) | 0.178 |
| Age | 0.97 (0.93–1.02) | 0.065 | 0.99 (0.94–1.04) | 0.614 |
Multivariate logistic regression analysis for RDW, gender, age, and hemoglobin.
RDW, red cell distribution width.
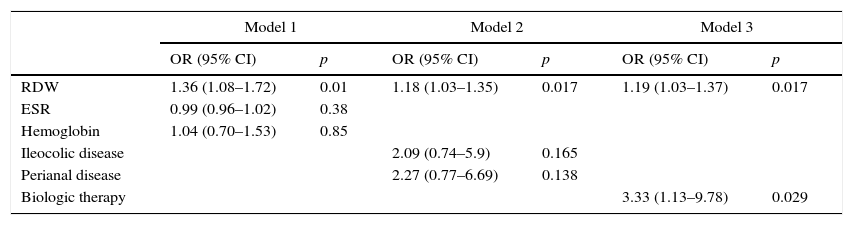
Subsequently, in order to better study the association of RDW with CDAI≥150, three further models were derived. As depicted in Table 3, RDW was independently and consistently associated with CDAI after adjusting for hemoglobin and ESR (Model 1), or ileocolic and perianal disease (Model 2), or anti-TNF-α therapy (Model 3).
Multivariate logistic regression analysis for the association between RDW and CDAI.
| Model 1 | Model 2 | Model 3 | ||||
|---|---|---|---|---|---|---|
| OR (95% CI) | p | OR (95% CI) | p | OR (95% CI) | p | |
| RDW | 1.36 (1.08–1.72) | 0.01 | 1.18 (1.03–1.35) | 0.017 | 1.19 (1.03–1.37) | 0.017 |
| ESR | 0.99 (0.96–1.02) | 0.38 | ||||
| Hemoglobin | 1.04 (0.70–1.53) | 0.85 | ||||
| Ileocolic disease | 2.09 (0.74–5.9) | 0.165 | ||||
| Perianal disease | 2.27 (0.77–6.69) | 0.138 | ||||
| Biologic therapy | 3.33 (1.13–9.78) | 0.029 | ||||
RDW, red cell distribution width; ESR, erythrocyte sedimentation rate OR, odds ratio; CI, confidence interval.
Model 1: χ2 test 9 (degrees of freedom: 3); p=0.030; area under ROC curve: 0.73 (95% CI: 0.58, 0.89); n=75 patients.
Model 2: χ2 test 11 (degrees of freedom: 3); p=0.012; area under ROC curve: 0.71 (95% CI: 0.58, 0.84); n=119 patients.
Model 3: χ2 test 10.5 (degrees of freedom: 2); p=0.005; area under ROC curve: 0.70 (95% CI: 0.55, 0.84); n=119 patients.
Finally, through analysis of coordinate points of ROC curve, the cutoff 16% was deemed the best in prognosticating active disease (AUC 0.64: 95% CI: 0.5–0.78); inherent sensitivity, specificity, negative predictive value, and positive predictive value of 30%, 88%, 86% and 33%, respectively (Fig. 1).
4Discussion. ROC, receiver operating characteristic.")
In this transversal study, we found that an increase in RDW, a simple parameter that is reported as part of a standard complete blood count, was associated with the severity of Crohn's disease, assessed by CDAI.
This association remained consistent after adjustment for clinical, laboratory parameters and therapy (age, gender, disease location, perianal disease, hemoglobin and erythrocyte sedimentation rate, and anti-TNF-α drugs). These results are in line with previous recent results.9,17,18,23
The mechanisms that mediate the relationship between high RDW values and increased CD activity are still unknown. An elevated RDW is commonly found when there is a nutritional deficiency, such as iron, folate, or vitamin B12 deficiency.24 Also, conditions that cause more immature cells to be released into the bloodstream (severe blood loss), abnormal hemoglobins (e.g. sickle cell anemia), or hemolysis can also modify the shape of red blood cells, resulting from an increased RDW.25 Also, it has been demonstrated that a chronic inflammatory state may contribute to ineffective erythropoiesis causing immature erythrocytes to enter the circulation, resulting in elevated RDW. Several mechanisms are believed to mediate the relationship between the chronic inflammatory state and ineffective erythropoiesis leading to elevated RDW.26,27 Proinflammatory cytokines like tumor necrosis factor-α and interleukin-6 may hinder erythropoiesis via direct suppression of erythroid precursors, promotion of apoptosis of precursor cells, enhancement of erythropoietin resistance in the precursor cell lines and reduction in bioavailability of iron for hemoglobin synthesis. Higher oxidative stress may reduce erythrocyte life-span and thus may result in anisocytosis due to an increase in the proportion of circulating premature erythrocytes.26–28
The majority of patients observed in the IBD outpatient clinic were in clinical remission, assessed by CDAI. Only 17% were considered to have active disease, despite the fact that 45% of patients had complicated CD, defined as stricturing or penetrating behavior.
One interesting finding was that median CRP value was 1mg/dL both in patients in clinical remission and in patients with active disease, which is near the normal value (<0.3mg/dL). As CRP is considered an objective marker of inflammation,5 the low value may be explained by low inflammatory activity despite having active disease according to CDAI.
In this study, we analyzed the association between hematological parameters (including hemoglobin, MCV, RDW, PLT, and WBC), CRP, and ESR with CDAI. Through univariate comparisons, we demonstrated RDW was the only laboratory parameter independently associated with CDAI.
Multivariate logistic regression analysis revealed that RDW was associated with CDAI considering all patients included in the study (anemic and non-anemic patients), even after adjusting for demographic data (age and gender). These results were similar in the sub-population of patients without anemia, which is an important finding that is not completely understood.
Song et al.17 reported identical results. In their study, they showed RDW was highly correlated with disease activity in non-anemic patients as well as anemic patients with IBD.
In the study performed by Cakal et al.,23 it was also found that RDW was significantly elevated in patients having active IBD compared with those without active disease.
Furthermore, hemoglobin and ESR, ileocolic and perianal disease, and anti-TNF-α therapy did not considerably modify the association between RDW and CDAI. It is particular relevant the fact that the association between RDW and CD activity was independent of anti-TNF-α drugs. We do think this finding may be due to a more severe disease which is indeed more difficult to control.
These results are in line with the ones reported by Song and colleagues.17 In multivariate analysis, after adjusting for patient demographics and hematologic parameters, the authors showed RDW was associated with CDAI≥150.
Finally, this study revealed RDW cutoff of 16% had high specificity and negative predictive value for determining the disease activity in CD patients, albeit with a low sensitivity. The low positive predictive value may be due to the low prevalence of primary outcome.
In the study performed by Yesil et al.,18 a RDW cutoff of 14.7 had a sensitivity of 45% and a specificity of 96% in detecting active CD. However, in the Cakal et al.’s23 study a RDW cutoff of 14.1 showed 78% sensitivity and only 63% specificity to detect active CD.
4.1Strengths and limitationsThis study has some limitations that may be referred.
First, this is an observational study performed in one hospital only. For this reason, it is prone to selection bias and limited generalization. Second, the size of our population with active disease was small due to the fact that all patients included were in outpatient setting. Future studies with a larger population of active CD patients will allow to accurately identify the degree of RDW increase which reveals active disease. Third, iron status was not determined (which, as discussed above, may influence RDW values).
Strengths of this study include the fact that all patients included were in outpatient setting and association between RDW and CDAI was adjusted for clinical and laboratory parameters that are relevant in daily clinical practice.
Second, RDW is routinely measured by automated hematology analysers and is reported as a component of the complete blood. Thus, testing RDW is easy to perform, affordable and does not require any additional costs.
If in future of large prospective studies, RDW is confirmed to be an accurate parameter for disease activity monitoring, this could impact positively outpatient IBP patients’ surveillance and decision making.
5ConclusionIn conclusion, in this study we demonstrated RDW was associated with the severity of Crohn's disease, assessed by Crohn's disease activity index. The RDW cutoff 16% showed possible clinical applicability.
Conflicts of interestThe authors have no conflicts of interest to declare.
Ethical disclosuresProtection of human and animal subjectsThe authors declare that the procedures followed were in accordance with the regulations of the relevant clinical research ethics committee and with those of the Code of Ethics of the World Medical Association (Declaration of Helsinki).
Confidentiality of dataThe authors declare that they have followed the protocols of their work center on the publication of patient data.
Right to privacy and informed consentThe authors have obtained the written informed consent of the patients or subjects mentioned in the article. The corresponding author is in possession of this document.
