
Thromboxane (TX) A2 was identified as an important vasoconstrictor during Zymosan induced portal perfusion pressure (PP) increase. We aimed at investigating whether hepatic steatosis influences the extent of TXA2-induced portal hypertension.
Materials and methodsSprague–Dawley rats were randomly divided into control and steatosis (induced by the special diet) groups. PP and TXB2 (stable degradation product of TXA2) in the perfusate were measured after in situ liver perfusion with Zymosan (150μg/ml, 40–46min) or U46619 (TXA2 analog, 0.1μM/ml, 40–46min). The number of Kupffer cell (KC) was measured by immunohistochemistry with CD163.
ResultsZymosan induced more TXB2 production and a higher PP increase in control group than in steatosis group despite more CD163 positive KCs in fatty livers. PP and TXB2 efflux revealed a strong correlation in control group and a moderate correlation in steatosis group. Contrary to the effect of Zymosan, U46619 induced a much higher PP increase in steatosis group than in control group.
ConclusionSevere steatosis increased number of KCs, however, PP increase and TXB2 efflux caused by Zymosan infusion in fatty livers were lower than those in healthy livers. In contrast, TXA2 analog caused higher PP increase in fatty livers. Targeting the more sensitive response to TXA2 in fatty livers might be a potential therapy of severe steatosis.
Se ha identificado al tromboxano (TX) A2 como importante vasoconstrictor durante el aumento de la presión de perfusión portal (PP) inducida por zymosan. El objetivo ha sido analizar si la esteatosis hepática influye en el grado de hipertensión portal inducida por TXA2.
Materiales y métodosLas ratas Sprague-Dawley® se han dividido aleatoriamente en grupos de control y esteatosis (inducida por una dieta especial). Se midieron la PP y el TXB2 (producto de degradación estable de TXA2) en la perfusión después de la perfusión hepática in situ de zymosan (150μg/ml, minuto 40-46) o U46619 (análogo de TXA2, 0,1μM/ml, minuto 40-46). El número de células de Kupffer (CK) se midió mediante inmunohistoquímica con CD163.
ResultadosZymosan provocó más producción de TXB2 y mayor aumento de la PP en el grupo de control que en el grupo de esteatosis a pesar de hallar más CK positivas para CD163 en hígados grasos. El flujo de salida de la PP y el TXB2 reveló una fuerte correlación en el grupo de control y una correlación moderada en el grupo de esteatosis. De manera diferente al efecto de zymosan, U46619 indujo un aumento de la PP mucho mayor en el grupo de esteatosis que en el grupo de control.
ConclusiónLa esteatosis grave aumentó el número de CK; sin embargo, el aumento de la PP y el flujo de TXB2 provocado por la perfusión de zymosan en hígados grasos fueron menores que en los hígados sanos. En cambio, el análogo de TXA2 provocó un aumento de la PP en hígados grasos. Centrarse en la respuesta más sensible al TXA2 en hígados grasos podría convertirse en un tratamiento potencial de la esteatosis grave.
Chronic liver disease (CLD) is referred to as an immune dysfunction syndrome mostly caused by liver fibrosis and steatohepatitis.1 Liver cirrhosis and various complications are the consequences of CLDs and a significantly higher survival rate can be achieved if CLDs are treated early and reasonably.2 Yet causes and mechanism of progression from CLDs to liver cirrhosis remain obscure.
Steatosis is recognized more and more as an important source of liver-related morbidity and mortality.3 Severe hepatic steatosis may induce inflammation and hepatocellular damage, leading to the definition of nonalcoholic steatohepatitis (NASH).3,4 Previous publications reported that severe steatosis alone can significantly elevate the portal pressure.5 Intrahepatic vascular hyperreactivity and increased thromboxane (TX) might significantly contribute to severe steatosis and be involved in the procedures of fibrosis and portal hypertension.6
Kupffer cells (KCs) and contractile cells are the key cells in the process of hypertension. KCs are one of the first liver cells to come into contact with microbial products and importantly increase portal pressure.6,11 Zymosan, a mixture derived from yeast cell walls, could activate KCs and increase portal pressure in both in vivo and in vitro models of the isolated perfused rat liver.7,8 TXA2, prostaglandins (PG) D2 and F2a have been reported to be main vasoactive substances released by KCs during zymosan phagocytosis.9,10 Previous results verified the vital role for TXA2, but not for PGD2 and PGF2α, in mediating the Zymosan-induced portal pressure increase.7 TXA2 and cysteinyl leukotrienes produced by KCs induce contraction of contractile cells and subsequently lead to portal hypertension.11,12 In one clinical study, contractile cells from the cases of fatty livers or NASH nearly all showed activation, supporting the association between steatosis and intrahepatic vasoconstriction.13
We have shown vasopressor response was augmented in fibrotic livers induced by bile duct ligation. However, the effect of severe steatosis on liver portal pressure has not been well investigated. In the present study, Zymosan and TXA2 analog U46619 were administrated to rats with severe steatosis. Compared with healthy rats, we aimed to investigate whether hepatic steatosis influences the extent of TXA2 induced portal hypertension.
Materials and methodsAnimal studiesAll animals were ethically treated according to the criteria prepared by the National Academy of Sciences and published by the National Institutes of Health in addition to the legal requirements in Germany. All animal experiments were approved by the local government (Regierung von Oberbayern, Munich, Germany) and were reported to the responsible authorities annually.
Induction of hepatic steatosis by high fat dietTo induce hepatic steatosis, the Sprague–Dawley rats received a special diet treatment: on first 10 days, the rats received control diet with 10% energy from fat (Altromin, Lage) to prepare the gastrointestinal tract. Then the rats received the high-fat diet with 70% energy from fat (Altromin, Lage) for 4 weeks ad libitum until start of experiments.14
In situ rat liver perfusion studyThe procedures have been well described in earlier publications.7,15,16 Briefly, rats were anesthetized by intraperitoneal injections of sodium pentobarbital (50mg/kg body weight). Then, a 14-gauge Teflon intravenous catheter was used to cannulate the portal vein. The inferior vena cava was cannulated through the right atrium and ligated above the right renal vein. In all experiments, Krebs–Henseleit solutions (pH 7.4, 37°C) were used for perfusing in a non-recirculating manner. The perfusion buffer was gassed with a mixture of 95% O2 and 5% CO2. The liver viability was determined by stable perfusion pressure during initial 20-min stabilization period.
Kupffer cell activationKCs were activated by infusion of cell wall particles from Saccharomyces cerevisiae (Zymosan). Zymosan suspensions (150μg/ml) preparation was described previously.7,15,16 In short, Zymosan suspensions (37.5mg/50ml water) were boiled for 30min at 95°C, then, cold water and 10-fold concentrated Krebs–Henseleit stock buffers were added to a final volume of 250ml. Final Zymosan suspensions in Krebs–Henseleit buffer were infused from 40 to 46min after starting liver perfusion.
In further experiments, the special TXA2 analog U46619 was used to activate contractile cells. Aliquots of an ethanol stock solution (10mM) of U46619 (Axxora, San Diego, CA, USA) were stored at −80°C before use.
TXA2 measurement by ELISATXA2 efflux was quantified by the release into liver perfusate. Perfusate samples were stored at −80°C until measurement. The procedures were well described in our publications before.7,12 TXB2, the stable degradation product of TXA2, was measured by TXB2 ELISA kit (Cayman Chemical, USA).
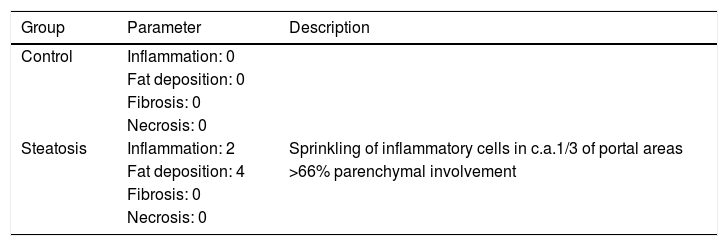
Histological evaluation and immunohistochemistrySections of the livers were fixed in 4% buffered formalin, dehydrated in graded ethanol and embedded in paraffin. These sections were stained with H&E (hematoxylin & eosin). Simple grading and staging systems (0–4 scores represent no, low, mild, moderate and severe stages) were used to compare severities of inflammation, fat deposition, fibrosis and necrosis in control and steatosis groups.17
The number of KCs was compared by immunohistochemistry (IHC) with primary antibodies against CD163 (1:100; Acris, USA). The procedure was according to the instruction of the antibody.18 In brief, paraffin sections were blocked with 0.3% H2O2 in PBS, followed by washing with three changes of PBS. Nonspecific binding sites were blocked with 1% bovine serum albumin (BSA). The sections were then incubated with CD163 antibody overnight. After washing in PBS, the slides were incubated with secondary antibody 1h in room temperature the other day. The number of CD163 positive cells on every high power field (HPF) was compared between different groups.
Statistical analysesRats were randomly distributed to different groups, all data were presented as the mean±standard deviation (SD). The Student's two-tailed t-test was used for paired or unpaired observations. A value of P<0.05 was considered to be statistically significant; n denotes the number of animals used. SPSS and Graphpad were used for data analysis and figure drawing.
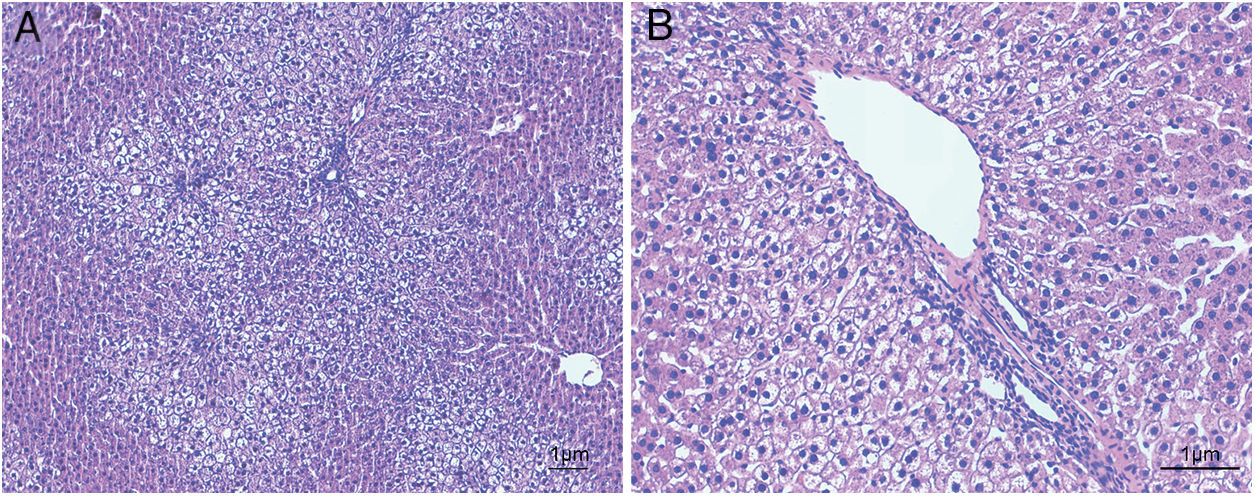
ResultsHistological evaluation in different groupsControl (healthy rats without any treatment) and steatosis (induced by the special diet treatment) groups were included in the experiment. Histological evaluation with H&E staining (Fig. 1) and the relating scores (Table 1) confirmed hepatic steatosis: liver histology from control group was strictly normal (no steatosis, inflammation or fibrosis) while the special diet induced severe fat deposition and mild inflammation in steatosis group.
 staining from five independent experiments in steatosis group (A, 100× magnification; B, 200× magnification). Special diet for 4 weeks induced severe fat deposition and mild inflammation in steatosis group.")
Hematoxylin and eosin staining results in steatosis group. The typical picture of hematoxylin and eosin (H&E) staining from five independent experiments in steatosis group (A, 100× magnification; B, 200× magnification). Special diet for 4 weeks induced severe fat deposition and mild inflammation in steatosis group.
Histological evaluation in control and steatosis groups.
| Group | Parameter | Description |
|---|---|---|
| Control | Inflammation: 0 | |
| Fat deposition: 0 | ||
| Fibrosis: 0 | ||
| Necrosis: 0 | ||
| Steatosis | Inflammation: 2 | Sprinkling of inflammatory cells in c.a.1/3 of portal areas |
| Fat deposition: 4 | >66% parenchymal involvement | |
| Fibrosis: 0 | ||
| Necrosis: 0 |
Inflammation, fat deposition, fibrosis and necrosis were used to confirm the effects of treatment in steatosis group (4 weeks treatment with the special diet). Healthy rats were used as negative control, evaluation scores were based on the H&E results in every group (n=5 in each group).
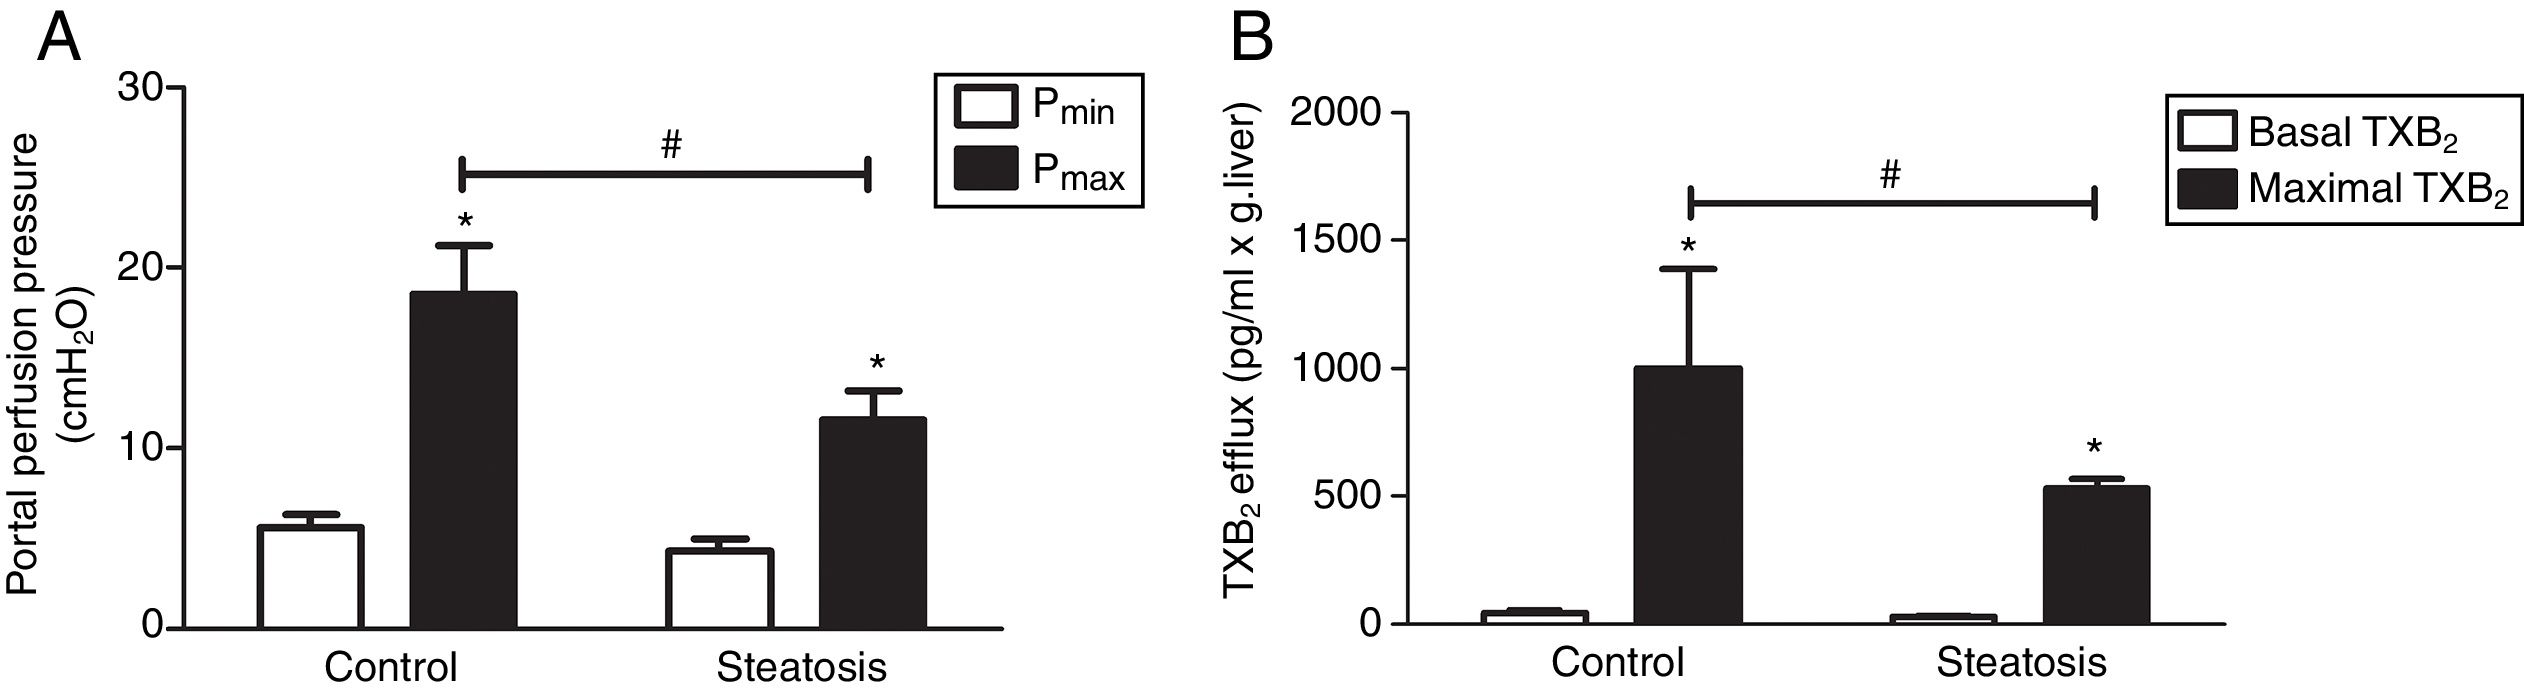
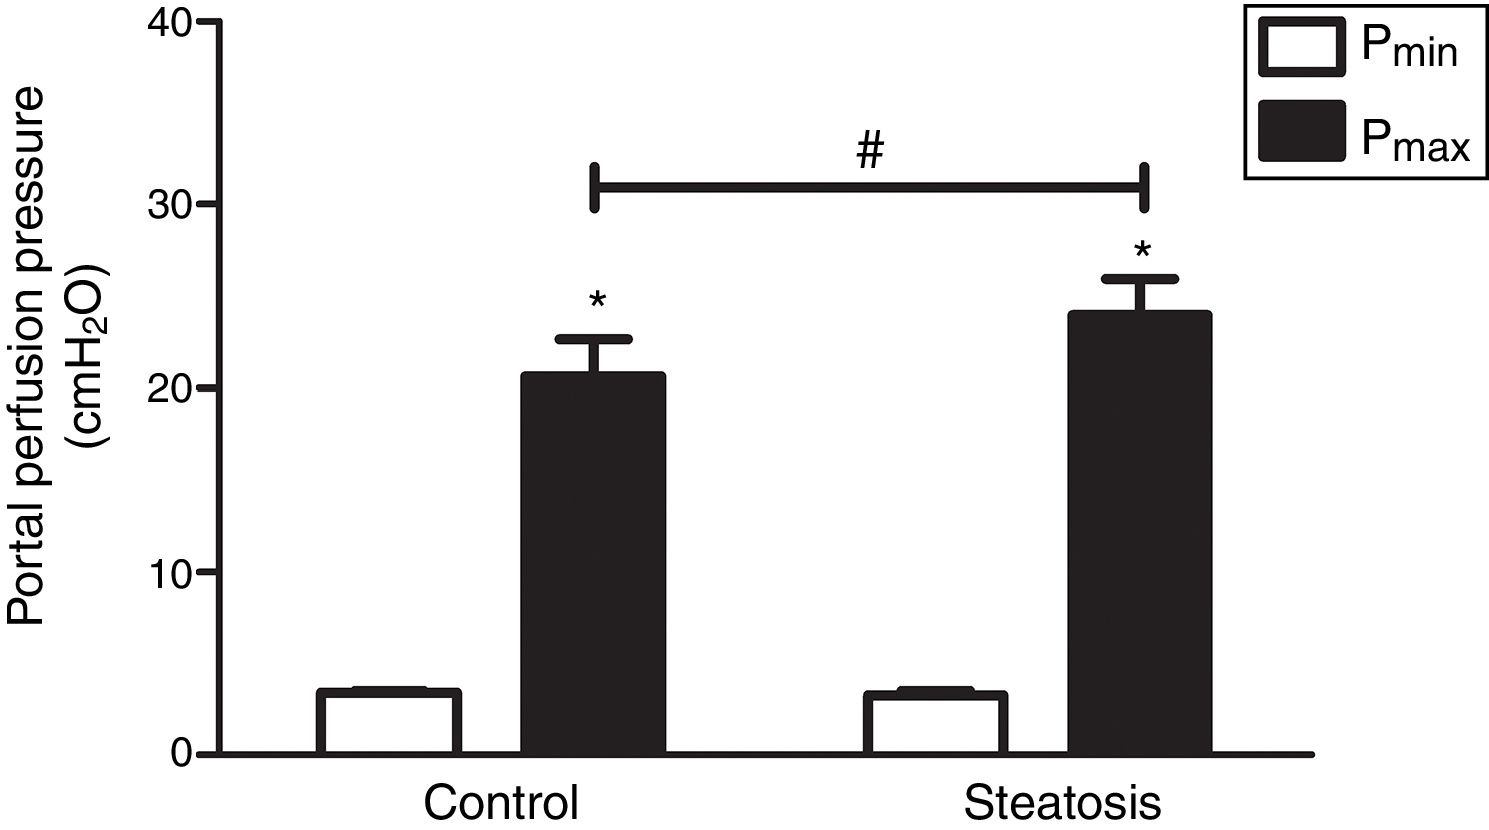
We determined the basal and maximal portal perfusion pressure (Pmin and Pmax) during the liver perfusion with Zymosan infusion (150μg/ml, 40–46min). Zymosan significantly increased portal perfusion pressure (PP) in both groups: from basal 5.58±0.73 to maximum 18.46±2.74cmH2O in control group and from 4.32±0.66 to 11.60±1.56cmH2O in steatosis group (P<0.05 in each group). Pmax in steatosis group was much lower than that in control group (P<0.05) while Pmin were almost the same in these groups (Fig. 2A). Meanwhile, Zymosan infusion also increased TXB2 efflux from basal 41.77±12.97 to maximal 1003.09±384.69 and from 29.4±4.43 to 532.72±36.08pg/ml×gliver in control and steatosis groups respectively (P<0.05 in each group). Comparing between these groups, maximal TXB2 caused by Zymosan was much higher (P<0.05) in control group (Fig. 2B).
 Infusion of Zymosan (150μg/ml) into the portal vein of anesthetized rats from 40 to 46min after starting liver perfusion significantly increased portal perfusion pressure in control and steatosis groups (*P<0.05). Basal portal perfusion (Pmin) had no difference between two groups while the maximal portal perfusion pressure (Pmax) in control group is much higher (#P<0.05). (B) Zymosan infusion significantly increased thromboxane (TX) B2 efflux in both groups (*P<0.05). Comparing between these two groups, Zymosan caused a much higher maximal TXB2 efflux in control group (#P<0.05). n=5 in each group, data are expressed as mean±SD.")
Influence of Zymosan on portal perfusion pressure and thromboxane B2 efflux. (A) Infusion of Zymosan (150μg/ml) into the portal vein of anesthetized rats from 40 to 46min after starting liver perfusion significantly increased portal perfusion pressure in control and steatosis groups (*P<0.05). Basal portal perfusion (Pmin) had no difference between two groups while the maximal portal perfusion pressure (Pmax) in control group is much higher (#P<0.05). (B) Zymosan infusion significantly increased thromboxane (TX) B2 efflux in both groups (*P<0.05). Comparing between these two groups, Zymosan caused a much higher maximal TXB2 efflux in control group (#P<0.05). n=5 in each group, data are expressed as mean±SD.
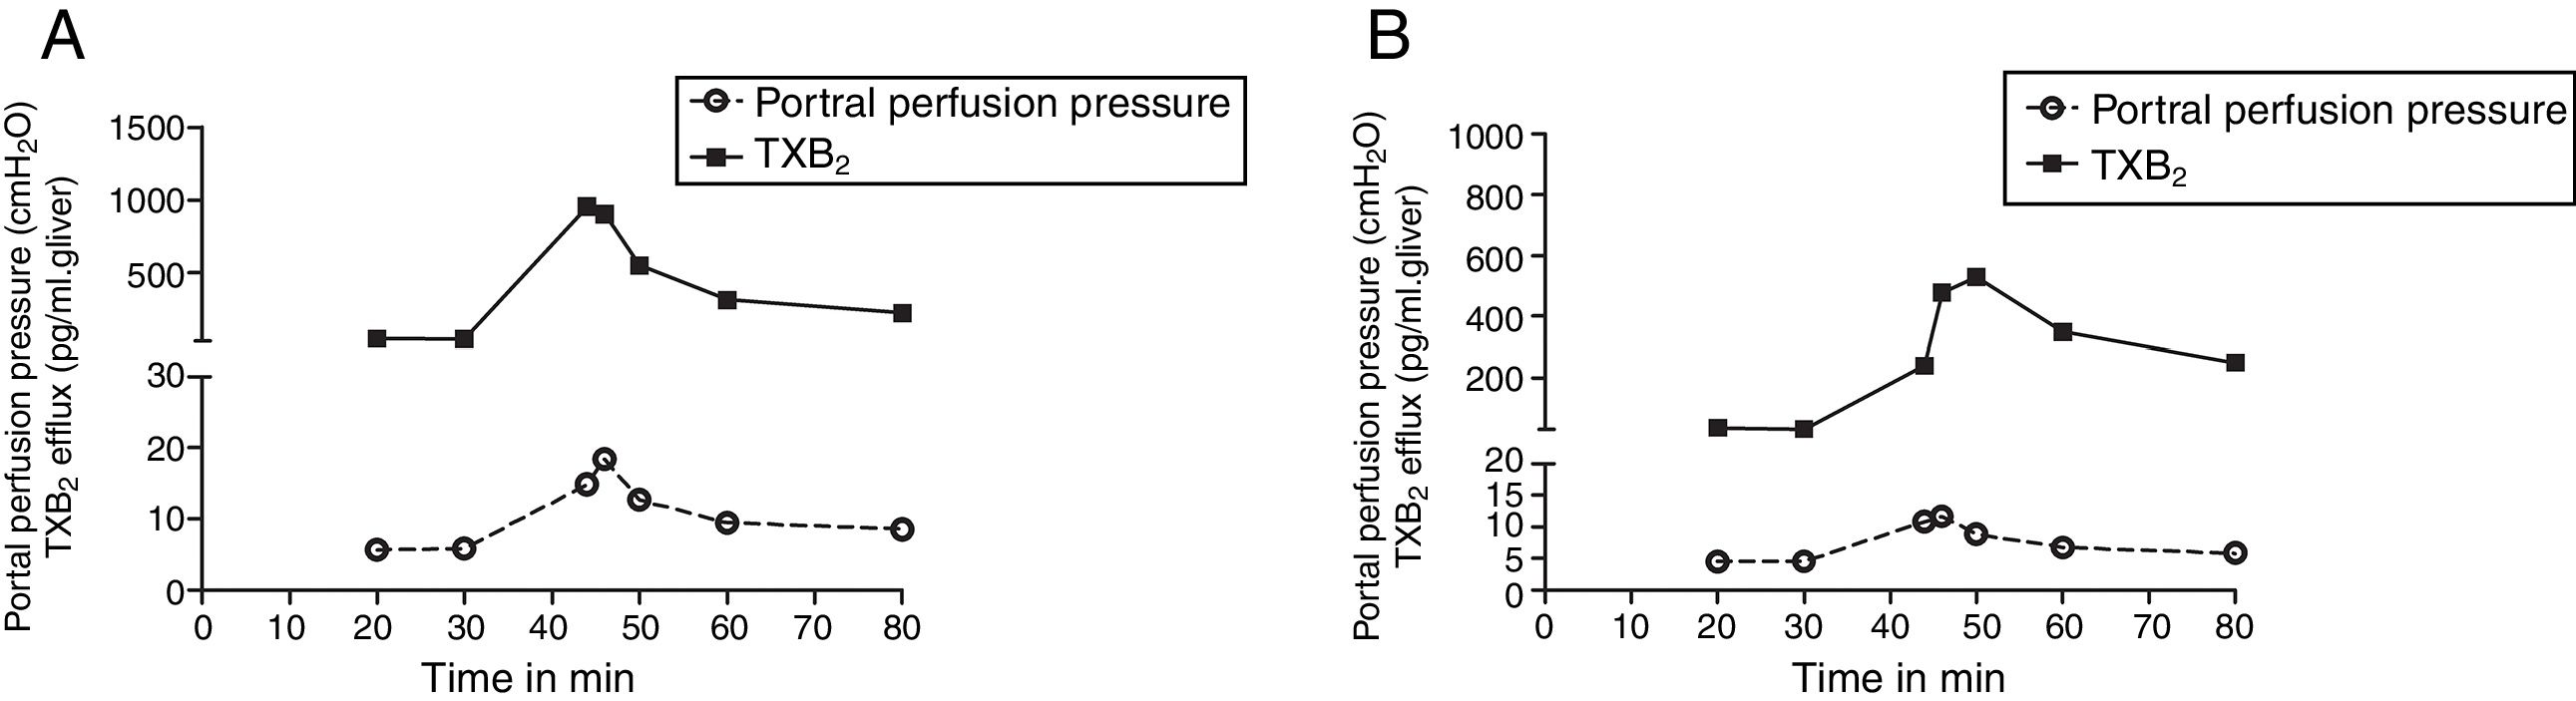
We compared the curves of PP and TXB2 efflux over time after Zymosan infusion in order to confirm their correlations. The curve trends of PP and TXB2 efflux in both groups were almost in parallel: Zymosan infusion caused a transient increase of PP or TXB2 efflux from 40 to 46min after starting perfusion, then, decreased from the summit until end (Fig. 3). Correlation coefficients (CC) and P values between PP and TXB2 curves also revealed a strong correlation in control group (CC=0.965, P=0.0004) and a moderate correlation in steatosis group (CC=0.725, P=0.065).
 B2 efflux in both groups were almost in parallel: After a transient increase by Zymosan infusion (150μg/ml, 40–46min), portal perfusion pressure or TXB2 efflux decreased until the end of the perfusion in both control (A) and steatosis (B) groups (n=5 in each group).")
The curves of portal perfusion pressure and thromboxane B2 efflux following Zymosan infusion. The curve trends of portal perfusion pressure and thromboxane (TX) B2 efflux in both groups were almost in parallel: After a transient increase by Zymosan infusion (150μg/ml, 40–46min), portal perfusion pressure or TXB2 efflux decreased until the end of the perfusion in both control (A) and steatosis (B) groups (n=5 in each group).
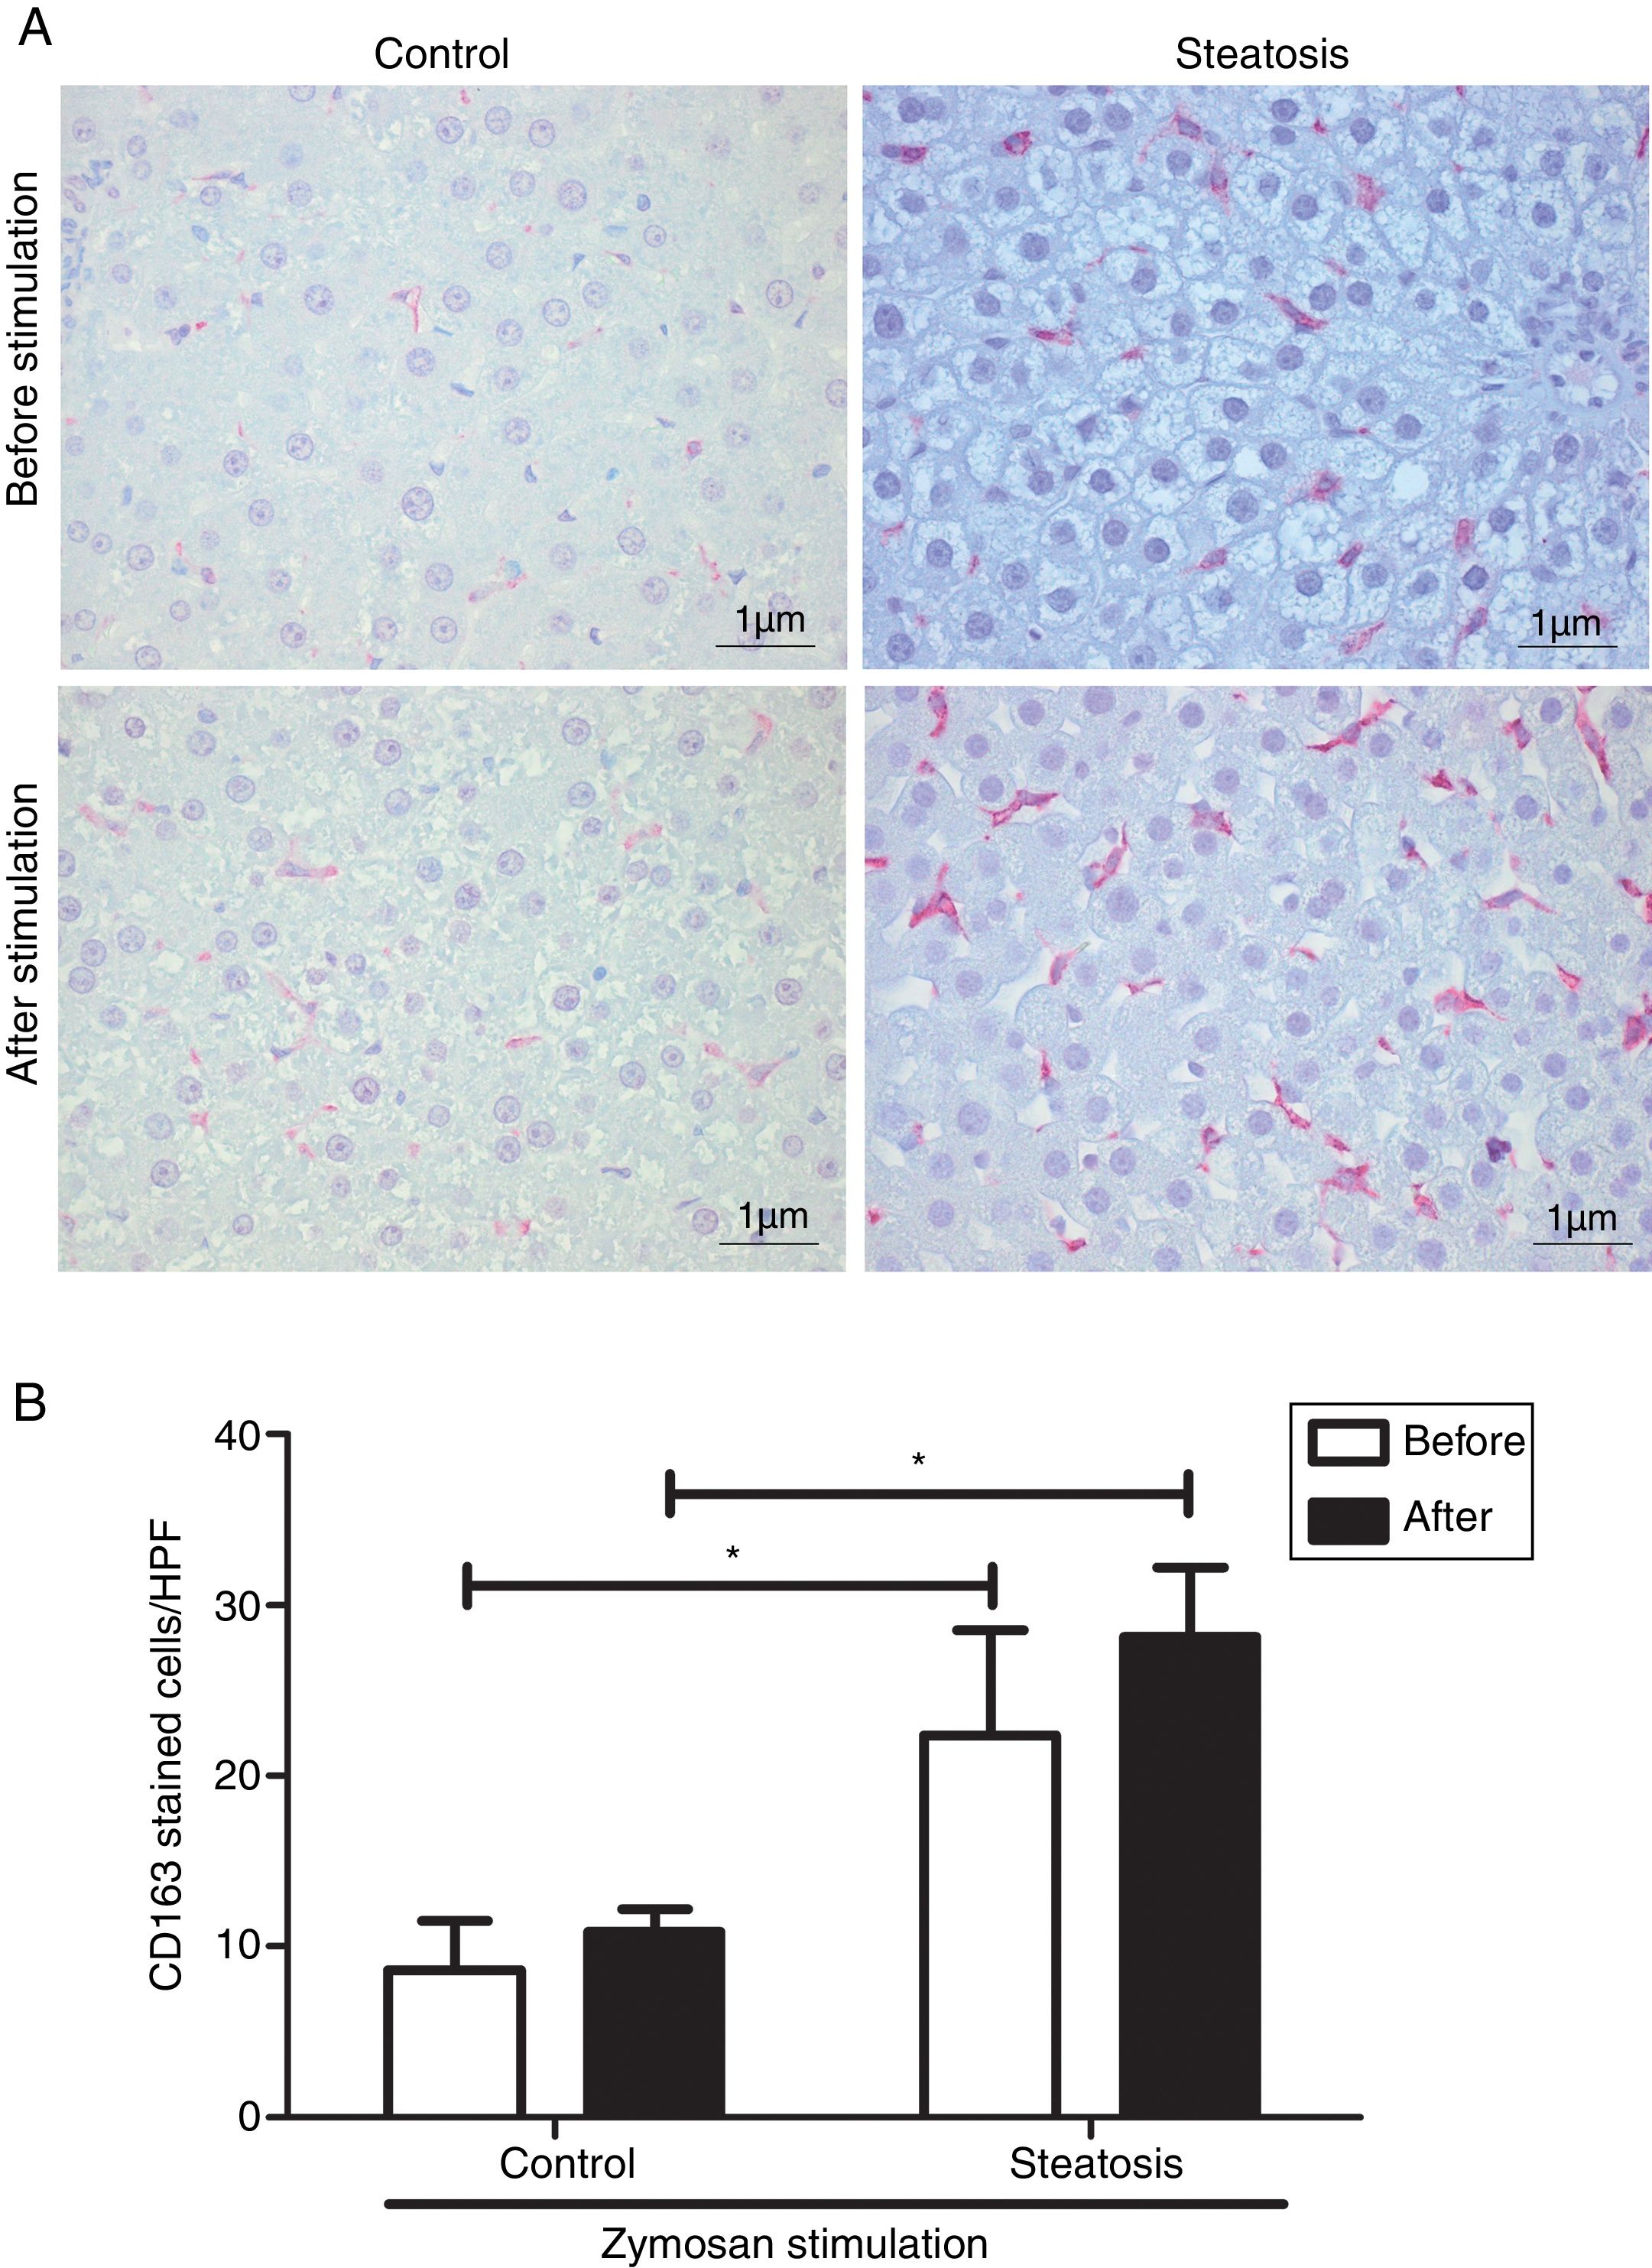
Number of KCs was induced by liver steatosis before and after Zymosan infusion (150μg/ml, 40–46min). IHC was performed to determine KC density. The steatosis group had more CD163 positive cells than the control group before and after the Zymosan stimulation (P<0.05). There is a slight increasing trend of CD163 positive cells after Zymosan stimulation in steatosis group, however no statistical significance gained (Fig. 4).
 The typical picture from five separate immunohistochemistry results in control and steatosis groups before and after infusion of Zymosan (150μg/ml). Red color represents CD163 positive (400× magnification). (B) Steatosis group had significantly more (*P<0.05) CD163 positive cells than control group every high power field (HPF) before and after stimulation. Data are expressed as mean±SD.")
Kupffer cell density before and after Zymosan infusion. (A) The typical picture from five separate immunohistochemistry results in control and steatosis groups before and after infusion of Zymosan (150μg/ml). Red color represents CD163 positive (400× magnification). (B) Steatosis group had significantly more (*P<0.05) CD163 positive cells than control group every high power field (HPF) before and after stimulation. Data are expressed as mean±SD.
To compare the response ability to TXA2 in these two groups, U46619 (the special analog of TXA2, 0.1μM/ml) was then infused into the portal vein of anesthetized rats from 40 to 46min after starting liver perfusion. U46619 significantly increased PP in both groups however, Pmax in control group (20.62±2.02cmH2O) was much lower than that in steatosis group (23.98±1.96cmH2O) (Fig. 5).
 from 40 to 46min after starting liver perfusion caused a significant increase of portal perfusion pressure in both control and steatosis groups (*P<0.05). Comparing between these two groups, basal portal perfusion pressure (Pmin) were almost the same while the maximal portal perfusion pressure (Pmax) was much higher in steatosis group (#P<0.05). n=5 in each group, data are expressed as mean±SD.")
Influence of U46619 on portal perfusion pressure. Infusion of U46619 (0.1μM/ml) from 40 to 46min after starting liver perfusion caused a significant increase of portal perfusion pressure in both control and steatosis groups (*P<0.05). Comparing between these two groups, basal portal perfusion pressure (Pmin) were almost the same while the maximal portal perfusion pressure (Pmax) was much higher in steatosis group (#P<0.05). n=5 in each group, data are expressed as mean±SD.
This study investigated the influences of hepatic steatosis on portal perfusion pressure (PP). There were three main findings in our study: (1) Severe steatosis induced more CD163 positive KCs than healthy livers. (2) Zymosan infusion caused lower PP increase and TXB2 efflux in steatosis group than in control group. (3) Fatty livers showed a more sensitive response to TXA2 analog resulting in a higher PP increase following U46619 stimulation. These results were obtained using in situ perfused rat livers from control and steatosis groups. The diagnosis of hepatic steatosis was based on changes in liver histology (Fig. 1, Table 1).
The initial set of experiments showed that rat livers from steatosis group had much more severe steatosis than control group. Despite more severe inflammation in steatosis group, Pmin and basal TXB2 values in steatosis group were almost the same as control group, Pmax and maximal TXB2 values after Zymosan infusion were even much lower in steatosis group (Fig. 2). Since the correlation between PP and inflammation has been well proved,19 we hypothesized that severe steatosis may influence the total number or function of KCs.
CD163 is exclusively expressed on monocytes and common used to identify macrophages in tissue sections.20 Elevated CD163 expression was suggested to be associated with unfavorable clinicopathological features and prognosis in patients. There was a significant association between the numbers of CD163 positive cells and the severity of fibrosis, tumor stages, and survival patients.21 In our experiment, nearly double CD163 positive cells were found in steatosis group before and after Zymosan infusion (Fig. 4), supporting the relation between severe steatosis and CD163 expression. Previous studies reported Zymosan to induce KCs in rat livers.22 A slight increasing trend was observed in steatosis group after Zymosan stimulation, but no significant difference was found. That may due to the short stimulating and observing time in our experiments. A low dose of an anti-CD163-IgG-dexamethasone strongly reduced inflammation and hepatocyte ballooning in a rat model.23 Thus, drugs targeting CD163 seems to be a promising therapy to severe steatosis.
The total duration of perfusion experiment in our research is nearly 1h and Zymosan was added from 40 to 46min after the start of perfusion. Several minutes of stimulation by Zymosan infusion caused a rapid and transient PP and TXB2 increase (Fig. 3), which is in accordance with previous studies.24 Additionally, we previously proved that TXA2 receptor antagonist reduced PP increase both in vivo and in isolated rat liver perfusion, supporting TXA2 as vital factor in zymosan induced PP increase.7 As a result, the lower PP increase in steatosis group after Zymosan infusion in the present study might be related to decreased TXB2 secretion. Besides TXA2, PP increase may also be affected by other mechanisms like reduced NO production. However, NO was proved to be not related to the early mechanisms of alcohol induced portal pressure increase.25 To rule out whether steatosis affects NO and other mechanisms after Zymosan infusion further models and experiments are needed.
However, numerous studies demonstrated the association between severe steatosis and portal hypertension, one clinical study with fifty consecutive patients found the degree of steatosis was the only independent predictor of the presence of portal hypertension.26 We further investigated the influence of steatosis on contractile cells with TXA2 analog. Higher Pmax and increased value were found in steatosis group following U46619 infusion (Fig. 5), these results were in opposite with those by Zymosan (Fig. 2). Thus, the enhanced responses to TXA2 caused by severe steatosis might play pivotal role on the procedure of portal hypertension. U46619 is supposed to act on primary HSCs from rats while primary KCs and sinusoidal endothelial cells failed to release vasoactive substance following U46619 stimulation.27 High-affinity TXA2 receptors and a specific binding site for TXA2 analog were also found on HSCs.28 The relationship between HSC activation and steatosis has been recognized and proved in recent years. HSC activation is the common pathogenic mechanism of both alcoholic steatohepatitis (ASH) and nonalcoholic steatohepatitis (NASH). HSCs are quiescent in normal livers, however, with the stimulating effect of ASH or NASH, quiescent HSCs become transdifferentiated to myofibroblastic state.29 A comparison of electronic microscopy between patients with fatty and healthy livers showed a more severe fat droplets distribution in HSCs in fatty liver.30 Thus, HSC activation by severe steatosis could explain the augmented response to TXA2 analog in steatosis group in this experiment.
ConclusionsZymosan and U46619 caused different effects of PP increase in healthy and fatty livers: Zymosan induced higher PP increase in healthy livers in contrast to U46619, while U46619 was more effective in fatty livers. The more sensitive response of fatty liver to TXA2 may be a therapeutic target for steatosis.
Authorship statementJiang Zhang research design, performance of the research, data analysis, writing of the manuscript.
Julia Schewe research design, performance of the research, data analysis, writing of the manuscript
Hanwei Li performance of the research, data analysis.
Marie-Christine Makeschin performance of the research, data analysis.
Ujjwal M. Mahajan performance of the research, data analysis.
Alexander L. Gerbes research design, writing of the manuscript.
Christian J. Steib research design, performance of the research, data analysis, writing of the manuscript.
Conflicts of interestThe authors declare no conflicts of interest.
The authors thank Natalie Leistner, Ingrid Liss, and Christoph v. Hesler for their excellent technical assistance.
This study was supported by grants from the Deutsche Forschungsgemeinschaft (DFG STE 1022/2-3 and DFG STE 1022/4-1) and China Scholarship Council (CSC).