


Retrospective studies suggest that coronavirus disease (COVID-19) commonly involves gastrointestinal (GI) symptoms and complications. Our aim was to prospectively evaluate GI manifestations in patients hospitalized for COVID-19.
MethodsThis international multicentre prospective cohort study recruited COVID-19 patients hospitalized at 31 centres in Spain, Mexico, Chile, and Poland, between May and September 2020. Patients were followed-up until 15 days post-discharge and completed comprehensive questionnaires assessing GI symptoms and complications. A descriptive analysis as well as a bivariate and multivariate analysis were performer using binary logistic regression. p<0.05 was considered significant.
ResultsEight hundred twenty-nine patients were enrolled; 129 (15.6%) had severe COVID-19, 113 (13.7%) required ICU admission, and 43 (5.2%) died. Upon admission, the most prevalent GI symptoms were anorexia (n=413; 49.8%), diarrhoea (n=327; 39.4%), nausea/vomiting (n=227; 27.4%), and abdominal pain (n=172; 20.7%), which were mild/moderate throughout the disease and resolved during follow-up. One-third of patients exhibited liver injury. Non-severe COVID-19 was associated with ≥2 GI symptoms upon admission (OR 0.679; 95% CI 0.464–0.995; p=0.046) or diarrhoea during hospitalization (OR 0.531; 95% CI 0.328–0.860; p=0.009). Multivariate analysis revealed that worse hospital outcomes were not independently associated with liver injury or GI symptoms.
ConclusionGI symptoms were more common than previously documented, and were mild, rapidly resolved, and not independently associated with COVID-19 severity. Liver injury was a frequent complication in hospitalized patients not independently associated with COVID-19 severity.
Estudios retrospectivos evidencian que la enfermedad por coronavirus (COVID-19) conlleva síntomas y complicaciones gastrointestinales (GI). Nuestro objetivo fue evaluar prospectivamente las manifestaciones GI de pacientes hospitalizados por COVID-19.
MétodosEstudio internacional, multicéntrico, de cohorte, prospectivo, que seleccionó a pacientes con COVID-19 en 31 centros de España, México, Chile y Polonia, entre mayo-septiembre de 2020. Los pacientes fueron seguidos hasta 15 días tras el alta y completaron cuestionarios que evaluaban los síntomas y complicaciones GI. Se realizó un análisis descriptivo, bivariante y multivariante de los resultados. Se consideró significativa p<0,05.
ResultadosSe incluyeron 829 pacientes; 129 (15,6%) presentaron COVID-19 grave, 113 (13,7%) requirieron ingreso en UCI y 43 (5,2%) fallecieron. Al ingreso, los síntomas GI más prevalentes fueron anorexia (n=413; 49,8%), diarrea (n=327; 39,4%), náuseas/vómitos (n=227; 27,4%) y dolor abdominal (n=172; 20,7%), que resultaron de intensidad leve/moderada y se resolvieron durante el seguimiento. Un tercio de los pacientes presentaron daño hepático. La COVID-19 no grave se asoció con la presencia de ≥2 síntomas GI al ingreso (OR 0,679; IC 95%: 0,464-0,995; p=0,046) y/o diarrea durante la hospitalización (OR 0,531; IC 95%: 0,328-0,860; p=0,009). El análisis multivariante reveló que los peores resultados hospitalarios no se asociaron de forma independiente con el daño hepático o los síntomas GI.
ConclusiónLos síntomas GI fueron más frecuentes de lo que se había documentado, resultaron leves, se resolvieron rápidamente y no se asociaron de forma independiente con COVID-19 grave. El daño hepático fue una complicación frecuente en los pacientes hospitalizados que no se asoció de forma independiente con COVID-19 grave.
The initial reports describing COVID-19 disease highlighted respiratory symptoms, fever, and severe acute respiratory syndrome (SARS).1,2 However, further several published retrospective studies and systematic reviews suggest that infected patients commonly exhibit GI symptoms, like diarrhoea, nausea, emesis, abdominal pain, and less specific symptoms, such as anorexia.2–5 The virus can penetrate and infect epithelial gastrointestinal (GI) cells due to their surface expression of angiotensin-converting enzyme 2 (ACE2) receptors and the transmembrane protease serine 2 (TMPRSS2) used for S protein priming.6 Moreover, this explains the detection of virus RNA in faecal samples, and potential changes in GI flora.7,8
Although GI symptoms are recognized within the spectrum of COVID-19 manifestations, the described frequency has widely varied, ranging from 3 to 50%.3–5 Unfortunately, most of published studies are retrospective and have not evaluated the baseline pre-COVID-19 presence of GI symptoms. Moreover, virtually no prospective data are available describing the patient-assessed symptom intensity or their evolution throughout the disease.
Regarding GI complications, liver damage has been reported in approximately 15–35% of patients with COVID-19, especially in critically ill patients.3–5,9 The mechanism underlying this liver damage has not been defined, although a multifactorial origin is postulated, which includes cytopathic effects of the virus, drug-related hepatotoxicity, immune-mediated liver damage, and critical involvement of the patient's liver.10 Other possible GI complications of COVID-19 include acute pancreatitis,11 new-onset inflammatory bowel disease,12 and digestive ischaemic conditions secondary to endotheliitis, hypercoagulability, and systemic inflammation,13,14 such as ischaemic colitis15 or gangrenous cholecystitis.16 However, it is difficult to establish a causal relationship due to biases associated with retrospective studies and the low incidence rates of these complications in the epidemiological context of high COVID-19 occurrence.17
In this international, multicentre, prospective cohort study, we aimed to describe the frequency, intensity, evolution, and impact of digestive symptoms and complications, during hospitalization and after discharge, in patients with COVID-19.
MethodsThe prospecTIVe evalUation of gastROintestinal maNifestations of COVID-19 (TIVURON) project was an international, multicentre, prospective, cohort study, developed with the auspice of the Spanish Association of Gastroenterology (AEG). This study was conducted through the collaboration of 31 centres from Spain, Mexico, Chile, and Poland. Patients were recruited from May to September of 2020. The study was approved on May 6th of 2020 (reference PI2020-068) by the central Institutional Review Board (IRB) (Dr. Balmis General University Hospital CEiM, Alicante, Spain), and subsequently by the IRB of each participating centre. Informed consent from patients was required. The STROBE guidelines were followed.
Study end-pointsThe primary outcome was the prevalence and intensity of GI symptoms and complications in patients hospitalized with COVID-19, as well as their evolution throughout the disease. Secondary outcomes included the associations of GI symptoms and complications with COVID-19 severity and hospital outcomes (hospital stay, need for ICU admission, and mortality).
Patient selectionInclusion criteria were age ≥18, positive polymerase chain reaction (PCR) test for SARS-CoV-2 in any biological sample, hospital admission, and informed consent to participate in the study. Exclusion criteria were hospital admission due to a non-gastrointestinal disease clearly not related to COVID-19 (e.g., a hip fracture) with a subsequent diagnosis of COVID-19, acute active digestive disease clearly independent of COVID-19 (e.g., choledocholithiasis), acute outbreak of chronic inflammatory digestive disease (e.g., exacerbated chronic pancreatitis) with no apparent relationship to COVID-19, pre-existing digestive or non-digestive active neoplastic disease with abdominal or pelvic involvement, previous admission for COVID-19, or patients recruitment over 72h after admission.
Gastrointestinal symptoms selectionBased on a previously published patient-reported outcome scale,18 a survey was conducted among all collaborating researchers to assess the appropriateness of symptoms to be included in the study, using a numerical scale of 0–10, with 0 indicating no appropriateness, and 10 maximum appropriateness. The mean value for each symptom was calculated, and selected those with an average score of ≥5. Finally, the following nine symptoms were chosen: abdominal pain, gas/bloating/flatulence, diarrhoea, constipation, heartburn/gastroesophageal reflux, nausea/vomiting, hyporexia/anorexia, odynophagia, and dysphagia.
Data acquisition and definitionsInformation regarding demographic features (including sex, understood as biological sex); toxic habits; previous comorbidities; chronic treatments; pre-COVID-19 GI symptoms; complications; analytical, radiological, and endoscopic data during admission; specific COVID-19 treatments; ventilatory support; mortality; and hospital stay, were collected. Data were prospectively acquired by researchers involved in direct patient management. Comprehensive symptom questionnaires were completed at different times throughout the disease course. A questionnaire administered at admission asked about GI symptoms at baseline (before COVID-19), and specifically at the time of admission. A questionnaire administered at discharge asked about the presence and higher intensity of GI symptoms during hospitalization, and specifically at the time of discharge. A final interview was performed at 15 days after discharge by phone call, asking about the presence and higher intensity of GI symptoms from discharge to the end of follow-up, and specifically at the time of interview.
The intensity of GI symptoms was defined as mild, moderate, or severe according to the patient's perception. Severe COVID-19 was defined as requiring ICU admission, requiring mechanical ventilation, and/or causing mortality during hospitalization, as previously reported by Colmenero et al.19 The GI complications evaluated during COVID-19 hospitalization and convalescence included esophagitis, oesophageal-gastric-duodenal ulcers, gastritis, duodenitis, acute pancreatitis, acute liver injury, acute liver failure, cholecystitis, cholangitis, enteritis, colitis, and upper or lower gastrointestinal bleeding. Definitions are presented in supplementary content 1.
Sample sizeAs retrospective reports suggested a high incidence of GI symptoms and complications among COVID-19 patients, here we aimed to provide exploratory high-quality data. However, this observational descriptive study was performed under exceptional circumstances, with a global pandemic collapsing hospital care. Therefore, we did not perform a sample size calculation based on expectations of finding statistically significant differences. Rather, the final sample size depended on the capacities of the centres involved and the time-frame established for data collection.
Statistical analysisStatistical analyses were performed using IBM-SPSS V 25.0 software (IBM, Armonk, NY, USA). Quantitative variables are expressed as mean and standard deviation (SD) or median and interquartile range (IQR), and qualitative variables as number and percentage. Normality was assessed using the Shapiro–Wilk test. Quantitative variables were compared with qualitative variables using Student's t-test and the Mann–Whitney U-test for two categories, or using ANOVA and Kruskal–Wallis tests for over two categories. Qualitative variables were compared using the Chi-square test or Fisher's exact test if needed.
The Wilcoxon signed-rank test with continuity correction was used to make pairwise comparisons for each GI symptom at the five evaluated time-points, determining the difference compared to baseline GI symptoms (before COVID-19). Multivariate analysis was performed with binary logistic regression. Prevalence, odds ratio (OR), and adjusted odds ratio (aOR) with 95% confidence intervals (CIs) were calculated as measures of the frequency and strength of association. The Nagelkerke R2 statistic was calculated to assess the proportion of variance of the dependent variable explained by the model. For bivariate and multivariate models, GI symptoms during hospitalization were considered with adjustment according to baseline (before COVID-19), with the analysis excluding patients who presented the GI symptom before COVID-19. The multivariate models included the patients’ baseline characteristics, Charlson Comorbidity Index adjusted by age, GI and non-GI symptoms, GI complications, Sepsis-related organ failure assessment (SOFA) score, and C-reactive protein (CRP) level as a marker of systemic inflammation. A p-value of <0.05 was considered statistically significant.
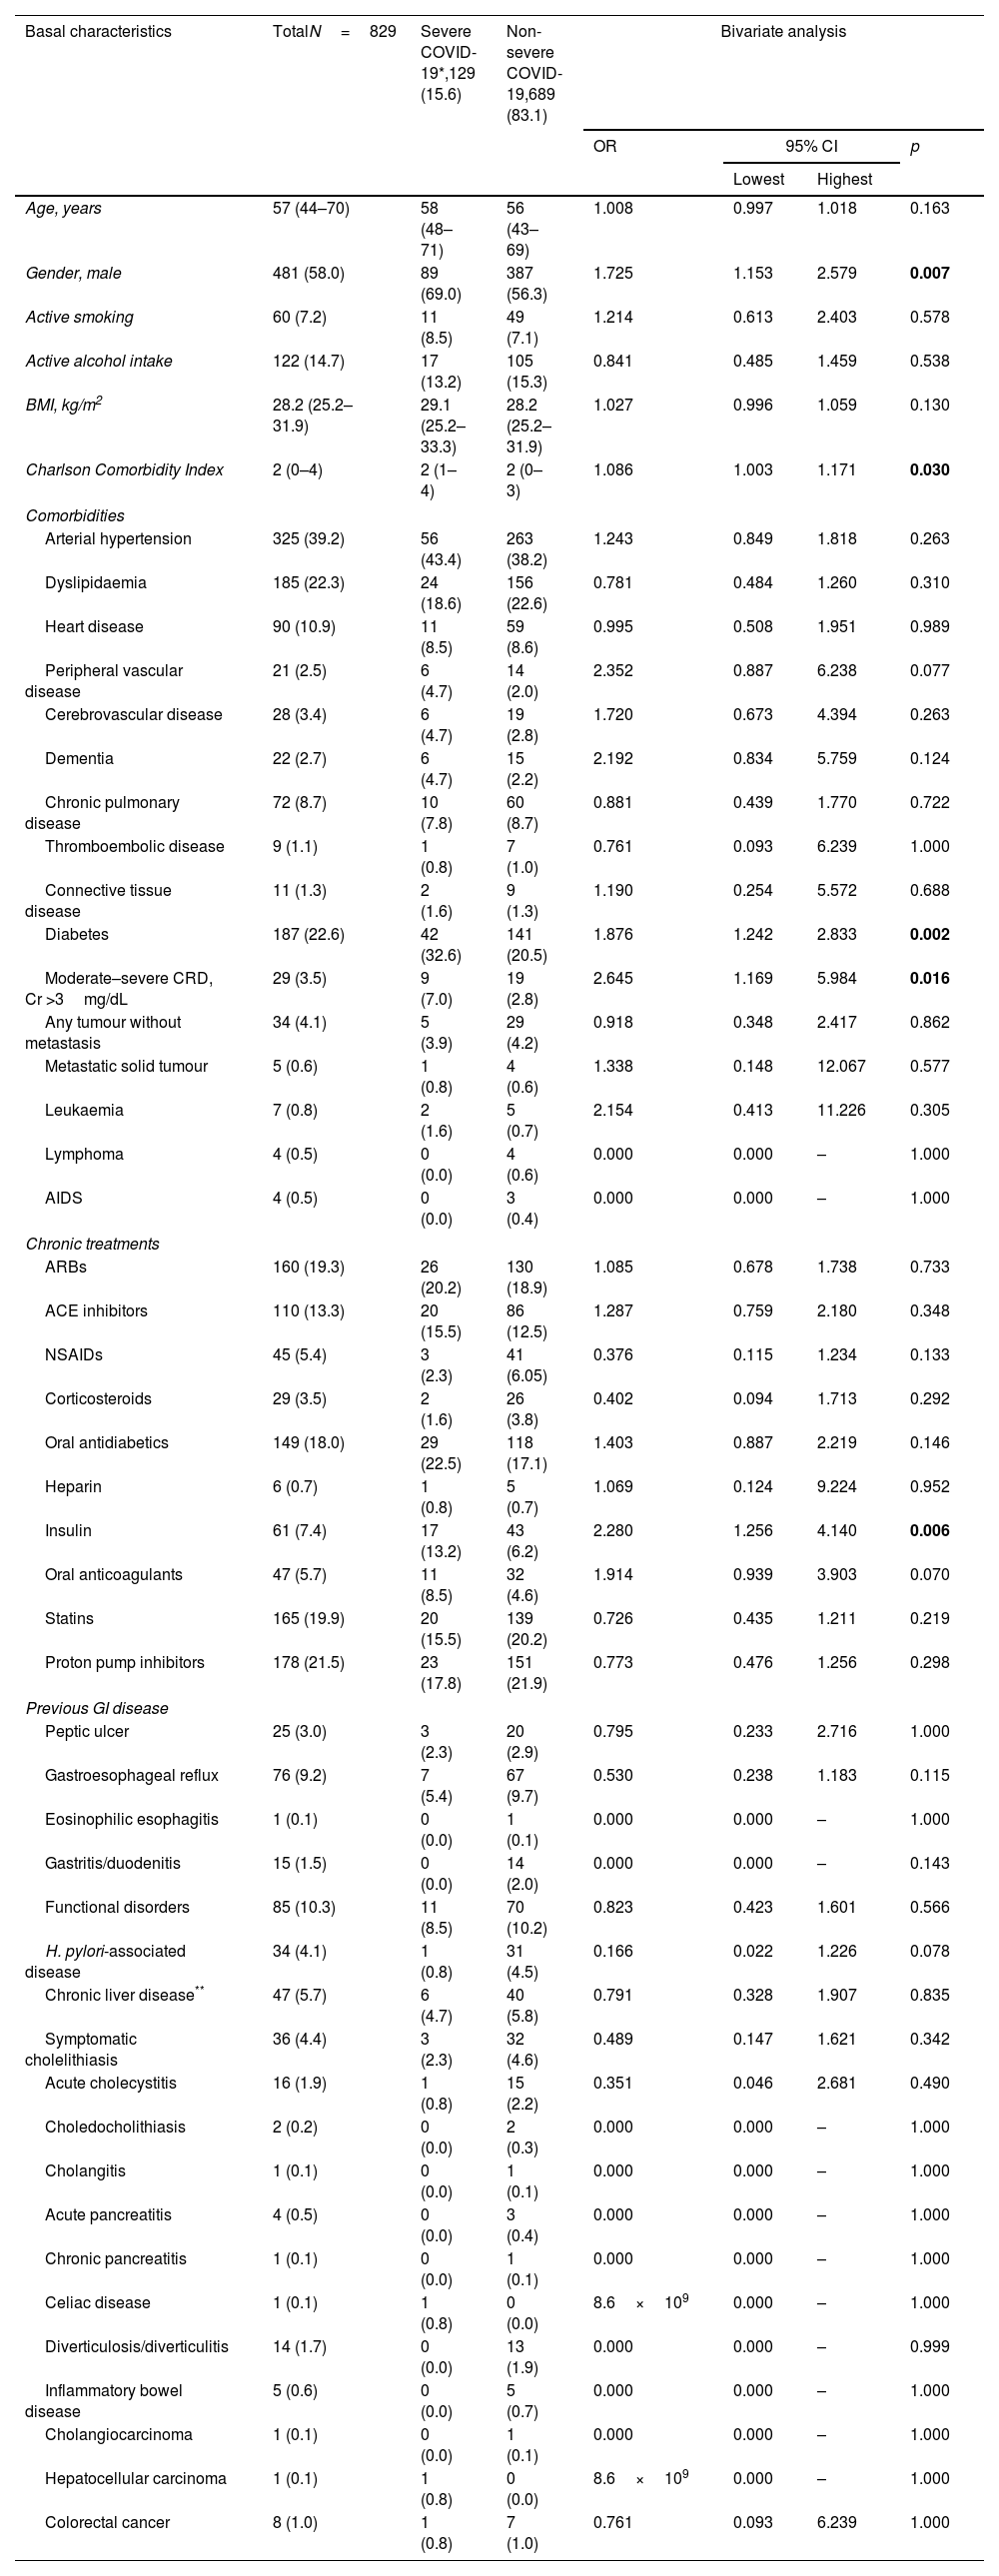
ResultsThis study enrolled a total of 829 hospitalized patients, including 486 (58.6%) from Spain, 203 (24.5%) from Mexico, 97 (11.7%) from Chile, and 43 (5.2%) from Poland. The median age was 57 years (IQR 44–70 years), 481 (58.0%) were male, and the median Charlson Comorbidity Index adjusted per age was 2 points (IQR 0–4 points). Table 1 shows the patients’ baseline characteristics. Male gender, Charlson score, diabetes, and moderate-to-severe chronic renal disease were associated with severe COVID-19. The median time from symptom onset to admission was 7 days (IQR 4–10 days), and the median hospitalization length was 8 days (IQR 5–12 days). A total of 129 (15.6%) patients had severe COVID-19, 113 (13.7%) required ICU admission after a median of 1 day (IQR 0–3 days), 64 (7.7%) required orotracheal intubation, and 43 (5.2%) died.
Basal characteristics and differences between severe and non-severe COVID-19, bivariate analysis.
| Basal characteristics | TotalN=829 | Severe COVID-19*,129 (15.6) | Non-severe COVID-19,689 (83.1) | Bivariate analysis | |||
|---|---|---|---|---|---|---|---|
| OR | 95% CI | p | |||||
| Lowest | Highest | ||||||
| Age, years | 57 (44–70) | 58 (48–71) | 56 (43–69) | 1.008 | 0.997 | 1.018 | 0.163 |
| Gender, male | 481 (58.0) | 89 (69.0) | 387 (56.3) | 1.725 | 1.153 | 2.579 | 0.007 |
| Active smoking | 60 (7.2) | 11 (8.5) | 49 (7.1) | 1.214 | 0.613 | 2.403 | 0.578 |
| Active alcohol intake | 122 (14.7) | 17 (13.2) | 105 (15.3) | 0.841 | 0.485 | 1.459 | 0.538 |
| BMI, kg/m2 | 28.2 (25.2–31.9) | 29.1 (25.2–33.3) | 28.2 (25.2–31.9) | 1.027 | 0.996 | 1.059 | 0.130 |
| Charlson Comorbidity Index | 2 (0–4) | 2 (1–4) | 2 (0–3) | 1.086 | 1.003 | 1.171 | 0.030 |
| Comorbidities | |||||||
| Arterial hypertension | 325 (39.2) | 56 (43.4) | 263 (38.2) | 1.243 | 0.849 | 1.818 | 0.263 |
| Dyslipidaemia | 185 (22.3) | 24 (18.6) | 156 (22.6) | 0.781 | 0.484 | 1.260 | 0.310 |
| Heart disease | 90 (10.9) | 11 (8.5) | 59 (8.6) | 0.995 | 0.508 | 1.951 | 0.989 |
| Peripheral vascular disease | 21 (2.5) | 6 (4.7) | 14 (2.0) | 2.352 | 0.887 | 6.238 | 0.077 |
| Cerebrovascular disease | 28 (3.4) | 6 (4.7) | 19 (2.8) | 1.720 | 0.673 | 4.394 | 0.263 |
| Dementia | 22 (2.7) | 6 (4.7) | 15 (2.2) | 2.192 | 0.834 | 5.759 | 0.124 |
| Chronic pulmonary disease | 72 (8.7) | 10 (7.8) | 60 (8.7) | 0.881 | 0.439 | 1.770 | 0.722 |
| Thromboembolic disease | 9 (1.1) | 1 (0.8) | 7 (1.0) | 0.761 | 0.093 | 6.239 | 1.000 |
| Connective tissue disease | 11 (1.3) | 2 (1.6) | 9 (1.3) | 1.190 | 0.254 | 5.572 | 0.688 |
| Diabetes | 187 (22.6) | 42 (32.6) | 141 (20.5) | 1.876 | 1.242 | 2.833 | 0.002 |
| Moderate–severe CRD, Cr >3mg/dL | 29 (3.5) | 9 (7.0) | 19 (2.8) | 2.645 | 1.169 | 5.984 | 0.016 |
| Any tumour without metastasis | 34 (4.1) | 5 (3.9) | 29 (4.2) | 0.918 | 0.348 | 2.417 | 0.862 |
| Metastatic solid tumour | 5 (0.6) | 1 (0.8) | 4 (0.6) | 1.338 | 0.148 | 12.067 | 0.577 |
| Leukaemia | 7 (0.8) | 2 (1.6) | 5 (0.7) | 2.154 | 0.413 | 11.226 | 0.305 |
| Lymphoma | 4 (0.5) | 0 (0.0) | 4 (0.6) | 0.000 | 0.000 | – | 1.000 |
| AIDS | 4 (0.5) | 0 (0.0) | 3 (0.4) | 0.000 | 0.000 | – | 1.000 |
| Chronic treatments | |||||||
| ARBs | 160 (19.3) | 26 (20.2) | 130 (18.9) | 1.085 | 0.678 | 1.738 | 0.733 |
| ACE inhibitors | 110 (13.3) | 20 (15.5) | 86 (12.5) | 1.287 | 0.759 | 2.180 | 0.348 |
| NSAIDs | 45 (5.4) | 3 (2.3) | 41 (6.05) | 0.376 | 0.115 | 1.234 | 0.133 |
| Corticosteroids | 29 (3.5) | 2 (1.6) | 26 (3.8) | 0.402 | 0.094 | 1.713 | 0.292 |
| Oral antidiabetics | 149 (18.0) | 29 (22.5) | 118 (17.1) | 1.403 | 0.887 | 2.219 | 0.146 |
| Heparin | 6 (0.7) | 1 (0.8) | 5 (0.7) | 1.069 | 0.124 | 9.224 | 0.952 |
| Insulin | 61 (7.4) | 17 (13.2) | 43 (6.2) | 2.280 | 1.256 | 4.140 | 0.006 |
| Oral anticoagulants | 47 (5.7) | 11 (8.5) | 32 (4.6) | 1.914 | 0.939 | 3.903 | 0.070 |
| Statins | 165 (19.9) | 20 (15.5) | 139 (20.2) | 0.726 | 0.435 | 1.211 | 0.219 |
| Proton pump inhibitors | 178 (21.5) | 23 (17.8) | 151 (21.9) | 0.773 | 0.476 | 1.256 | 0.298 |
| Previous GI disease | |||||||
| Peptic ulcer | 25 (3.0) | 3 (2.3) | 20 (2.9) | 0.795 | 0.233 | 2.716 | 1.000 |
| Gastroesophageal reflux | 76 (9.2) | 7 (5.4) | 67 (9.7) | 0.530 | 0.238 | 1.183 | 0.115 |
| Eosinophilic esophagitis | 1 (0.1) | 0 (0.0) | 1 (0.1) | 0.000 | 0.000 | – | 1.000 |
| Gastritis/duodenitis | 15 (1.5) | 0 (0.0) | 14 (2.0) | 0.000 | 0.000 | – | 0.143 |
| Functional disorders | 85 (10.3) | 11 (8.5) | 70 (10.2) | 0.823 | 0.423 | 1.601 | 0.566 |
| H. pylori-associated disease | 34 (4.1) | 1 (0.8) | 31 (4.5) | 0.166 | 0.022 | 1.226 | 0.078 |
| Chronic liver disease** | 47 (5.7) | 6 (4.7) | 40 (5.8) | 0.791 | 0.328 | 1.907 | 0.835 |
| Symptomatic cholelithiasis | 36 (4.4) | 3 (2.3) | 32 (4.6) | 0.489 | 0.147 | 1.621 | 0.342 |
| Acute cholecystitis | 16 (1.9) | 1 (0.8) | 15 (2.2) | 0.351 | 0.046 | 2.681 | 0.490 |
| Choledocholithiasis | 2 (0.2) | 0 (0.0) | 2 (0.3) | 0.000 | 0.000 | – | 1.000 |
| Cholangitis | 1 (0.1) | 0 (0.0) | 1 (0.1) | 0.000 | 0.000 | – | 1.000 |
| Acute pancreatitis | 4 (0.5) | 0 (0.0) | 3 (0.4) | 0.000 | 0.000 | – | 1.000 |
| Chronic pancreatitis | 1 (0.1) | 0 (0.0) | 1 (0.1) | 0.000 | 0.000 | – | 1.000 |
| Celiac disease | 1 (0.1) | 1 (0.8) | 0 (0.0) | 8.6×10⁹ | 0.000 | – | 1.000 |
| Diverticulosis/diverticulitis | 14 (1.7) | 0 (0.0) | 13 (1.9) | 0.000 | 0.000 | – | 0.999 |
| Inflammatory bowel disease | 5 (0.6) | 0 (0.0) | 5 (0.7) | 0.000 | 0.000 | – | 1.000 |
| Cholangiocarcinoma | 1 (0.1) | 0 (0.0) | 1 (0.1) | 0.000 | 0.000 | – | 1.000 |
| Hepatocellular carcinoma | 1 (0.1) | 1 (0.8) | 0 (0.0) | 8.6×10⁹ | 0.000 | – | 1.000 |
| Colorectal cancer | 8 (1.0) | 1 (0.8) | 7 (1.0) | 0.761 | 0.093 | 6.239 | 1.000 |
The values in bold are those results that have reached statistical significance (p < 0.05).
Data were missing or unavailable for 11 patients that could not be classified as having severe or non-severe COVID-19.
Qualitative variables expressed as absolute number (%). Quantitative variables expressed as mean and standard deviation (SD) or median and interquartile range (IQR). ACE inhibitors: angiotensin-converting enzyme inhibitors; AIDS: acquired immunodeficiency syndrome; ARBs: angiotensin II receptor blockers; BMI: body mass index; CI: confidence intervals; Cr: creatinine; CRD: chronic renal disease; H. pylori: Helicobacter pylori; IQR: interquartile range; NSAIDs: non-steroidal anti-inflammatory drugs; OR: odds ratio.
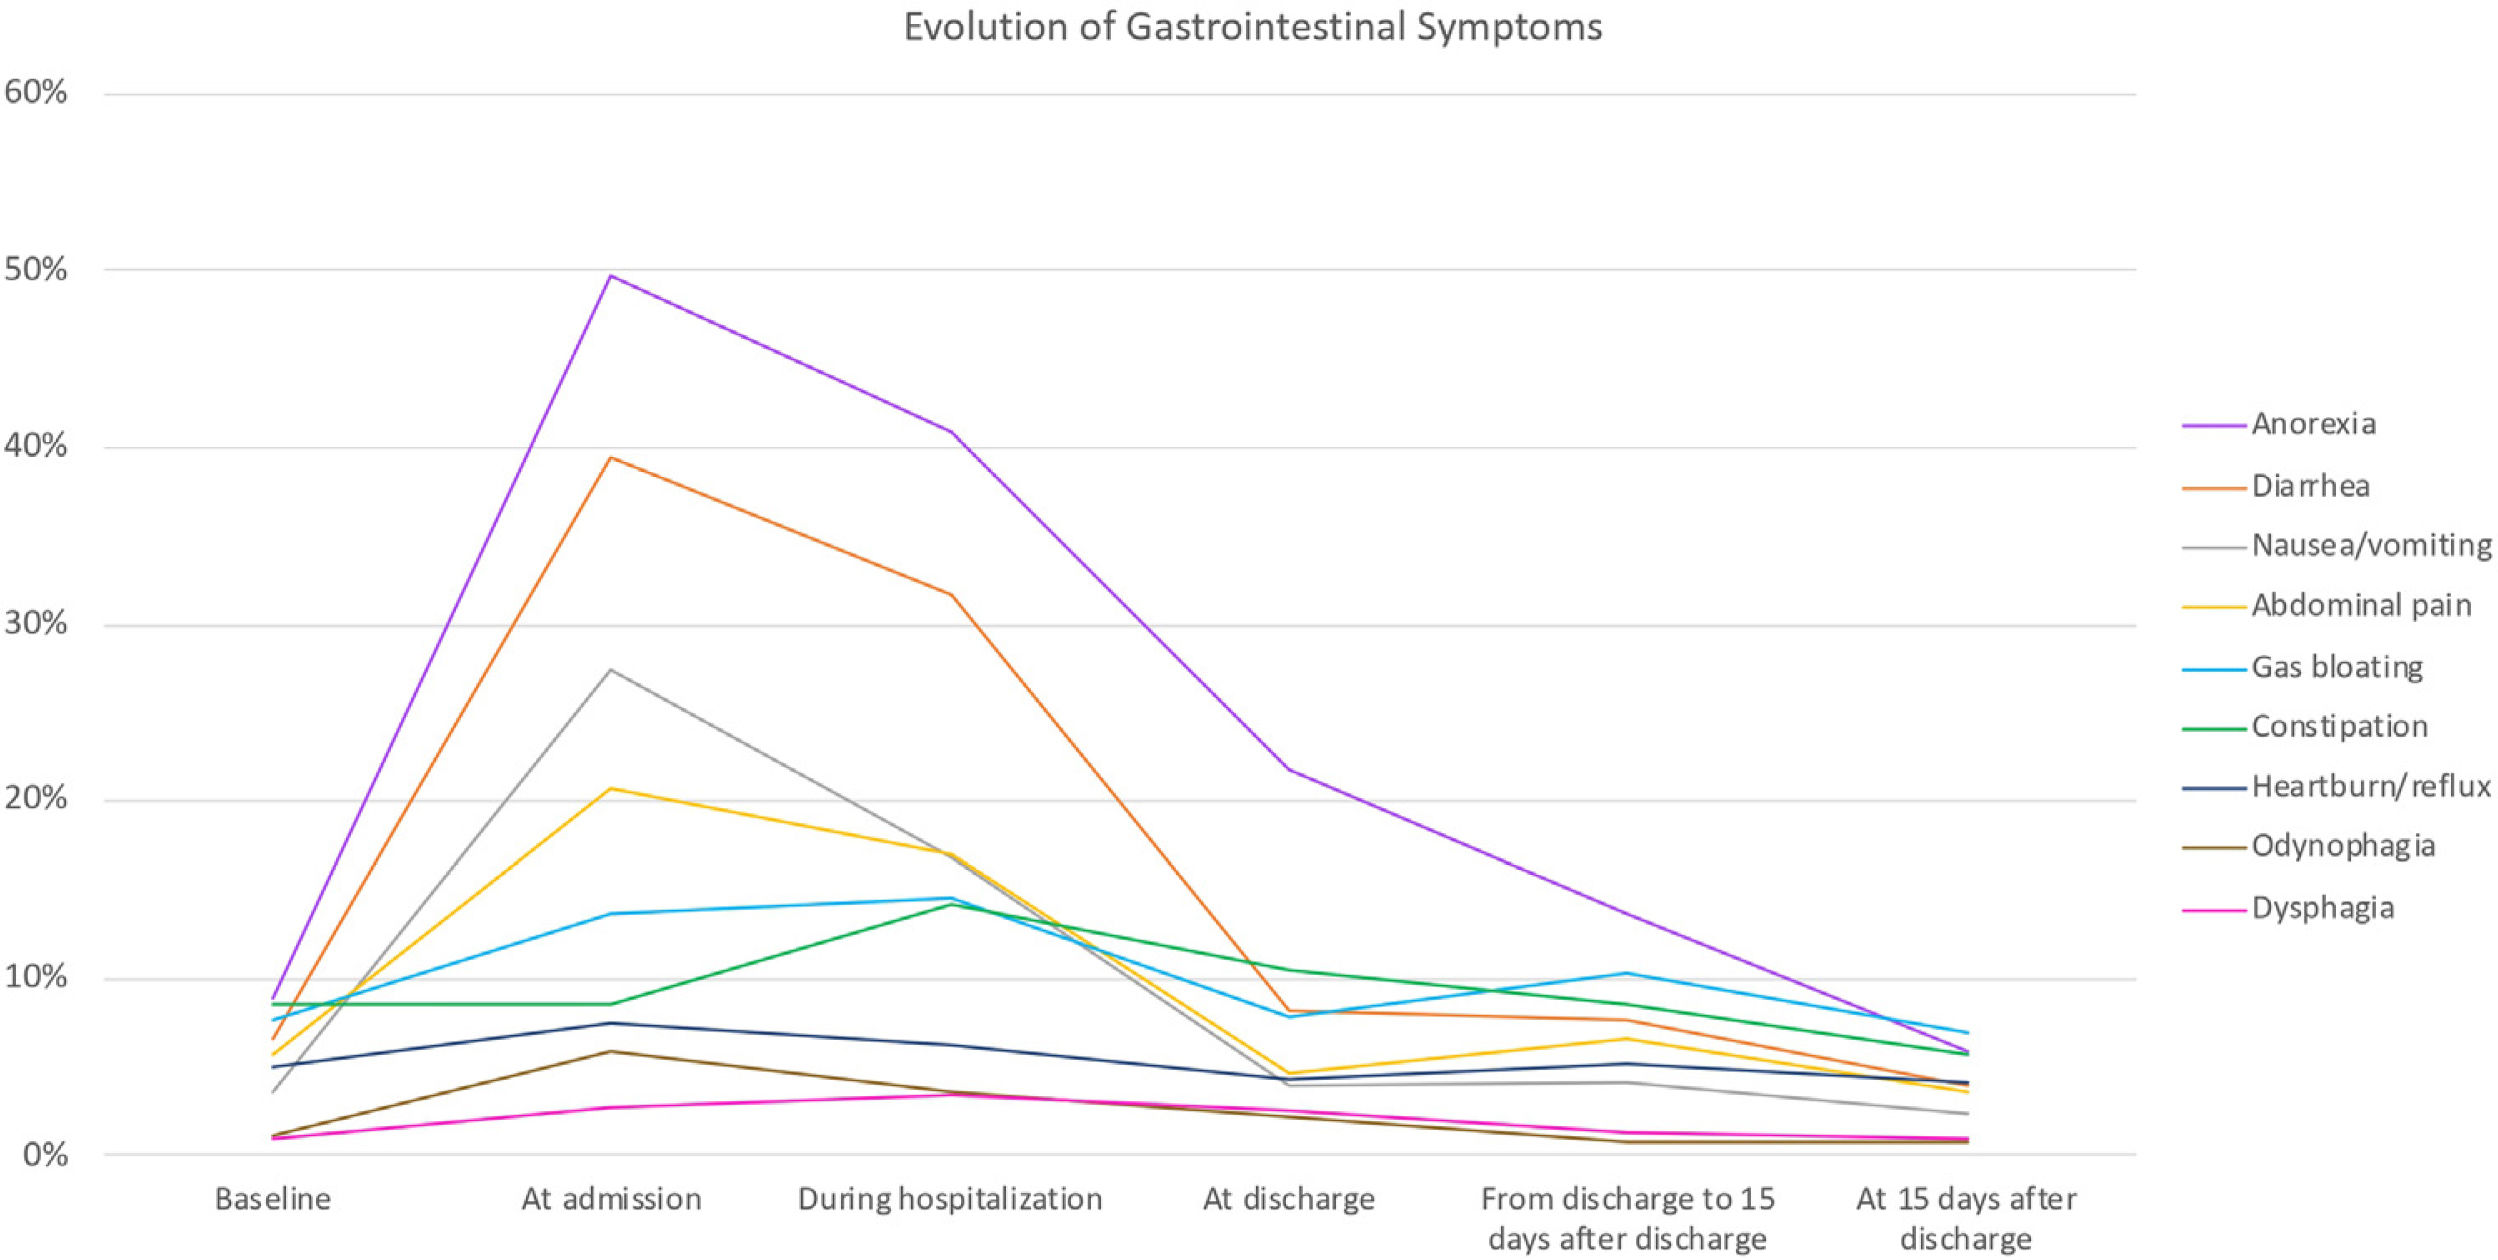
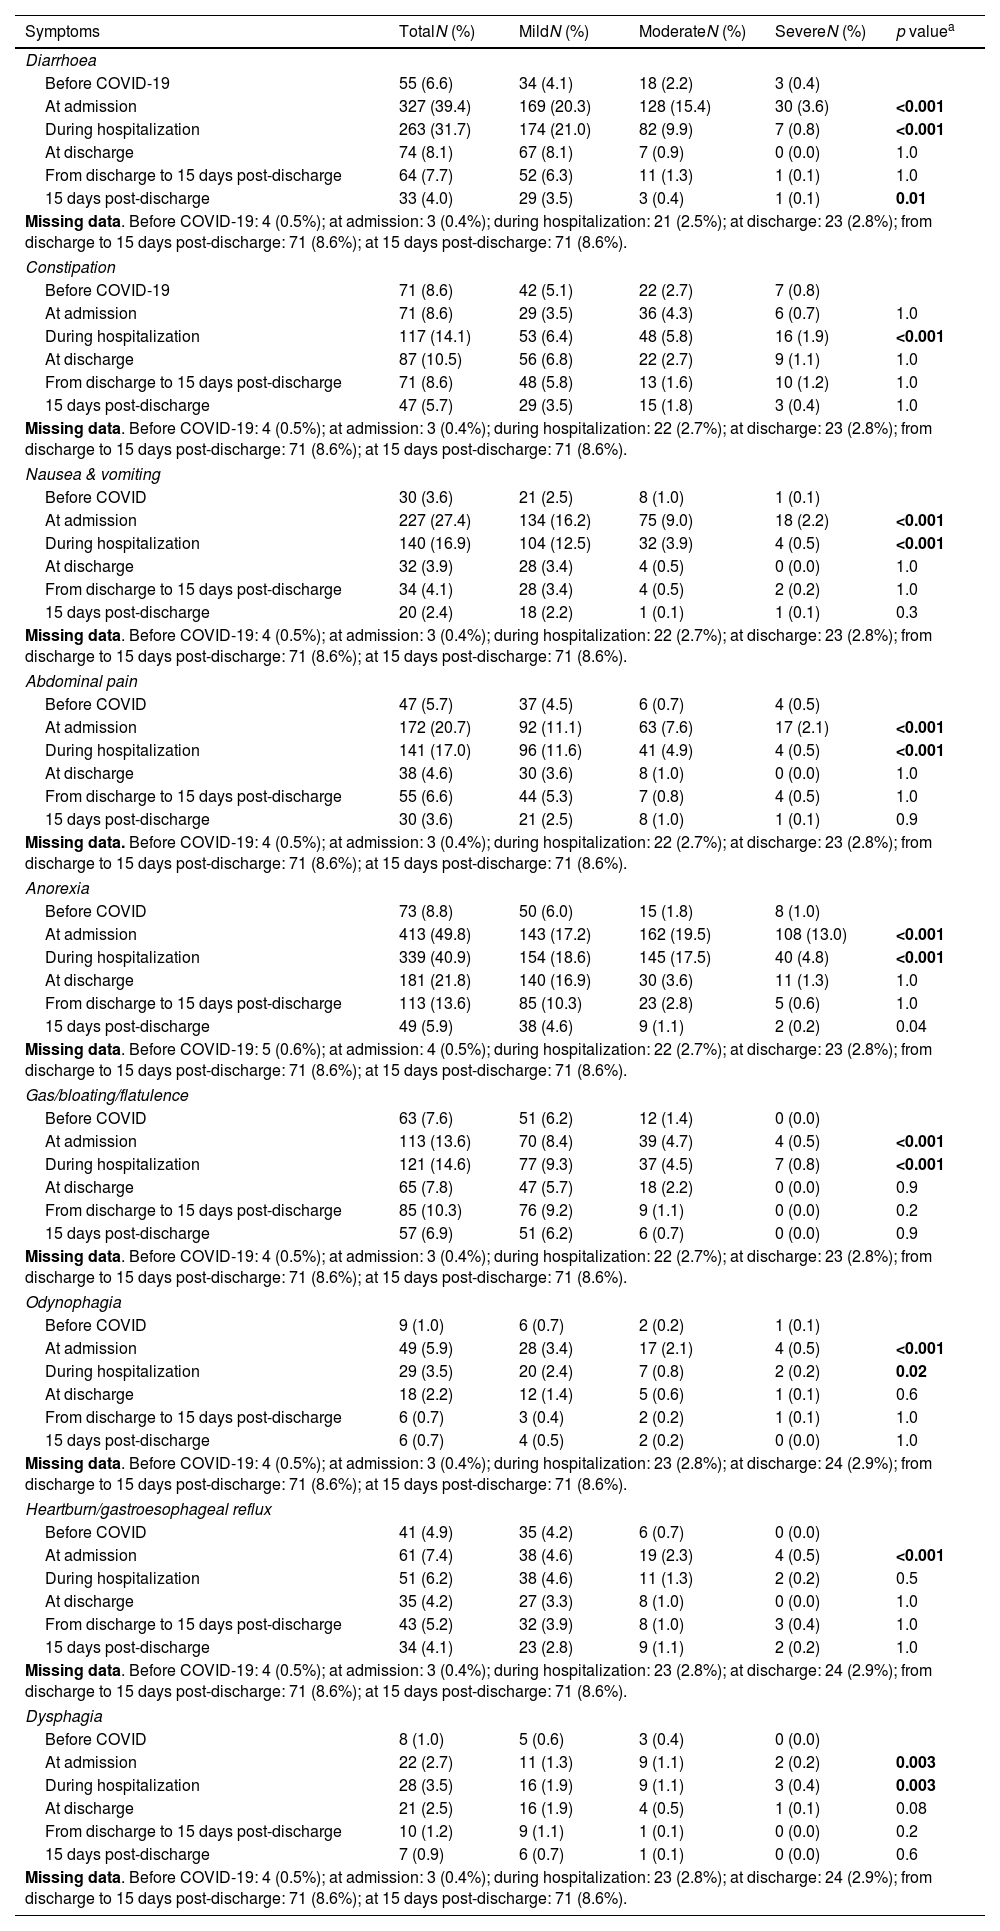
All patients presented in the emergency room due to fever and/or respiratory symptoms. Upon admission, 660 (73.3%) patients had at least one GI symptom, and 406 (49.0%) had two or more GI symptoms, when anorexia was considered a GI symptom. When excluding anorexia, 544 (65.6%) patients had at least one GI symptom and 299 (36.1%) presented two or more. All GI symptoms, except constipation, were more frequent at admission compared to baseline (before COVID-19) (Table 2). The most prevalent GI symptoms at admission were anorexia (n=413; 49.8%), diarrhoea (n=327; 39.4%), nausea/vomiting (n=227; 27.4%), and abdominal pain (n=172; 20.7%) (Table 2). Patients who reported diarrhoea had a median of 3 bowel movements/day (IQR 2–4), with a mean Bristol scale consistency of 6 (IQR 5–6). Patients with constipation had a median of 1 bowel movement/day (IQR 0–1), with a mean Bristol scale consistency of 2 (IQR 1–4). In most cases, the intensity of GI symptoms was mild or moderate (Table 2). In general, the prevalence and intensity of GI symptoms were maximal at admission and progressively decreased, returning to baseline pre-COVID-19 status between discharge and 15 days post-discharge (Fig. 1 and Table 2). GI symptoms at baseline did not significantly differ from those at discharge, between discharge and 15 days post-discharge, or at 15 days after discharge—with the exception that the frequency of diarrhoea was lower at 15 days after discharge compared to at baseline.
Frequency and intensity of gastrointestinal symptoms.
| Symptoms | TotalN (%) | MildN (%) | ModerateN (%) | SevereN (%) | p valuea |
|---|---|---|---|---|---|
| Diarrhoea | |||||
| Before COVID-19 | 55 (6.6) | 34 (4.1) | 18 (2.2) | 3 (0.4) | |
| At admission | 327 (39.4) | 169 (20.3) | 128 (15.4) | 30 (3.6) | <0.001 |
| During hospitalization | 263 (31.7) | 174 (21.0) | 82 (9.9) | 7 (0.8) | <0.001 |
| At discharge | 74 (8.1) | 67 (8.1) | 7 (0.9) | 0 (0.0) | 1.0 |
| From discharge to 15 days post-discharge | 64 (7.7) | 52 (6.3) | 11 (1.3) | 1 (0.1) | 1.0 |
| 15 days post-discharge | 33 (4.0) | 29 (3.5) | 3 (0.4) | 1 (0.1) | 0.01 |
| Missing data. Before COVID-19: 4 (0.5%); at admission: 3 (0.4%); during hospitalization: 21 (2.5%); at discharge: 23 (2.8%); from discharge to 15 days post-discharge: 71 (8.6%); at 15 days post-discharge: 71 (8.6%). | |||||
| Constipation | |||||
| Before COVID-19 | 71 (8.6) | 42 (5.1) | 22 (2.7) | 7 (0.8) | |
| At admission | 71 (8.6) | 29 (3.5) | 36 (4.3) | 6 (0.7) | 1.0 |
| During hospitalization | 117 (14.1) | 53 (6.4) | 48 (5.8) | 16 (1.9) | <0.001 |
| At discharge | 87 (10.5) | 56 (6.8) | 22 (2.7) | 9 (1.1) | 1.0 |
| From discharge to 15 days post-discharge | 71 (8.6) | 48 (5.8) | 13 (1.6) | 10 (1.2) | 1.0 |
| 15 days post-discharge | 47 (5.7) | 29 (3.5) | 15 (1.8) | 3 (0.4) | 1.0 |
| Missing data. Before COVID-19: 4 (0.5%); at admission: 3 (0.4%); during hospitalization: 22 (2.7%); at discharge: 23 (2.8%); from discharge to 15 days post-discharge: 71 (8.6%); at 15 days post-discharge: 71 (8.6%). | |||||
| Nausea & vomiting | |||||
| Before COVID | 30 (3.6) | 21 (2.5) | 8 (1.0) | 1 (0.1) | |
| At admission | 227 (27.4) | 134 (16.2) | 75 (9.0) | 18 (2.2) | <0.001 |
| During hospitalization | 140 (16.9) | 104 (12.5) | 32 (3.9) | 4 (0.5) | <0.001 |
| At discharge | 32 (3.9) | 28 (3.4) | 4 (0.5) | 0 (0.0) | 1.0 |
| From discharge to 15 days post-discharge | 34 (4.1) | 28 (3.4) | 4 (0.5) | 2 (0.2) | 1.0 |
| 15 days post-discharge | 20 (2.4) | 18 (2.2) | 1 (0.1) | 1 (0.1) | 0.3 |
| Missing data. Before COVID-19: 4 (0.5%); at admission: 3 (0.4%); during hospitalization: 22 (2.7%); at discharge: 23 (2.8%); from discharge to 15 days post-discharge: 71 (8.6%); at 15 days post-discharge: 71 (8.6%). | |||||
| Abdominal pain | |||||
| Before COVID | 47 (5.7) | 37 (4.5) | 6 (0.7) | 4 (0.5) | |
| At admission | 172 (20.7) | 92 (11.1) | 63 (7.6) | 17 (2.1) | <0.001 |
| During hospitalization | 141 (17.0) | 96 (11.6) | 41 (4.9) | 4 (0.5) | <0.001 |
| At discharge | 38 (4.6) | 30 (3.6) | 8 (1.0) | 0 (0.0) | 1.0 |
| From discharge to 15 days post-discharge | 55 (6.6) | 44 (5.3) | 7 (0.8) | 4 (0.5) | 1.0 |
| 15 days post-discharge | 30 (3.6) | 21 (2.5) | 8 (1.0) | 1 (0.1) | 0.9 |
| Missing data. Before COVID-19: 4 (0.5%); at admission: 3 (0.4%); during hospitalization: 22 (2.7%); at discharge: 23 (2.8%); from discharge to 15 days post-discharge: 71 (8.6%); at 15 days post-discharge: 71 (8.6%). | |||||
| Anorexia | |||||
| Before COVID | 73 (8.8) | 50 (6.0) | 15 (1.8) | 8 (1.0) | |
| At admission | 413 (49.8) | 143 (17.2) | 162 (19.5) | 108 (13.0) | <0.001 |
| During hospitalization | 339 (40.9) | 154 (18.6) | 145 (17.5) | 40 (4.8) | <0.001 |
| At discharge | 181 (21.8) | 140 (16.9) | 30 (3.6) | 11 (1.3) | 1.0 |
| From discharge to 15 days post-discharge | 113 (13.6) | 85 (10.3) | 23 (2.8) | 5 (0.6) | 1.0 |
| 15 days post-discharge | 49 (5.9) | 38 (4.6) | 9 (1.1) | 2 (0.2) | 0.04 |
| Missing data. Before COVID-19: 5 (0.6%); at admission: 4 (0.5%); during hospitalization: 22 (2.7%); at discharge: 23 (2.8%); from discharge to 15 days post-discharge: 71 (8.6%); at 15 days post-discharge: 71 (8.6%). | |||||
| Gas/bloating/flatulence | |||||
| Before COVID | 63 (7.6) | 51 (6.2) | 12 (1.4) | 0 (0.0) | |
| At admission | 113 (13.6) | 70 (8.4) | 39 (4.7) | 4 (0.5) | <0.001 |
| During hospitalization | 121 (14.6) | 77 (9.3) | 37 (4.5) | 7 (0.8) | <0.001 |
| At discharge | 65 (7.8) | 47 (5.7) | 18 (2.2) | 0 (0.0) | 0.9 |
| From discharge to 15 days post-discharge | 85 (10.3) | 76 (9.2) | 9 (1.1) | 0 (0.0) | 0.2 |
| 15 days post-discharge | 57 (6.9) | 51 (6.2) | 6 (0.7) | 0 (0.0) | 0.9 |
| Missing data. Before COVID-19: 4 (0.5%); at admission: 3 (0.4%); during hospitalization: 22 (2.7%); at discharge: 23 (2.8%); from discharge to 15 days post-discharge: 71 (8.6%); at 15 days post-discharge: 71 (8.6%). | |||||
| Odynophagia | |||||
| Before COVID | 9 (1.0) | 6 (0.7) | 2 (0.2) | 1 (0.1) | |
| At admission | 49 (5.9) | 28 (3.4) | 17 (2.1) | 4 (0.5) | <0.001 |
| During hospitalization | 29 (3.5) | 20 (2.4) | 7 (0.8) | 2 (0.2) | 0.02 |
| At discharge | 18 (2.2) | 12 (1.4) | 5 (0.6) | 1 (0.1) | 0.6 |
| From discharge to 15 days post-discharge | 6 (0.7) | 3 (0.4) | 2 (0.2) | 1 (0.1) | 1.0 |
| 15 days post-discharge | 6 (0.7) | 4 (0.5) | 2 (0.2) | 0 (0.0) | 1.0 |
| Missing data. Before COVID-19: 4 (0.5%); at admission: 3 (0.4%); during hospitalization: 23 (2.8%); at discharge: 24 (2.9%); from discharge to 15 days post-discharge: 71 (8.6%); at 15 days post-discharge: 71 (8.6%). | |||||
| Heartburn/gastroesophageal reflux | |||||
| Before COVID | 41 (4.9) | 35 (4.2) | 6 (0.7) | 0 (0.0) | |
| At admission | 61 (7.4) | 38 (4.6) | 19 (2.3) | 4 (0.5) | <0.001 |
| During hospitalization | 51 (6.2) | 38 (4.6) | 11 (1.3) | 2 (0.2) | 0.5 |
| At discharge | 35 (4.2) | 27 (3.3) | 8 (1.0) | 0 (0.0) | 1.0 |
| From discharge to 15 days post-discharge | 43 (5.2) | 32 (3.9) | 8 (1.0) | 3 (0.4) | 1.0 |
| 15 days post-discharge | 34 (4.1) | 23 (2.8) | 9 (1.1) | 2 (0.2) | 1.0 |
| Missing data. Before COVID-19: 4 (0.5%); at admission: 3 (0.4%); during hospitalization: 23 (2.8%); at discharge: 24 (2.9%); from discharge to 15 days post-discharge: 71 (8.6%); at 15 days post-discharge: 71 (8.6%). | |||||
| Dysphagia | |||||
| Before COVID | 8 (1.0) | 5 (0.6) | 3 (0.4) | 0 (0.0) | |
| At admission | 22 (2.7) | 11 (1.3) | 9 (1.1) | 2 (0.2) | 0.003 |
| During hospitalization | 28 (3.5) | 16 (1.9) | 9 (1.1) | 3 (0.4) | 0.003 |
| At discharge | 21 (2.5) | 16 (1.9) | 4 (0.5) | 1 (0.1) | 0.08 |
| From discharge to 15 days post-discharge | 10 (1.2) | 9 (1.1) | 1 (0.1) | 0 (0.0) | 0.2 |
| 15 days post-discharge | 7 (0.9) | 6 (0.7) | 1 (0.1) | 0 (0.0) | 0.6 |
| Missing data. Before COVID-19: 4 (0.5%); at admission: 3 (0.4%); during hospitalization: 23 (2.8%); at discharge: 24 (2.9%); from discharge to 15 days post-discharge: 71 (8.6%); at 15 days post-discharge: 71 (8.6%). | |||||
The values in bold are those results that have reached statistical significance (p < 0.05).
Pairwise comparisons using Wilcoxon signed-rank test with continuity correction: each symptom during COVID-19 was compared to the pre-COVID-19 baseline presence of the symptom. Qualitative variables expressed as absolute number (%). Intensity during hospitalization and from discharge to 15 days post-discharge: higher intensity reported by the patient during those periods.
 to 15 days post-discharge.")
GI complications were infrequent—except for acute liver injury or worsening of previous liver disease, which was present in 267 (32.1%) patients, 251 (94.0%) of whom already had it upon admission (supplementary content 2). Among the patients with liver damage, 238 (89.1%) presented mild hypertransaminasemia, 29 (10.9%) severe hypertransaminasemia, 246 (29.7%) elevated enzymes of cholestasis, 17 (6.4%) any increase of bilirubin level, and 2 (0.7%) an INR increase to >1.5IU (not related to liver failure). Patients with liver injury exhibited the following median maximum values of liver laboratory parameters: aspartate-aminotransferase (AST) 63 (IQR 44–108)U/L, alanine-aminotransferase (ALT) 73 (IQR 50–135)U/L, gamma-glutamyl transpeptidase (GGT) 144 (IQR 102–267)U/L, alkaline phosphatase (AF) 146 (IQR 124–202)U/L, and bilirubin 1.6 (IQR 1.3–2.0)mg/dL. No patient developed acute liver failure. Supplementary content 2 summarizes other exceptional GI complications that occurred and their suspected causes.
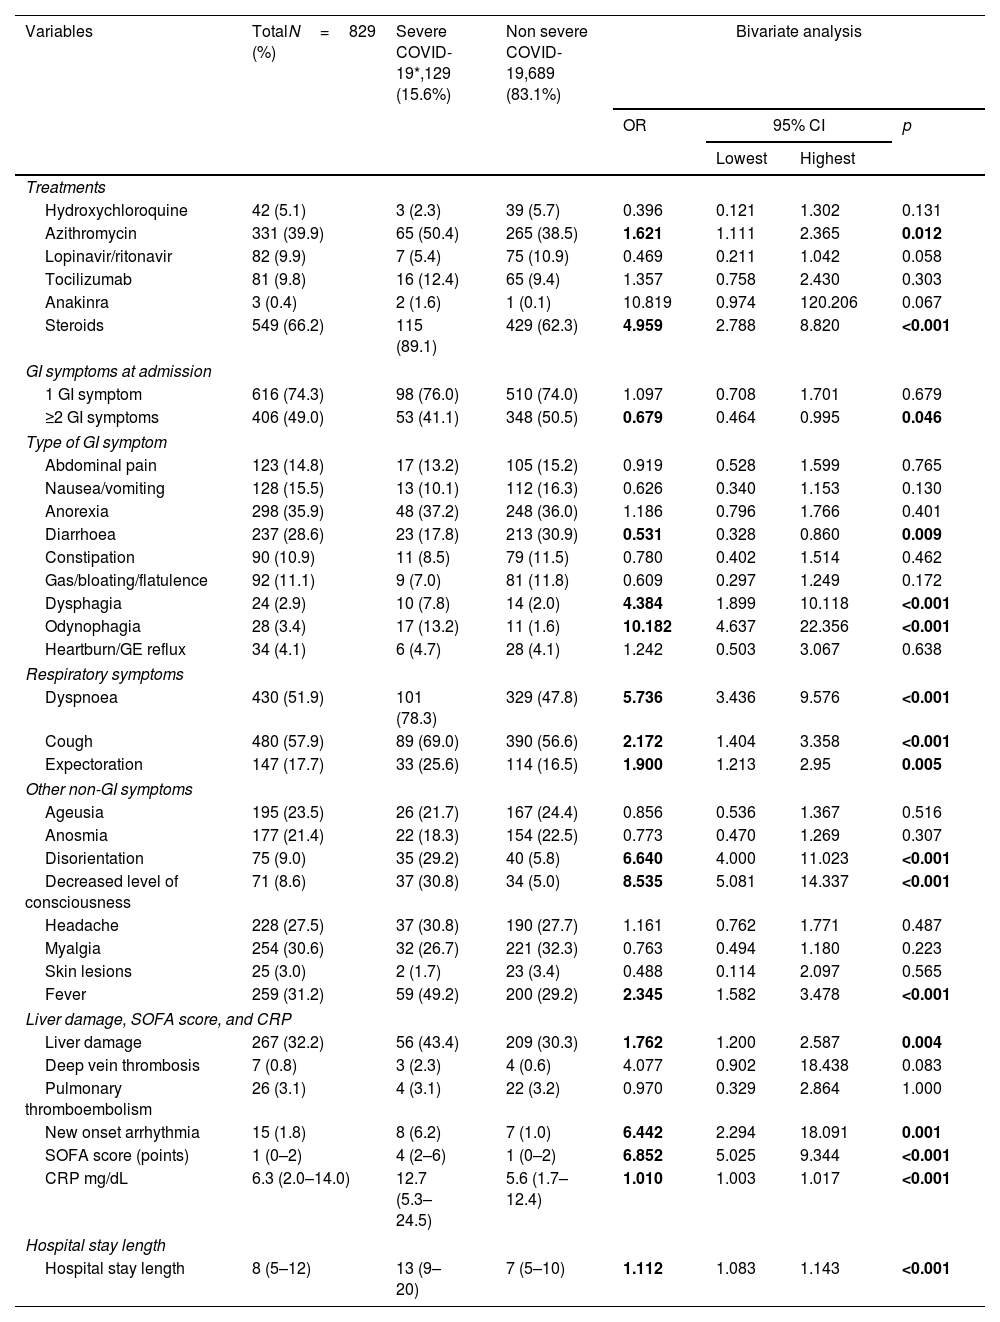
Association between GI symptoms/complications and COVID-19 severityTable 1 summarizes the baseline characteristics associated with severe COVID-19. Bivariate analysis revealed that severe COVID-19 was associated with dysphagia (OR 4.384; 95% CI 1.899–10.118; p<0.001), odynophagia (OR 10.182; 95% CI 4.637–22.356; p<0.001), and liver injury (OR 1.762; 95% CI 1.200–2.587; p=0.004). In contrast, non-severe COVID-19 was associated with the presence of ≥2 gastrointestinal symptoms upon admission (OR 0.679; 95% CI 0.464–0.995; p=0.046) and diarrhoea during hospitalization after adjustment for baseline diarrhoea (OR 0.531; 95% CI 0.328–0.860; p=0.009) (Table 3).
Associations of symptoms and complications and other outcome variables with COVID-19 severity; bivariate analysis.
| Variables | TotalN=829 (%) | Severe COVID-19*,129 (15.6%) | Non severe COVID-19,689 (83.1%) | Bivariate analysis | |||
|---|---|---|---|---|---|---|---|
| OR | 95% CI | p | |||||
| Lowest | Highest | ||||||
| Treatments | |||||||
| Hydroxychloroquine | 42 (5.1) | 3 (2.3) | 39 (5.7) | 0.396 | 0.121 | 1.302 | 0.131 |
| Azithromycin | 331 (39.9) | 65 (50.4) | 265 (38.5) | 1.621 | 1.111 | 2.365 | 0.012 |
| Lopinavir/ritonavir | 82 (9.9) | 7 (5.4) | 75 (10.9) | 0.469 | 0.211 | 1.042 | 0.058 |
| Tocilizumab | 81 (9.8) | 16 (12.4) | 65 (9.4) | 1.357 | 0.758 | 2.430 | 0.303 |
| Anakinra | 3 (0.4) | 2 (1.6) | 1 (0.1) | 10.819 | 0.974 | 120.206 | 0.067 |
| Steroids | 549 (66.2) | 115 (89.1) | 429 (62.3) | 4.959 | 2.788 | 8.820 | <0.001 |
| GI symptoms at admission | |||||||
| 1 GI symptom | 616 (74.3) | 98 (76.0) | 510 (74.0) | 1.097 | 0.708 | 1.701 | 0.679 |
| ≥2 GI symptoms | 406 (49.0) | 53 (41.1) | 348 (50.5) | 0.679 | 0.464 | 0.995 | 0.046 |
| Type of GI symptom | |||||||
| Abdominal pain | 123 (14.8) | 17 (13.2) | 105 (15.2) | 0.919 | 0.528 | 1.599 | 0.765 |
| Nausea/vomiting | 128 (15.5) | 13 (10.1) | 112 (16.3) | 0.626 | 0.340 | 1.153 | 0.130 |
| Anorexia | 298 (35.9) | 48 (37.2) | 248 (36.0) | 1.186 | 0.796 | 1.766 | 0.401 |
| Diarrhoea | 237 (28.6) | 23 (17.8) | 213 (30.9) | 0.531 | 0.328 | 0.860 | 0.009 |
| Constipation | 90 (10.9) | 11 (8.5) | 79 (11.5) | 0.780 | 0.402 | 1.514 | 0.462 |
| Gas/bloating/flatulence | 92 (11.1) | 9 (7.0) | 81 (11.8) | 0.609 | 0.297 | 1.249 | 0.172 |
| Dysphagia | 24 (2.9) | 10 (7.8) | 14 (2.0) | 4.384 | 1.899 | 10.118 | <0.001 |
| Odynophagia | 28 (3.4) | 17 (13.2) | 11 (1.6) | 10.182 | 4.637 | 22.356 | <0.001 |
| Heartburn/GE reflux | 34 (4.1) | 6 (4.7) | 28 (4.1) | 1.242 | 0.503 | 3.067 | 0.638 |
| Respiratory symptoms | |||||||
| Dyspnoea | 430 (51.9) | 101 (78.3) | 329 (47.8) | 5.736 | 3.436 | 9.576 | <0.001 |
| Cough | 480 (57.9) | 89 (69.0) | 390 (56.6) | 2.172 | 1.404 | 3.358 | <0.001 |
| Expectoration | 147 (17.7) | 33 (25.6) | 114 (16.5) | 1.900 | 1.213 | 2.95 | 0.005 |
| Other non-GI symptoms | |||||||
| Ageusia | 195 (23.5) | 26 (21.7) | 167 (24.4) | 0.856 | 0.536 | 1.367 | 0.516 |
| Anosmia | 177 (21.4) | 22 (18.3) | 154 (22.5) | 0.773 | 0.470 | 1.269 | 0.307 |
| Disorientation | 75 (9.0) | 35 (29.2) | 40 (5.8) | 6.640 | 4.000 | 11.023 | <0.001 |
| Decreased level of consciousness | 71 (8.6) | 37 (30.8) | 34 (5.0) | 8.535 | 5.081 | 14.337 | <0.001 |
| Headache | 228 (27.5) | 37 (30.8) | 190 (27.7) | 1.161 | 0.762 | 1.771 | 0.487 |
| Myalgia | 254 (30.6) | 32 (26.7) | 221 (32.3) | 0.763 | 0.494 | 1.180 | 0.223 |
| Skin lesions | 25 (3.0) | 2 (1.7) | 23 (3.4) | 0.488 | 0.114 | 2.097 | 0.565 |
| Fever | 259 (31.2) | 59 (49.2) | 200 (29.2) | 2.345 | 1.582 | 3.478 | <0.001 |
| Liver damage, SOFA score, and CRP | |||||||
| Liver damage | 267 (32.2) | 56 (43.4) | 209 (30.3) | 1.762 | 1.200 | 2.587 | 0.004 |
| Deep vein thrombosis | 7 (0.8) | 3 (2.3) | 4 (0.6) | 4.077 | 0.902 | 18.438 | 0.083 |
| Pulmonary thromboembolism | 26 (3.1) | 4 (3.1) | 22 (3.2) | 0.970 | 0.329 | 2.864 | 1.000 |
| New onset arrhythmia | 15 (1.8) | 8 (6.2) | 7 (1.0) | 6.442 | 2.294 | 18.091 | 0.001 |
| SOFA score (points) | 1 (0–2) | 4 (2–6) | 1 (0–2) | 6.852 | 5.025 | 9.344 | <0.001 |
| CRP mg/dL | 6.3 (2.0–14.0) | 12.7 (5.3–24.5) | 5.6 (1.7–12.4) | 1.010 | 1.003 | 1.017 | <0.001 |
| Hospital stay length | |||||||
| Hospital stay length | 8 (5–12) | 13 (9–20) | 7 (5–10) | 1.112 | 1.083 | 1.143 | <0.001 |
The values in bold are those results that have reached statistical significance (p < 0.05).
Data were missing or unavailable data for 11 patients who could not be classified as having severe or non-severe COVID-19.
GI symptoms were adjusted by the baseline pre-COVID-19 presence of the symptoms, eliminating those cases in which the symptom presented before COVID-19. Qualitative variables expressed as absolute number (%). Quantitative variables expressed as mean and standard deviation (SD) or median and interquartile range (IQR). CI: confidence interval; CRP: C-reactive protein; GE reflux: gastroesophageal reflux; GI: gastrointestinal; OR: odds ratio; SOFA score: sepsis-related organ failure assessment score.
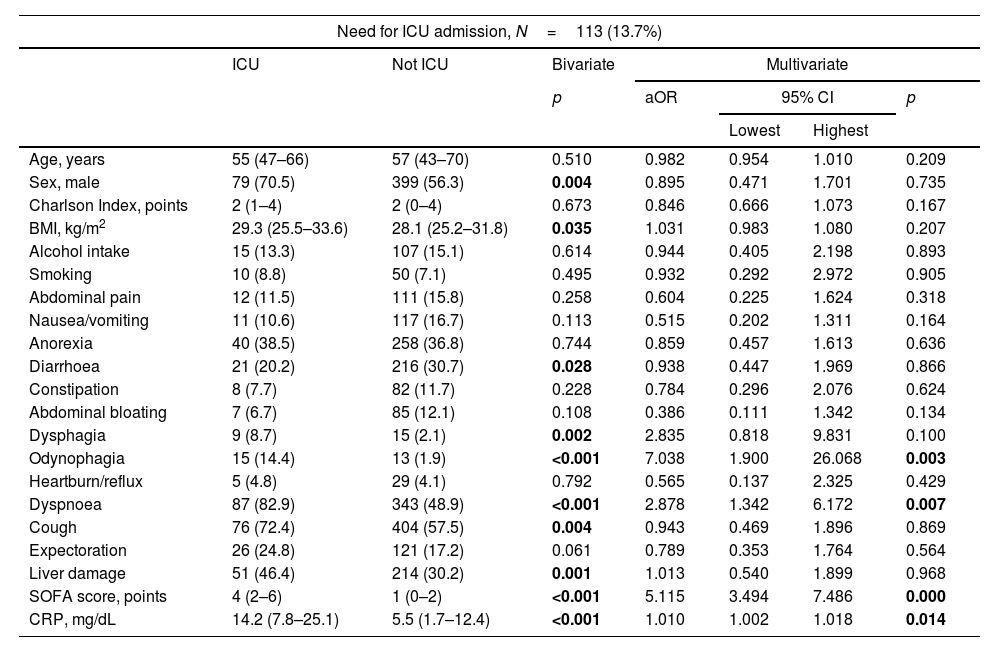
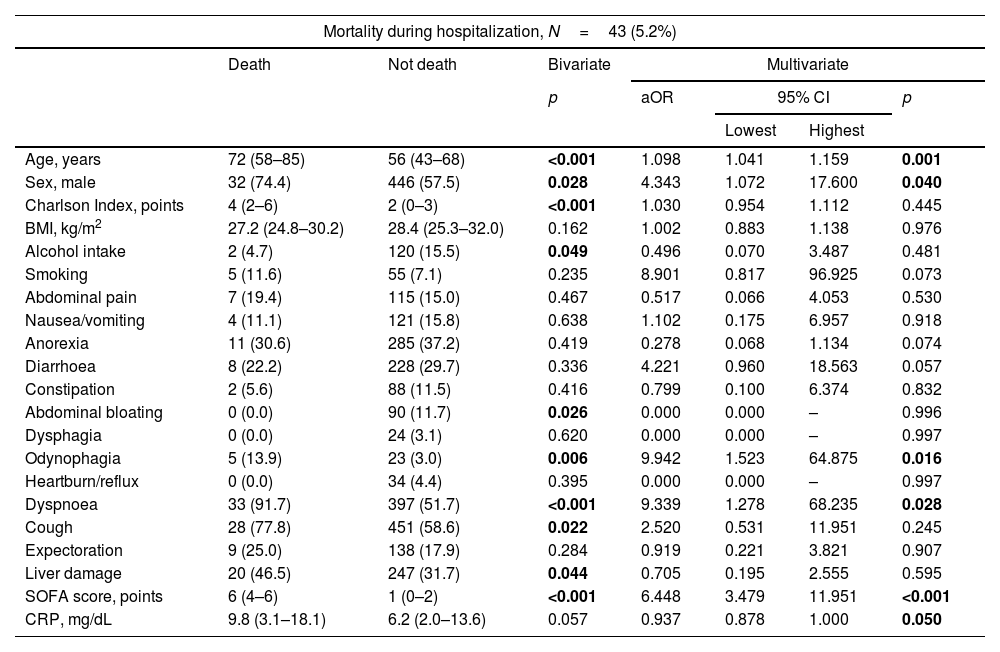
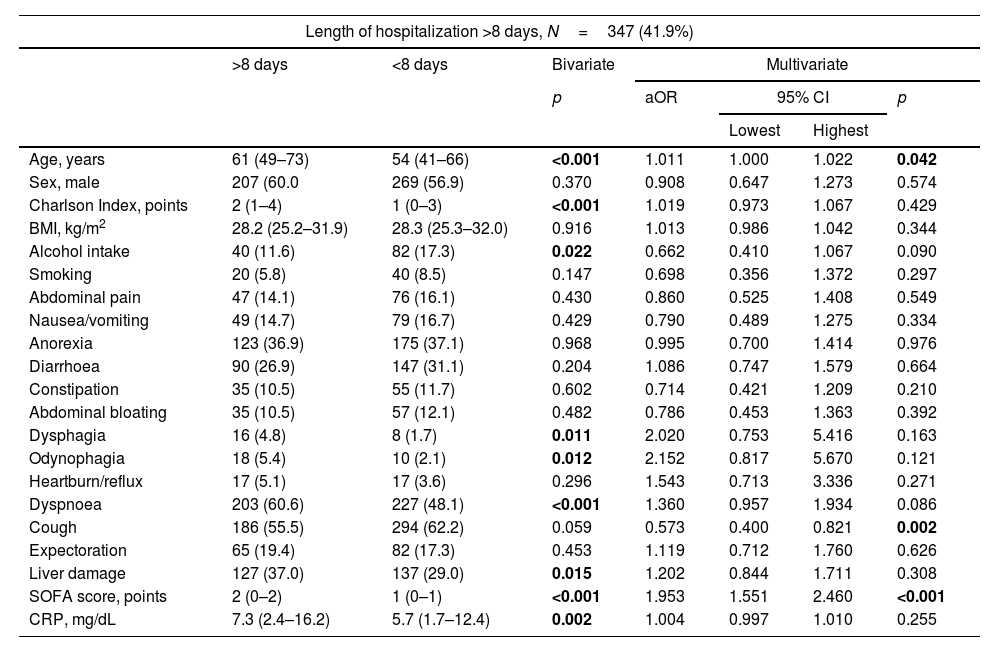
Despite the associations revealed by bivariate analysis, multivariate analysis evaluating hospital outcomes showed that only odynophagia during hospitalization was an independent risk factor for ICU admission (aOR 7.038; 95% CI 1.900–26.068; p=0.003) and mortality (aOR 9.942; 95% CI 1.523–64.875; p=0.016) (Tables 4 and 5). GI symptoms and complications were not independently associated with hospital stay (p>0.05) (Table 6).
Multivariate analysis assessing the association between intensive care unit admission and possible determinants.
| Need for ICU admission, N=113 (13.7%) | |||||||
|---|---|---|---|---|---|---|---|
| ICU | Not ICU | Bivariate | Multivariate | ||||
| p | aOR | 95% CI | p | ||||
| Lowest | Highest | ||||||
| Age, years | 55 (47–66) | 57 (43–70) | 0.510 | 0.982 | 0.954 | 1.010 | 0.209 |
| Sex, male | 79 (70.5) | 399 (56.3) | 0.004 | 0.895 | 0.471 | 1.701 | 0.735 |
| Charlson Index, points | 2 (1–4) | 2 (0–4) | 0.673 | 0.846 | 0.666 | 1.073 | 0.167 |
| BMI, kg/m2 | 29.3 (25.5–33.6) | 28.1 (25.2–31.8) | 0.035 | 1.031 | 0.983 | 1.080 | 0.207 |
| Alcohol intake | 15 (13.3) | 107 (15.1) | 0.614 | 0.944 | 0.405 | 2.198 | 0.893 |
| Smoking | 10 (8.8) | 50 (7.1) | 0.495 | 0.932 | 0.292 | 2.972 | 0.905 |
| Abdominal pain | 12 (11.5) | 111 (15.8) | 0.258 | 0.604 | 0.225 | 1.624 | 0.318 |
| Nausea/vomiting | 11 (10.6) | 117 (16.7) | 0.113 | 0.515 | 0.202 | 1.311 | 0.164 |
| Anorexia | 40 (38.5) | 258 (36.8) | 0.744 | 0.859 | 0.457 | 1.613 | 0.636 |
| Diarrhoea | 21 (20.2) | 216 (30.7) | 0.028 | 0.938 | 0.447 | 1.969 | 0.866 |
| Constipation | 8 (7.7) | 82 (11.7) | 0.228 | 0.784 | 0.296 | 2.076 | 0.624 |
| Abdominal bloating | 7 (6.7) | 85 (12.1) | 0.108 | 0.386 | 0.111 | 1.342 | 0.134 |
| Dysphagia | 9 (8.7) | 15 (2.1) | 0.002 | 2.835 | 0.818 | 9.831 | 0.100 |
| Odynophagia | 15 (14.4) | 13 (1.9) | <0.001 | 7.038 | 1.900 | 26.068 | 0.003 |
| Heartburn/reflux | 5 (4.8) | 29 (4.1) | 0.792 | 0.565 | 0.137 | 2.325 | 0.429 |
| Dyspnoea | 87 (82.9) | 343 (48.9) | <0.001 | 2.878 | 1.342 | 6.172 | 0.007 |
| Cough | 76 (72.4) | 404 (57.5) | 0.004 | 0.943 | 0.469 | 1.896 | 0.869 |
| Expectoration | 26 (24.8) | 121 (17.2) | 0.061 | 0.789 | 0.353 | 1.764 | 0.564 |
| Liver damage | 51 (46.4) | 214 (30.2) | 0.001 | 1.013 | 0.540 | 1.899 | 0.968 |
| SOFA score, points | 4 (2–6) | 1 (0–2) | <0.001 | 5.115 | 3.494 | 7.486 | 0.000 |
| CRP, mg/dL | 14.2 (7.8–25.1) | 5.5 (1.7–12.4) | <0.001 | 1.010 | 1.002 | 1.018 | 0.014 |
The values in bold are those results that have reached statistical significance (p < 0.05).
Analysis included 751 patients with no missing data for any of the variables. R2 Nagelkerke: 50.1%.
GI symptoms were adjusted by the baseline pre-COVID-19 presence of the symptoms, eliminating cases in which the symptom presented before COVID-19. Qualitative variables expressed as absolute number (%). Quantitative variables expressed as mean and standard deviation (SD) or median and interquartile range (IQR). Sex representing the biological sex. BMI: body mass index; CI: confidence intervals; CRP: C-reactive protein; OR: odds ratio; SOFA score: sepsis-related organ failure assessment score.
Multivariate analysis assessing the association between mortality and possible determinants.
| Mortality during hospitalization, N=43 (5.2%) | |||||||
|---|---|---|---|---|---|---|---|
| Death | Not death | Bivariate | Multivariate | ||||
| p | aOR | 95% CI | p | ||||
| Lowest | Highest | ||||||
| Age, years | 72 (58–85) | 56 (43–68) | <0.001 | 1.098 | 1.041 | 1.159 | 0.001 |
| Sex, male | 32 (74.4) | 446 (57.5) | 0.028 | 4.343 | 1.072 | 17.600 | 0.040 |
| Charlson Index, points | 4 (2–6) | 2 (0–3) | <0.001 | 1.030 | 0.954 | 1.112 | 0.445 |
| BMI, kg/m2 | 27.2 (24.8–30.2) | 28.4 (25.3–32.0) | 0.162 | 1.002 | 0.883 | 1.138 | 0.976 |
| Alcohol intake | 2 (4.7) | 120 (15.5) | 0.049 | 0.496 | 0.070 | 3.487 | 0.481 |
| Smoking | 5 (11.6) | 55 (7.1) | 0.235 | 8.901 | 0.817 | 96.925 | 0.073 |
| Abdominal pain | 7 (19.4) | 115 (15.0) | 0.467 | 0.517 | 0.066 | 4.053 | 0.530 |
| Nausea/vomiting | 4 (11.1) | 121 (15.8) | 0.638 | 1.102 | 0.175 | 6.957 | 0.918 |
| Anorexia | 11 (30.6) | 285 (37.2) | 0.419 | 0.278 | 0.068 | 1.134 | 0.074 |
| Diarrhoea | 8 (22.2) | 228 (29.7) | 0.336 | 4.221 | 0.960 | 18.563 | 0.057 |
| Constipation | 2 (5.6) | 88 (11.5) | 0.416 | 0.799 | 0.100 | 6.374 | 0.832 |
| Abdominal bloating | 0 (0.0) | 90 (11.7) | 0.026 | 0.000 | 0.000 | – | 0.996 |
| Dysphagia | 0 (0.0) | 24 (3.1) | 0.620 | 0.000 | 0.000 | – | 0.997 |
| Odynophagia | 5 (13.9) | 23 (3.0) | 0.006 | 9.942 | 1.523 | 64.875 | 0.016 |
| Heartburn/reflux | 0 (0.0) | 34 (4.4) | 0.395 | 0.000 | 0.000 | – | 0.997 |
| Dyspnoea | 33 (91.7) | 397 (51.7) | <0.001 | 9.339 | 1.278 | 68.235 | 0.028 |
| Cough | 28 (77.8) | 451 (58.6) | 0.022 | 2.520 | 0.531 | 11.951 | 0.245 |
| Expectoration | 9 (25.0) | 138 (17.9) | 0.284 | 0.919 | 0.221 | 3.821 | 0.907 |
| Liver damage | 20 (46.5) | 247 (31.7) | 0.044 | 0.705 | 0.195 | 2.555 | 0.595 |
| SOFA score, points | 6 (4–6) | 1 (0–2) | <0.001 | 6.448 | 3.479 | 11.951 | <0.001 |
| CRP, mg/dL | 9.8 (3.1–18.1) | 6.2 (2.0–13.6) | 0.057 | 0.937 | 0.878 | 1.000 | 0.050 |
The values in bold are those results that have reached statistical significance (p < 0.05).
Analysis included 751 patients with no missing data for any of the variables. R2 Nagelkerke: 65.8%.
GI symptoms were adjusted by the baseline pre-COVID-19 presence of the symptoms, eliminating cases that presented the symptom before COVID-19. Qualitative variables expressed as absolute number (%). Quantitative variables expressed as mean and standard deviation (SD) or median and interquartile range (IQR). Sex representing the biological sex. BMI: body mass index; CI: confidence interval; CRP: C-reactive protein; OR: odds ratio; SOFA score: sepsis-related organ failure assessment score.
Bivariate and multivariate analyses assessing the association between length of hospital stay and possible determinants.
| Length of hospitalization >8 days, N=347 (41.9%) | |||||||
|---|---|---|---|---|---|---|---|
| >8 days | <8 days | Bivariate | Multivariate | ||||
| p | aOR | 95% CI | p | ||||
| Lowest | Highest | ||||||
| Age, years | 61 (49–73) | 54 (41–66) | <0.001 | 1.011 | 1.000 | 1.022 | 0.042 |
| Sex, male | 207 (60.0 | 269 (56.9) | 0.370 | 0.908 | 0.647 | 1.273 | 0.574 |
| Charlson Index, points | 2 (1–4) | 1 (0–3) | <0.001 | 1.019 | 0.973 | 1.067 | 0.429 |
| BMI, kg/m2 | 28.2 (25.2–31.9) | 28.3 (25.3–32.0) | 0.916 | 1.013 | 0.986 | 1.042 | 0.344 |
| Alcohol intake | 40 (11.6) | 82 (17.3) | 0.022 | 0.662 | 0.410 | 1.067 | 0.090 |
| Smoking | 20 (5.8) | 40 (8.5) | 0.147 | 0.698 | 0.356 | 1.372 | 0.297 |
| Abdominal pain | 47 (14.1) | 76 (16.1) | 0.430 | 0.860 | 0.525 | 1.408 | 0.549 |
| Nausea/vomiting | 49 (14.7) | 79 (16.7) | 0.429 | 0.790 | 0.489 | 1.275 | 0.334 |
| Anorexia | 123 (36.9) | 175 (37.1) | 0.968 | 0.995 | 0.700 | 1.414 | 0.976 |
| Diarrhoea | 90 (26.9) | 147 (31.1) | 0.204 | 1.086 | 0.747 | 1.579 | 0.664 |
| Constipation | 35 (10.5) | 55 (11.7) | 0.602 | 0.714 | 0.421 | 1.209 | 0.210 |
| Abdominal bloating | 35 (10.5) | 57 (12.1) | 0.482 | 0.786 | 0.453 | 1.363 | 0.392 |
| Dysphagia | 16 (4.8) | 8 (1.7) | 0.011 | 2.020 | 0.753 | 5.416 | 0.163 |
| Odynophagia | 18 (5.4) | 10 (2.1) | 0.012 | 2.152 | 0.817 | 5.670 | 0.121 |
| Heartburn/reflux | 17 (5.1) | 17 (3.6) | 0.296 | 1.543 | 0.713 | 3.336 | 0.271 |
| Dyspnoea | 203 (60.6) | 227 (48.1) | <0.001 | 1.360 | 0.957 | 1.934 | 0.086 |
| Cough | 186 (55.5) | 294 (62.2) | 0.059 | 0.573 | 0.400 | 0.821 | 0.002 |
| Expectoration | 65 (19.4) | 82 (17.3) | 0.453 | 1.119 | 0.712 | 1.760 | 0.626 |
| Liver damage | 127 (37.0) | 137 (29.0) | 0.015 | 1.202 | 0.844 | 1.711 | 0.308 |
| SOFA score, points | 2 (0–2) | 1 (0–1) | <0.001 | 1.953 | 1.551 | 2.460 | <0.001 |
| CRP, mg/dL | 7.3 (2.4–16.2) | 5.7 (1.7–12.4) | 0.002 | 1.004 | 0.997 | 1.010 | 0.255 |
The values in bold are those results that have reached statistical significance (p < 0.05).
Analysis included 751 patients with no missing data for any of the variables. R2 Nagelkerke:17.8%.
GI symptoms were adjusted by the baseline pre-COVID-19 presence of the symptoms, eliminating cases in which the symptom presented before COVID-19. Qualitative variables expressed as absolute number (%). Quantitative variables expressed as mean and standard deviation (SD) or median and interquartile range (IQR). Sex representing the biological sex. BMI: body mass index; CI: confidence intervals; CRP: C-reactive protein; OR: odds ratio; SOFA score: sepsis-related organ failure assessment score.
A sub-analysis performed to evaluate possible confounding factors revealed that patients who presented with odynophagia and dysphagia during hospitalization (after adjustment for pre-COVID-19 symptoms) more frequently required orotracheal intubation during hospitalization: 8 (28.6%) patients with odynophagia versus 47 (6.0%) without odynophagia, and 8 (33.3%) patients with dysphagia versus 47 (6.0%) without dysphagia (p<0.05). In contrast, odynophagia and dysphasia at admission did not predict poorer hospital outcomes (data not shown).
DiscussionTo our knowledge, this is one of the first international prospective observational study designed specifically to evaluate the frequency of GI symptoms and complications in patients hospitalized due to COVID-19. We have particularly focused on assessing the presence of pre-COVID-19 GI symptoms, the patient-reported intensity of GI symptoms, and monitoring the evolution of these symptoms throughout the disease.
The most frequent COVID-19-related GI symptoms were anorexia, diarrhoea, nausea/vomiting, and abdominal pain, as previously published.2-5,20,21 However, our cohort presented a higher frequency of GI symptoms than has been earlier described in hospitalized patients. Among our patients, 74.3% presented at least one GI symptom, and 49.0% with two or more GI symptoms at the time of admission. In contrast, early retrospective published studies report prevalence rates of ∼10%,2-4,21 and later publications report prevalence rates of up to 50%.5,20 This disparity could be explained by previous studies’ logical focus on respiratory symptoms, as well as their retrospective nature, with a bias towards more severe GI symptoms (as milder ones would not be included on clinical records), and the inherent design drawbacks of frequent data loss, low-quality assessments, and short follow-up.
Consistent with our results, among the few published prospective studies, the prevalence of GI symptoms were similar to ours. Thus, the prospective case–control studies by Marasco et al.,22 including 871 patients (575 COVID+ and 296 COVID−), and Chen et al.,23 including 340 patients (101 COVID+ and 239 COVID−), showed a significantly higher prevalence of GI symptoms (p<0.001 both studies) in COVID-19 patients. This way, the prevalence of GI symptoms was 59.7% in the study by Marasco et al. vs 65.6% in our study (anorexia was not included as a symptom); and 74% in the study by Chen et al. vs 74.3% in ours (anorexia was included as a symptom). Although in this second study most of the patients were not hospitalized (different population), it is an obvious example of higher prevalence of GI symptoms reported in prospective studies focus specifically in them. By comparison, another Moroccan study involving 713 patients with COVID-19 described lower prevalences of GI symptoms (14.3%). In this case, the results are likely to be biased by the population included (64 children, 17 pregnant women, 30-years mean age of the cohort).24
Besides, in our study GI symptoms were mostly perceived as mild or moderate, as intuited by Elmunzer et al.,5 tended to resolve early, similar to the study by Marasco et al.,22 and were not associated with severe COVID-19 or worse hospital outcomes (understood as need for ICU admission, longer hospital stay or death). Thus, contrary to speculations of the earliest studies,4 our present findings suggest that GI symptoms are mild manifestations of COVID-19 that do not predict a more aggressive course,5,25 and point that persistent GI symptoms due to COVID-19 are very rare.
Only odynophagia and dysphagia during hospitalization were associated with poorer outcomes. However, a sub-analysis revealed that patients reporting these symptoms more frequently required orotracheal intubation during admission, such that they may be a consequence of this invasive treatment.
Future studies should be directed to elucidate whether these symptoms are due to the direct effect of the virus, secondary aspects of the disease (e.g., odynophagia due to incubation, constipation due to immobility) or adverse effects of the medication.
Regarding GI complications, our study population showed no cases of cholecystitis, pancreatitis, enteritis, duodenitis, cholangitis, debut of inflammatory bowel disease, or GI vascular complications—contrary to the findings of some retrospective studies.12,13,16,17,26–29 Special attention should be paid to acute or worsening liver injury, which affected up to 1/3 of the included patients and mainly presented as mild hypertransaminasemia,3–5 consistent with the suggestions of retrospective studies.10,29,30 Furthermore, bivariate analysis showed that liver injury was more prevalent in patient with severe COVID-19, need for ICU admission, large hospital stay, and mortality. However, when adjusting this condition for other potential confounders, liver injury was not an independent predictor of worse hospital outcomes, in contrast to the suggestions of previous studies.5,10,31,32 It is worth mentioning, Weber et al. found that increased risk of ICU admission was associated with any abnormal liver parameter, after adjusting for age, gender, and relevant comorbidities.32 This difference could be explained by the variables considered in the logistic regression. In our study, these variables also included respiratory symptoms, organ failure, and inflammation, which seem to be the main determinants of disease severity in our cohort. Despite these results, more studies focused on liver damage should be performed to clarify this possible association and the etiopathogenesis of liver injury.
The strengths of this study include its international multicentre nature and its prospective design with a large sample size (higher number of COVID-19 patients included than other prospective studies). Additionally, it was specifically designed to study GI symptoms, assessed using comprehensive questionnaires that enabled proper evaluation of their frequency and intensity as perceived by patients. Finally, the prevalence of GI symptoms at each time point evaluated was compared with the baseline situation of patients, before COVID-19 (not with a control group without COVID, but with other pathologies requiring admission or follow-up in a health centre), allowing us to better discern the magnitude of symptoms caused by COVID-19. A weakness of this study is that the patient sample may be underpowered to detect rare COVID-19 gastrointestinal complications.
In conclusion, GI symptoms were more common than previously documented in hospitalized COVID-19 patients. They mostly presented as mild to moderate and tended to rapidly resolve. Our findings suggest that GI symptoms are a mild manifestation of COVID-19 that do not predict severity. Their isolated presentation as a cause of admission is exceptional, and its persistence outside the acute episode is very rare. Our results also sustain that liver injury is a prevalent complication among hospitalized patients while the rest of digestive complications previously described in the context of COVID-19 seem to be infrequent.
Authors’ contributionsAll authors were involved in data acquisition and critical revision of the manuscript. E. de-Madaria and K. Cárdenas-Jaén conceptualized and designed the study. A. Vaillo monitored the study. K. Cárdenas-Jaén, J.J. Mira, A. Mula, I. Carrillo, and E. de-Madaria performed the primary analysis and interpretation of the data. K. Cárdenas-Jaén, S.A. Sánchez-Luna, J.J. Mira, A. Mula, I. Carrillo, and E. de-Madaria prepared the initial draft of the manuscript. All authors have approved the final version of the manuscript.
FundingThis project received financial support from the Alicante Institute for Health and Biomedical Research (ISABIAL) (reference 2020-0355). Karina Cárdenas-Jaén was supported by a Río Hortega research contract from the Instituto de Salud Carlos III, Madrid, Spain, (reference CM19/00157).
Competing interestsThe authors declare no conflict of interests for this article.
The following are the supplementary data to this article:
