


The aim of this study was to investigate the accuracy of liver and spleen stiffness measurement by transient elastography for the prediction of gastroesophageal varices in patients with HCV-associated cirrhosis treated with new direct-acting antiviral agents.
Patients and methodsThis cross-sectional observational study included patients with compensated HCV-related cirrhosis and sustained virological response after direct-acting antiviral therapy. Patients underwent liver and spleen stiffness measurement, abdominal ultrasound and oesophago-gastroduodenoscopy. Clinical and laboratory data and non-invasive markers such as the liver stiffness–spleen diameter to platelet ratio score, variceal risk index and platelet count to spleen diameter ratio were analyzed.
ResultsNinety-seven consecutive patients were included. Liver stiffness measurement (12.2 vs 16; p=0.02), spleen stiffness measurement (39.4 vs 46.05; p=0.04), liver stiffness–spleen diameter to platelet ratio score (1.21 vs 2.02; p=0.008), platelet count to spleen diameter ratio (1102.19 vs 829.7; p=0.04) and variceal risk index (−3.4 vs −1.02; p=0.01) showed significant differences between patients without/with gastroesophageal varices. The best cut-off value to discard the presence of gastroesophageal varices was 12.3kPa for liver stiffness measurement and 27kPa for spleen stiffness measurement. However, diagnostic accuracy was moderate (AUROC: 0.671 and 0.624 respectively). Combining different non-invasive parameters did not significantly improve the overall performance.
DiscussionLiver and spleen stiffness measurement showed suboptimal results for non-invasive assessment of gastroesophageal varices in HCV cirrhotic patients treated with direct-acting antiviral agents. Our results suggest that non-invasive methods cannot substitute standard procedures for predicting gastroesophageal varices in this population.
El objetivo de este estudio fue evaluar la rigidez hepática y esplénica medidas con Fibroscan® para la predicción de várices esofágicas (VE), en pacientes con cirrosis hepática por VHC tratados con antivirales orales.
Pacientes y métodosEstudio observacional y transversal que incluyó pacientes con cirrosis hepática por VHC compensada y respuesta virológica sostenida tras tratamiento. Se recogieron datos clínico-analíticos, ecográficos y endoscópicos y marcadores no invasivos como el Fibroscan® hepático y esplénico, el modelo predictivo «Liver stiffness-spleen diameter to platelet ratio score» (LSPS), el «Varices Risk Index» (VRI) y el índice n° plaquetas/diámetro mayor del bazo.
ResultadosSe incluyeron 97 pacientes consecutivos. Los valores del Fibroscan® hepático (12,2 vs. 16; p = 0,02), esplénico (39,4 vs. 46,05; p = 0,04), LSPS (1,21 vs. 2,02; p = 0,008), índice n.° plaquetas/diámetro mayor del bazo (1.102,19 vs. 829,7; p = 0,04) y VRI (-3,4 vs. -1,02; p = 0,01) mostraron diferencias significativas entre pacientes sin/con VE. El mejor punto de corte del fibroscán hepático y esplénico para descartar la presencia de várices fue 12,3 y 27 kPas, respectivamente, con precisión diagnóstica moderada (AUROC: 0,671 y 0,624, respectivamente). La combinación de los parámetros no invasivos no mejoró el rendimiento global de estas pruebas.
DiscusiónLos valores del Fibroscan® hepático y esplénico mostraron resultados subóptimos para la evaluación no invasiva de VE en pacientes cirróticos por VHC tratados con antivirales orales. Nuestros resultados sugieren que estas pruebas no pueden sustituir a los procedimientos estándar para predecir la presencia de várices en esta subpoblación.
Liver and spleen stiffness measurement (LSM, SSM) have been widely investigated for the prediction of portal hypertension and gastroesophageal varices (GEV) in the past years. Nowadays, LSM by transient elastography (TE) represents a rapid and non-invasive method to predict portal hypertension, preventing unnecessary endoscopies in patients with cirrhosis of various etiologies. According to Baveno VI consensus conference, the combination of an LSM of less than 20kPa measured by TE and a platelet count of more than 150,000 per μl can exclude patients with high-risk GEV.1 Nevertheless, studies have shown that the correlation between LSM and more advanced stages of portal hypertension (HVPG>12mmHg) decreases markedly, probably due to the contribution of extrahepatic factors such as splanchnic vasodilation.2 On the other hand, spleen vascular resistance is increased in patients with portal hypertension, and splenomegaly is a common finding in these patients because of congestion, hyperplasia of lymphoid tissue and increased angiogenesis and fibrogenesis.3 It has been reported that the spleen is stiffer than the liver in patients with cirrhosis4 and has a closer correlation with the presence and size of GEV when compared to LSM.5,6
Until now, several studies have addressed the correlation of LSM and liver fibrosis index in HCV patients treated with new direct-acting antiviral agents (DAA)7,8 for the presence of portal hypertension, with contradictory results. We do not know how changes in liver stiffness after obtaining a sustained virological response (SVR) accurately correlates with changes in portal hypertension or residual liver fibrosis. In addition, its effects on spleen stiffness are less known and remain an interesting area of research. Overall, our ability to predict the presence of esophageal varices through the use of non-invasive methods (hepatic and splenic elastography) is still uncertain in this group of patients.
The aim of our study was to assess the performance of LSM and SSM measured by TE in ruling out the presence of GEV in patients with HCV-related compensated cirrhosis who achieved an SVR after DAA therapy.
Patients and methodsPatients and study designThe study was performed in a tertiary center. A total of 97 patients with HCV-associated cirrhosis treated with DAA and no previous clinical decompensation were consecutively included in the study, from January 2017 to February 2019. All patients had achieved SVR, defined as an undetectable HCV-RNA 12 weeks after the end of treatment. Diagnosis of liver cirrhosis was based on a combination of clinical, biochemical, and radiological findings and all patients had a previous liver fibroscan above 12.5kPas9 before antiviral therapy administration Laboratory data regarding liver function were collected. A standard abdominal ultrasound (US) was performed the same day of LSM and SSM by an experienced operator, and different US parameters were also analyzed (e.g., spleen bipolar and anteroposterior diameter, diameter of the portal trunk, portal vein flow). Each patient was also assessed for waist diameter and body mass index (BMI).
No patient enrolled in the study had acute liver disease, coinfection with other virus or any other cause of cirrhosis rather than HCV. Furthermore, no patient was under any treatment that could affect portal hypertension such as non-selective beta blockers, diuretics or endoscopic band ligation at the time of the study. Also, clinical conditions potentially affecting TE (e.g., cardiac failure, alcohol abuse) were excluded. The local ethics committee approved the study protocol which was conducted in accordance with the 1975 Declaration of Helsinki and Good Clinical Practice guidelines. All patients signed informed written consent.
Upper endoscopic examinationA standard endoscopic examination was performed within six months of inclusion in the study to establish the relationship between non-invasive methods and the presence of GEV. The endoscopic findings were recorded and graded as small varices (straight GEV) and large varices (tortuous GEV not flattened by air insufflation).10 The presence of red signs was also recorded in all patients. According to the Baveno VI criteria, patients were considered to have high-risk varices when they had large varices or small varices with red signs.1
Measurement of liver stiffnessLSM values were assessed using the FibroScan® (Fibroscan; Echosens, Paris, France) after at least 6h of fasting and after a complete abdominal US examination. M or XL probes were used following manufacturer recommendations (based on the amount of subcutaneous fat and skin-liver capsule distance). For each patient, liver stiffness values were accepted if ten successful measurements were available, the success rate was at least 60%, and the interquartile range (IQR) was<30% of the median value.11
Measurement of spleen stiffnessSSM values were obtained using the same probe and software used to perform LSM after at least 6h of fasting and under US assistance. In the absence of guidelines for the measurement of spleen stiffness by FibroScan®, the same guidelines for the measurement of liver stiffness were applied. Reliable results for spleen stiffness have not been yet validated, so same criteria for LSM were applied. Possible factors related to an invalid value were also collected, such as splenic parenchymal thickness, severe obesity, or the absence of an adequate intercostal space for the use of the FibroScan® probe.
Non-invasive scores of GEVPlatelet count to spleen diameter ratio (PSR), as proposed by Giannini et al.,12 and the model proposed by Kim et al. (LSPS) calculated according to the formula LSM x spleen diameter/platelet count,13 were also obtained for each patient. We also analyzed the index proposed by Berzigotti et al. called variceal risk index (VRI), that included LSM, platelet count, and spleen diameter using the following formula: −4.364–0.538×spleen diameter−0.049×platelet count−0.044×LSM+[0.001×LSM×platelet count].14
Statistical analysesCategorical variables are expressed as frequency (percentages) and continuous variables as median (25th percentile–75th percentile). For statistical analyses, differences between categorical variables were assessed by Chi-square test or Fisher's exact test, when necessary. Continuous variables were compared using U-Mann–Whitney test. Receiver operating characteristic (ROC) curves were calculated for each of the diagnostic parameters evaluated, and each area under the ROC curve (AUROC) was computed [95% confidence interval (CI)]. The Youden index was used to determine the cut-off points for the variables (non-invasive methods to rule out the presence of GEV) looking for the value that satisfies the highest sensitivity and specificity. The respective cutoff values were selected according to the aim of the test, to rule out the target disease or condition, choosing the highest positive predictive value (PPV) and lowest negative likelihood ratio (LR−). Sensitivity (Se), specificity (Sp), PPV, negative predictive value (NPV), lowest positive likelihood ratio (LR+), and LR− with their 95% confidence intervals (CIs) were calculated at each cutoff. The comparison of the effectiveness of the diagnostic tests of the chosen cut-off points to detect the presence of GEV was done using test equality of ROC areas. p values below 0.05 were considered statistically significant. Statistical analyses were performed using SPSS 19.0 (SPSS software, SPSS Inc., Chicago, IL, USA) and R Core Team (2015 R: A language and environment for statistical computing. R Foundation for Statistical Computing, Vienna, Austria. URL http://www.R-project.org/).
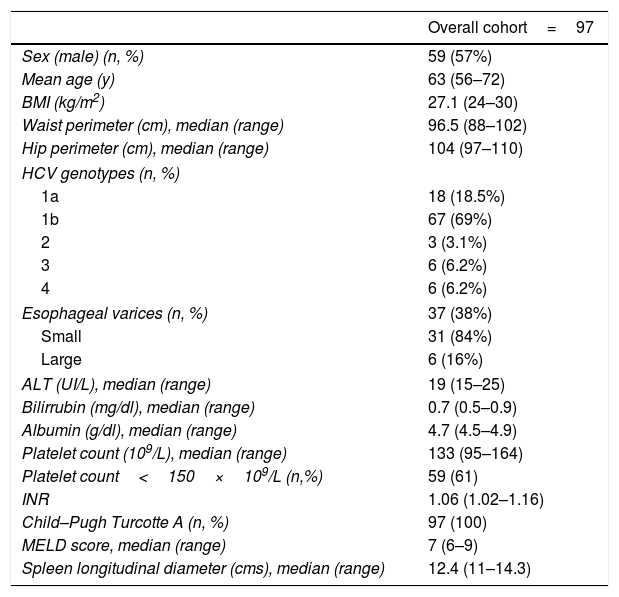
ResultsBaseline characteristics of patients with HCV-related cirrhosis included are described in Table 1. Of the 97 patients enrolled, 24 had an invalid spleen and/or liver stiffness measurement. In 17 patients SSM was unreliable mainly due to spleen size, and in 3 cases, SSM could not be performed due to small intercostal space or interposition of lung or colonic gas, making it not measurable. LSM was invalid in 4 patients as a result of a small intercostal space. We analyzed different variables that could be related to an unsuccessful liver or spleen stiffness value, such as BMI, depth from skin, waist diameter, spleen longitudinal and anteroposterior diameter, and spleen area. In the multivariate analysis, only a spleen area<45cm2 (p=0.007) and an anteroposterior diameter<4cm (p=0.04) were independently associated with an unreliable SSM (odds ratio [OR] 5.61 [1.62; 19.468] and 2.97 [1.244; 10.565] respectively). BMI, distance to skin and spleen diameter<12cm were not associated with a higher risk of an invalid measurement (p=NS).
Baseline characteristics of the study cohort.
| Overall cohort=97 | |
|---|---|
| Sex (male) (n, %) | 59 (57%) |
| Mean age (y) | 63 (56–72) |
| BMI (kg/m2) | 27.1 (24–30) |
| Waist perimeter (cm), median (range) | 96.5 (88–102) |
| Hip perimeter (cm), median (range) | 104 (97–110) |
| HCV genotypes (n, %) | |
| 1a | 18 (18.5%) |
| 1b | 67 (69%) |
| 2 | 3 (3.1%) |
| 3 | 6 (6.2%) |
| 4 | 6 (6.2%) |
| Esophageal varices (n, %) | 37 (38%) |
| Small | 31 (84%) |
| Large | 6 (16%) |
| ALT (UI/L), median (range) | 19 (15–25) |
| Bilirrubin (mg/dl), median (range) | 0.7 (0.5–0.9) |
| Albumin (g/dl), median (range) | 4.7 (4.5–4.9) |
| Platelet count (109/L), median (range) | 133 (95–164) |
| Platelet count<150×109/L (n,%) | 59 (61) |
| INR | 1.06 (1.02–1.16) |
| Child–Pugh Turcotte A (n, %) | 97 (100) |
| MELD score, median (range) | 7 (6–9) |
| Spleen longitudinal diameter (cms), median (range) | 12.4 (11–14.3) |
BMI: body mass index; ALT: alanine aminotransferase; INR: international normalized ratio; MELD: Model for End-stage Liver Disease.
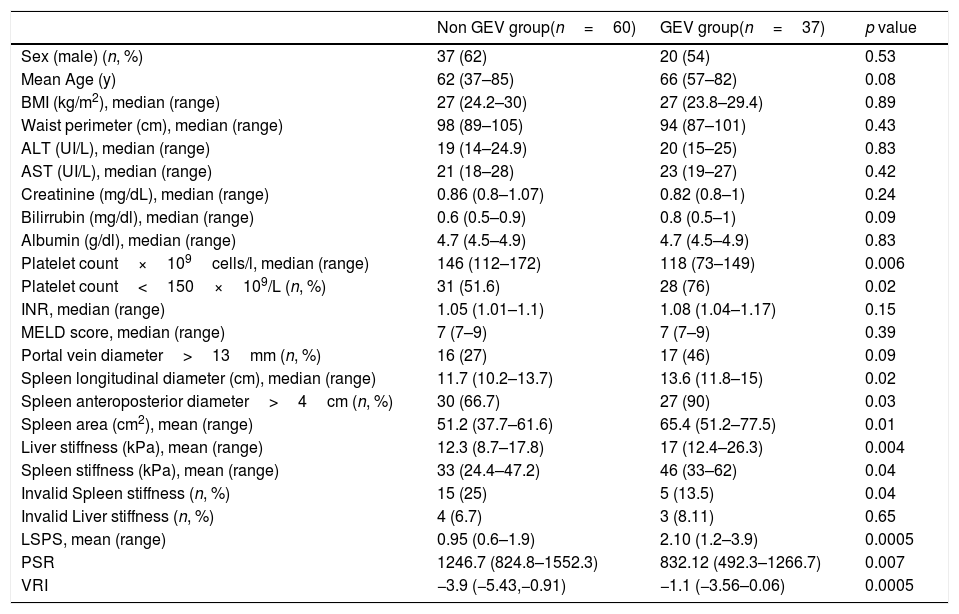
Thirty-seven of the 97 patients (38%) had varices. Of these, 31 (84%) had small, and 6 (16%) large varices. Patients with GEV were compared with patients without GEV (Table 2). As shown, median values obtained with all the non-invasive tests such as LSM, SSM, LSPS, PSR and VRI were significantly different when comparing patients without and with GEV. As expected, median values of LSM and SSM were significantly higher in patients with GEV compared to those without. Fig. 1 shows distribution of LSM and SSM values in patients with and without GEV. Nevertheless, these differences were not maintained when considering different GEV subgroups [small vs. high-risk varices (7 patients)]. In particular, median values for LSM in patients with small varices compared to high-risk varices were 15 vs. 21.1kPa respectively, and for SSM 45.7 vs. 47.2kPa (p=NS). On the other hand, when comparing laboratory and US parameters, patients with GEV showed more frequently thrombocytopenia and splenomegaly than patients without GEV, while mean values of liver function tests (albumin, bilirubin, international normalized ratio, Child–Pugh classification) were not significantly different between patients with and without GEV.
Main clinical features of the study cohort according to the presence of GEV.
| Non GEV group(n=60) | GEV group(n=37) | p value | |
|---|---|---|---|
| Sex (male) (n, %) | 37 (62) | 20 (54) | 0.53 |
| Mean Age (y) | 62 (37–85) | 66 (57–82) | 0.08 |
| BMI (kg/m2), median (range) | 27 (24.2–30) | 27 (23.8–29.4) | 0.89 |
| Waist perimeter (cm), median (range) | 98 (89–105) | 94 (87–101) | 0.43 |
| ALT (UI/L), median (range) | 19 (14–24.9) | 20 (15–25) | 0.83 |
| AST (UI/L), median (range) | 21 (18–28) | 23 (19–27) | 0.42 |
| Creatinine (mg/dL), median (range) | 0.86 (0.8–1.07) | 0.82 (0.8–1) | 0.24 |
| Bilirrubin (mg/dl), median (range) | 0.6 (0.5–0.9) | 0.8 (0.5–1) | 0.09 |
| Albumin (g/dl), median (range) | 4.7 (4.5–4.9) | 4.7 (4.5–4.9) | 0.83 |
| Platelet count×109cells/l, median (range) | 146 (112–172) | 118 (73–149) | 0.006 |
| Platelet count<150×109/L (n, %) | 31 (51.6) | 28 (76) | 0.02 |
| INR, median (range) | 1.05 (1.01–1.1) | 1.08 (1.04–1.17) | 0.15 |
| MELD score, median (range) | 7 (7–9) | 7 (7–9) | 0.39 |
| Portal vein diameter>13mm (n, %) | 16 (27) | 17 (46) | 0.09 |
| Spleen longitudinal diameter (cm), median (range) | 11.7 (10.2–13.7) | 13.6 (11.8–15) | 0.02 |
| Spleen anteroposterior diameter>4cm (n, %) | 30 (66.7) | 27 (90) | 0.03 |
| Spleen area (cm2), mean (range) | 51.2 (37.7–61.6) | 65.4 (51.2–77.5) | 0.01 |
| Liver stiffness (kPa), mean (range) | 12.3 (8.7–17.8) | 17 (12.4–26.3) | 0.004 |
| Spleen stiffness (kPa), mean (range) | 33 (24.4–47.2) | 46 (33–62) | 0.04 |
| Invalid Spleen stiffness (n, %) | 15 (25) | 5 (13.5) | 0.04 |
| Invalid Liver stiffness (n, %) | 4 (6.7) | 3 (8.11) | 0.65 |
| LSPS, mean (range) | 0.95 (0.6–1.9) | 2.10 (1.2–3.9) | 0.0005 |
| PSR | 1246.7 (824.8–1552.3) | 832.12 (492.3–1266.7) | 0.007 |
| VRI | −3.9 (−5.43,−0.91) | −1.1 (−3.56–0.06) | 0.0005 |
GEV: gastroesophageal varices; BMI: body mass index; ALT: alanine aminotransferase; AST: aspartate aminotransferase; INR: international normalized ratio; MELD: Model for End-stage Liver Disease; LSPS: liver stiffness–spleen diameter to platelet ratio score; PSR: platelet count to spleen diameter ratio; VRI: variceal risk index.
 and spleen stiffness (B) values in patients with or without GEV. The rule out cut-off values is also shown.")
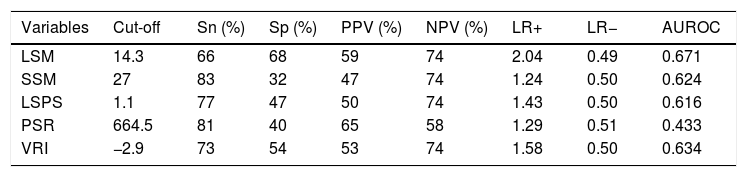
AUROC to rule out the presence of GEV for all the non-invasive parameters were calculated (Fig. 2). According to quality standards, only valid liver and spleen stiffness were considered for this purpose. By using ROC curves, we calculated the cut-off value to discard the target clinical feature (corresponding to the highest sensitivity and negative predictive value, NPV). Results are shown in Table 3. The AUROCs obtained from all the non-invasive tests did not show significant differences (p 0.207). The best cut-off values to rule out the presence of GEV were 12.3kPa for LSM and 27kPa for SSM (illustrated in Fig. 1). However, diagnostic accuracy was just acceptable (AUROC of 0.671 and 0.624 respectively). In case an LSM value<12.3kPa an SSM value<27kPa were used as a screening test for the indication of esophagogastroduodenoscopy, only 1 patient with high-risk varices would have wrongly avoided endoscopy in our cohort.
; --, liver stiffness measurement (LSM); --, spleen stiffness measurement (SSM); --, variceal risk index (VRI); --, platelets; --, reference line).")
Area under receiver operating characteristics curves from non-invasive parameters (--, liver stiffness–spleen diameter to platelet ratio score (LSPS); --, liver stiffness measurement (LSM); --, spleen stiffness measurement (SSM); --, variceal risk index (VRI); --, platelets; --, reference line).
Analysis of non-invasive methods for ruling out the presence of GEV.
| Variables | Cut-off | Sn (%) | Sp (%) | PPV (%) | NPV (%) | LR+ | LR− | AUROC |
|---|---|---|---|---|---|---|---|---|
| LSM | 14.3 | 66 | 68 | 59 | 74 | 2.04 | 0.49 | 0.671 |
| SSM | 27 | 83 | 32 | 47 | 74 | 1.24 | 0.50 | 0.624 |
| LSPS | 1.1 | 77 | 47 | 50 | 74 | 1.43 | 0.50 | 0.616 |
| PSR | 664.5 | 81 | 40 | 65 | 58 | 1.29 | 0.51 | 0.433 |
| VRI | −2.9 | 73 | 54 | 53 | 74 | 1.58 | 0.50 | 0.634 |
Sn: sensitivity; SP: specificity; PPV: positive predictive value; NPV: negative predictive value; LR: likelihood ratio; AUROC: area under receiver operating curve; LSM: liver stiffness measurement; SSM: spleen stiffness measurement; LSPS: liver stiffness–spleen diameter to platelet ratio score; PSR: platelet count to spleen diameter ratio; VRI: variceal risk index.
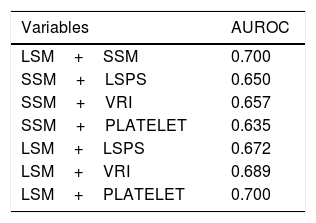
Furthermore, we attempted to appreciate the performance of different combinations among the non-invasive parameters in predicting the absence of GEV. When we combined both TE measurements from liver and spleen, and TE measurements with LSPS or VRI, we observed a marginal overall improvement to exclude the presence of GEV, although of uncertain significance (results are shown in Table 4). We could not find any benefit in the case of adding PSR to the Fibroscan® results. Moreover, when we added platelet count>150,000mm3 to LSM or SSM cut-off values to improve their performance to rule out the presence of GEV, a modest but not significant benefit was obtained (AUROC of 0.690 and 0.670 respectively).
Analysis of different combinations of non-invasive methods.
| Variables | AUROC |
|---|---|
| LSM+SSM | 0.700 |
| SSM+LSPS | 0.650 |
| SSM+VRI | 0.657 |
| SSM+PLATELET | 0.635 |
| LSM+LSPS | 0.672 |
| LSM+VRI | 0.689 |
| LSM+PLATELET | 0.700 |
LSM: liver stiffness measurement; SSM: spleen stiffness measurement; LSPS: liver stiffness–spleen diameter to platelet ratio score; VRI: variceal risk index; PLATELET: platelet count>150×109/L.
Finally, we analyzed if there were significant changes in LSM and SSM in two subgroups of patients: those who had finished DAA treatment before six months from inclusion in the study, and those who had completed treatment at least after six months from enrollment. Eighty-eight (91%) patients were included six months or more after the end of treatment with DAA [67 (76%) of them had finished more than one year ago]. Only 9 (10%) had recently stopped (< six months). We did not observe significant changes among the two periods, neither in liver (p 0.17) or spleen stiffness values (p 0.99).
DiscussionNowadays, liver cirrhotic patients with portal hypertension can be detected using non-invasive methods. Several studies have proposed different non-invasive tests to predict GEV in patients with cirrhosis from various etiologies.15–18 In a recent meta-analysis of 15 studies, LSM assessed by TE identified the presence of GEV with a sensitivity of 84% and a specificity of 62%.19 Moreover, SSM has been reported to have even superior predictive accuracy compared to LSM.5,6,20 Recently, different screening strategies combining liver and spleen stiffness cut-offs for ruling out GEV have been proposed.21,22 Nevertheless, no cut-off values have been validated in HCV cirrhotic patients who have received DAA regimens, a population steadily growing in our daily practice. Regarding impact in portal hypertension, Lens et al. showed in a cohort of cirrhotic patients with clinical significant portal hypertension (CSPH) treated with DAA, a reduction in hepatic venous pressure gradient (HVPG), although more than two-thirds of patients remained with CSPH at 24 weeks after SVR.7 They also analyzed changes in LSM before treatment and after SVR, concluding that changes in LSM in this population did not correlate with HVPG and previous cut-off values were not reliable in ruling out CSPH. Recently, this group has evaluated, in the same cohort of patients, the impact of SVR during a longer period of follow-up (96 weeks after SVR).23 They have found a further decrease in HVPG, but still 53–65% of patients persisted with CSPH at the end of the study. LSM failed to correlate adequately with changes in HVPG and only a modest reduction was observed during this period.
In our study, all tested scores did not reach an optimal accuracy, with a moderate performance for excluding GEV. LSM and VRI appeared to be the best, with an AUROC closer to 0.7. However, when we compared the different AUROC values with the homology test (excluding PSR) there is no significant difference between them.
Regarding LSM, we have obtained a different liver stiffness cut-off value (12.3kPa) for ruling out GEV compared to those described in previous reports. An LSM value up to 13.3kPa is likely to exclude CSPH, while a TE value of at least 21.1kPa seems to predict CSPH accurately.24 The lower cut off value obtained in the present study could be partially explained by the effect on tissue inflammation produced with DAA due to rapid viral suppression. In fact, the mean value of LSM in our patients with GEV was 16kPa, much lower than suspected in patients with CSPH. In our study, most of the patients had already finished DAA treatment for more than six months since inclusion (91%), and the effect on tissue inflammation by DAA treatment is observed in the first months after the start of therapy.7 Pons et al. showed in a cohort of 41 HCV patients how LSM decreased very early during treatment with DAA, as soon as the first four weeks of treatment suggesting that this could be explained by a reduction in liver inflammation more than fibrosis.25 It is very likely that the lowest final cut-off value obtained for excluding GEV could be related to a lower baseline TE value due to this additional decrease observed because of the rapid reduce inflammation produced by DAA.
As for spleen stiffness, the cut-off value obtained (27kPa) to rule out GEV is also lower to those suggested in other studies. Our mean values for both patients with and without GEV are also lower than those reported previously.6 Whether DAA treatment has any effect on portal hypertension and spleen stiffness is still a matter of debate. Knop et al. evaluated liver and spleen stiffness changes in 54 patients with HCV associated cirrhosis and SVR after DAA therapy,26 reporting neither significant changes between baseline and end of treatment (EOT) nor 24 weeks after EOT. SSM measured by Fibroscan® showed an early reduction during the first four weeks of therapy in the study done by Pons et al., but not during the rest of the follow-up, pointing out also an effect on spleen inflammation or decrease in lymphoid tissue infiltration rather than in portal hypertension.25 Lens et al. did not include SSM but showed an overall HVPG decrease from 15 before treatment to 13mmHg after SVR, with a significant HVPG reduction when evaluated one year after EOT (13% mean reduction).7 On the other hand, the diagnostic accuracy of SSM obtained in our study was not as good as expected. This could be related to several factors. First of all, a higher rate of invalid measurements when Fibroscan® was applied to the spleen compared to the liver (21% vs 7% respectively) as a result that the probes are designed for the liver, and not for the spleen. Studies have shown that the spleen is substantially stiffer than the liver, both in healthy subjects and in patients with cirrhosis,3 which leaves a variable number of cases reaching the maximum of 75kPa where risk cannot be stratified. Excluding this technical issue, when analyzing different variables that could be related to an unsuccessful measurement, spleen enlargement in terms of area (cm2) and anteroposterior diameter (cm) was independently associated with a valid SSM. This has already been suggested in previous studies and, nowadays, is considered an important condition for SSM success.5,6 However, splenomegaly is present in 65–80% of patients with cirrhosis, leaving a number of cases were spleen remains not suitable for TE.27
Finally, it has been extensively documented that LSM or SSM should not be used alone to exclude the presence of GEV. Combined methods remain an important tool to increase diagnostic accuracy of TE. Colecchia et al. have shown that Baveno VI strategy combined with an SSM≤46kPa is better than Baveno VI criteria alone for ruling out high-risk varices in patients with advanced chronic liver disease of any etiology.22 Nevertheless, in our study, we were not able to find a significant benefit when combining different non-invasive tests. LSM combined with SSM showed a subtle improvement in the accuracy to exclude GEV, as well as the combination of LSM/SSM with LSPS or VRI. We have not found a proper explanation for these findings.
This study presents some limitations. We have included a small sample size of patients, and the results obtained so far should be externally validated in a larger cohort. In addition, our population includes different time with DAA at baseline (time interval between treatment with DAA and inclusion was not standardized), although as mentioned above, two-thirds of them had already finished DAA treatment at least one year ago. Moreover, only seven patients included in the study had high-risk varices, which did not allow us to obtain specific data on the performance of TE and other non-invasive markers in this subgroup. Our results may indicate that the use of non-invasive methods to predict GEV in a subgroup of patients who, in most cases, have incipient portal hypertension with none or minor hyperdynamic circulation, area unable to detect the presence of low-size GEV.
In conclusion, non-invasive methods (LSM and/or SSM) showed suboptimal results for the assessment of GEV in HCV cirrhotic patients treated with DAA. Until more information is available, the screening of GEV should still be performed by upper endoscopy.
Conflict of interestNone.
The present investigation has not received financial support from agencies from the public sector, commercial sector or non-profit entities.
