


Timely identification of patients with acute pancreatitis who are likely to have a severe disease course is critical. Based on that, many scoring systems have been developed throughout the years. Although many of them are currently in use, none of them has been proven to be ideal. In this study, we aimed to compare the discriminatory power of relatively newer risk scores with the historical ones for predicting in-hospital major adverse events, 30-day mortality and 30-day readmission rate.
Patients and methodsPatients who had been admitted due to acute pancreatitis were retrospectively investigated. Five risk scoring systems including HAPS, Ranson, BISAP, Glasgow, and JSS were calculated using the data of the first 24h of admission. Predictive accuracy of each scoring system was calculated using the area under the receiver-operating curve method.
ResultsOverall 690 patients were included in the study. In-hospital major adverse events were observed in 139 (20.1%) patients of whom, 19 (2.5%) died during hospitalization. 30-day all-cause mortality and 30-day readmission were observed in 22 (3.2%) and 27 (3.9%) patients respectively. Negative predictive value of each score was markedly higher compared to positive predictive values. Among all, JSS scoring system showed the highest AUC values across all end-points (0.80 for in-hospital major adverse events; 0.94 for in-hospital mortality; 0.91 for 30-day mortality). However, all five scoring systems failed to predict 30-day readmission.
DiscussionJSS was the best classifier among all five risk scoring systems particularly owing to its high sensitivity and negative predictive value.
Identificar oportunamente a los pacientes con pancreatitis aguda con mayor probabilidad de evolución negativa de la enfermedad. Esto ha motivado el desarrollo de numerosos sistemas de puntuación a lo largo de los años. Aunque muchos de ellos siguen utilizándose en la actualidad, ninguno ha demostrado ser idóneo. En este estudio se pretende comparar la capacidad discriminatoria de puntuaciones de riesgo relativamente recientes con puntuaciones históricas, en cuanto a su capacidad de predicción de acontecimientos adversos graves durante la hospitalización, mortalidad a 30 días y tasa de reingreso a 30 días.
Pacientes y métodosSe investigó retroactivamente a pacientes ingresados por pancreatitis aguda. Se aplicaron 5 sistemas de puntuación: HAPS, Ranson, BISAP, Glasgow y JSS, utilizando datos correspondientes a las primeras 24h después del ingreso. Se calculó la precisión predictiva de cada sistema de puntuación empleando el método de área bajo la curva de característica operativa del receptor.
ResultadosEl estudio se realizó en un total de 690 pacientes. Se observaron acontecimientos adversos graves durante la hospitalización en 139 pacientes (20,1%) de los pacientes, de los cuales 19 (2,5%) fallecieron. Se observó mortalidad por cualquier causa a los 30 días y readmisión a los 30 días en 22 (3,2%) y 27 (3,9%) pacientes, respectivamente. El valor predictivo negativo de cada puntuación fue notablemente mayor en comparación con los valores predictivos positivos. De entre todos ellos, el sistema de puntuación JSS mostró los valores de área bajo la curva (AUC) más altos entre todos los criterios de valoración (0,80 para acontecimientos adversos graves durante la hospitalización; 0,94 para la mortalidad durante la hospitalización; 0,91 para la mortalidad a 30 días). Sin embargo, los 5 sistemas de puntuación fracasaron en la predicción de los reingresos a 30 días.
ValoraciónEl JSS fue el mejor sistema de clasificación de entre los 5 sistemas de puntuación de riesgos, particularmente debido a su alta sensibilidad y valor predictivo negativo.
Acute pancreatitis (AP) is one of the leading cause of hospitalization in gastroenterology.1 Although the majority have a mild course, 20% of the patients develop severe complications such as pancreatic necrosis, infection, sepsis and multiorgan failure.2 Numerous scoring systems have been developed in order to predict those who would have severe AP so that the management can be tailored accordingly in the early course of the disease. However, no single scoring system is ideal. For instance, Ranson being as the most validated scoring system has been used for more than three decades and yet it has significant drawbacks such as the need to wait at least 48h for complete calculation.3 The Bedside Index for Severity in Acute Pancreatitis (BISAP) score which incorporates five different parameters, does not include imaging of the pancreas and thus ignores local complications and necrosis.4 Acute Physiology and Chronic Health Examination (APACHE II) is another widely used scoring system which was originally developed for patients admitted to the intensive care unit and later adapted for AP.5 Although it was shown to have modest predictive capability, the complexity of its calculation and not being unique to AP are its limitations. Japanese severity score (JSS) which was revised in 2009 and later validated in multicentre studies is one of the latest.6 Until now, their comparative efficacy was tested in a small number of patients and most of these calculations were not carried out solely based on the findings of the first day of the admission.7,8 In addition, many of these studies did not include the latest risk scores like BISAP, JSS or harmless acute pancreatitis score (HAPS).9
In this study, we aimed to compare the predictive efficacy of several scoring systems (HAPS, Ranson, BISAP, Glasgow, JSS) in a large cohort using the data of the first day of admission only and also test the discriminatory power of these scores for 30-day mortality and 30-day readmission.
Patients and methodsPatientsDemographic, radiographic, and laboratory data of all patients who had been admitted with AP between January 2013 and December 2018 were retrospectively analyzed. Patients with incomplete data or those transferred from an outside hospital and thus not presenting within the first 24h of diagnosis were excluded from the study. The diagnosis of acute pancreatitis was established based on the revised Atlanta criteria in which at least two of the following findings – abdominal pain, elevated serum amylase/lipase (>3 times upper limit of normal) and characteristic findings in imaging – were required. Ethical board approval was obtained from the institutional review board.10
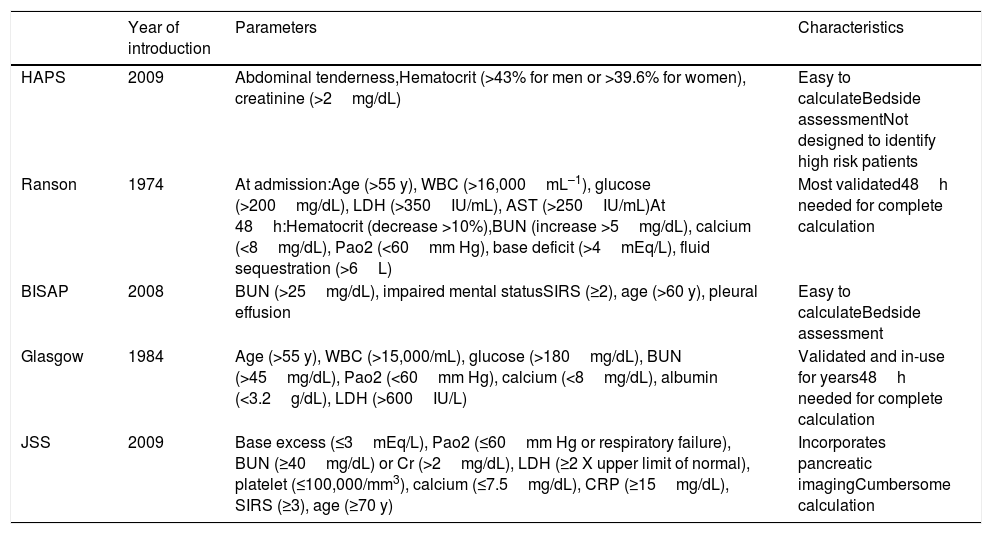
Risk scoresFive risk scoring systems that have been developed to predict the severity of AP were calculated and compared to each other: HAPS, Ranson, BISAP, Glasgow, and JSS. The parameters involved and the calculation of these risk scoring systems are presented in Table 1.11 All risk scores were calculated using the data of the first 24h of admission.
Characteristics of scoring systems.
| Year of introduction | Parameters | Characteristics | |
|---|---|---|---|
| HAPS | 2009 | Abdominal tenderness,Hematocrit (>43% for men or >39.6% for women), creatinine (>2mg/dL) | Easy to calculateBedside assessmentNot designed to identify high risk patients |
| Ranson | 1974 | At admission:Age (>55 y), WBC (>16,000mL–1), glucose (>200mg/dL), LDH (>350IU/mL), AST (>250IU/mL)At 48h:Hematocrit (decrease >10%),BUN (increase >5mg/dL), calcium (<8mg/dL), Pao2 (<60mm Hg), base deficit (>4mEq/L), fluid sequestration (>6L) | Most validated48h needed for complete calculation |
| BISAP | 2008 | BUN (>25mg/dL), impaired mental statusSIRS (≥2), age (>60 y), pleural effusion | Easy to calculateBedside assessment |
| Glasgow | 1984 | Age (>55 y), WBC (>15,000/mL), glucose (>180mg/dL), BUN (>45mg/dL), Pao2 (<60mm Hg), calcium (<8mg/dL), albumin (<3.2g/dL), LDH (>600IU/L) | Validated and in-use for years48h needed for complete calculation |
| JSS | 2009 | Base excess (≤3mEq/L), Pao2 (≤60mm Hg or respiratory failure), BUN (≥40mg/dL) or Cr (>2mg/dL), LDH (≥2 X upper limit of normal), platelet (≤100,000/mm3), calcium (≤7.5mg/dL), CRP (≥15mg/dL), SIRS (≥3), age (≥70 y) | Incorporates pancreatic imagingCumbersome calculation |
Abbreviations: AST: aspartate aminotransferase; BISAP: beside index of severity in acute pancreatitis; BUN: blood urea nitrogen; CRP: C-reactive protein; HAPS: harmless acute pancreatitis score; JSS: Japanese severity score; LDH: lactate dehydrogenase; SIRS: systemic inflammatory response syndrome; WBC: white blood cell count.
The main imaging method used in acute pancreatitis was abdominal computed tomography which was obtained in the first 24h of emergency department admission. Those who did not undergo computed tomographic imaging in the first 24h were not included in the study.
OutcomeIn-hospital major adverse events were the main outcome of the study. These included shock, organ failure lasting more than 48h (including acute renal failure), pancreatic necrosis, abscess formation, pleural effusion, sepsis, and death. Secondary outcomes included 30-day mortality and 30-day readmission rate.
Statistical analysisDescriptive analysis was reported as mean±standard deviation or median and interquartile ranges as appropriate for continuous data. Categorical variables were reported as numbers and percentages. Continuous variables were compared between groups using independent sample T-test or Mann–Whitney as appropriate. Distribution of data was assessed using the Kolmogorov–Smirnov test. Categorical data were compared using the chi-square or Fisher exact test. Predictive accuracy of each scoring system was measured by the area under the receiver-operating curve (AUC). Sensitivity, specificity, positive predictive value (PPV), and negative predictive value (NPV) were calculated for each scoring system. In addition, pairwise AUC comparisons were performed between scoring systems using the DeLong test (Medcalc trial version). A 2-tailed p-value <0.05 was considered statistically significant. Statistical analysis was performed using SPSS 20 software (SPSS Inc., Chicago, Illinois).
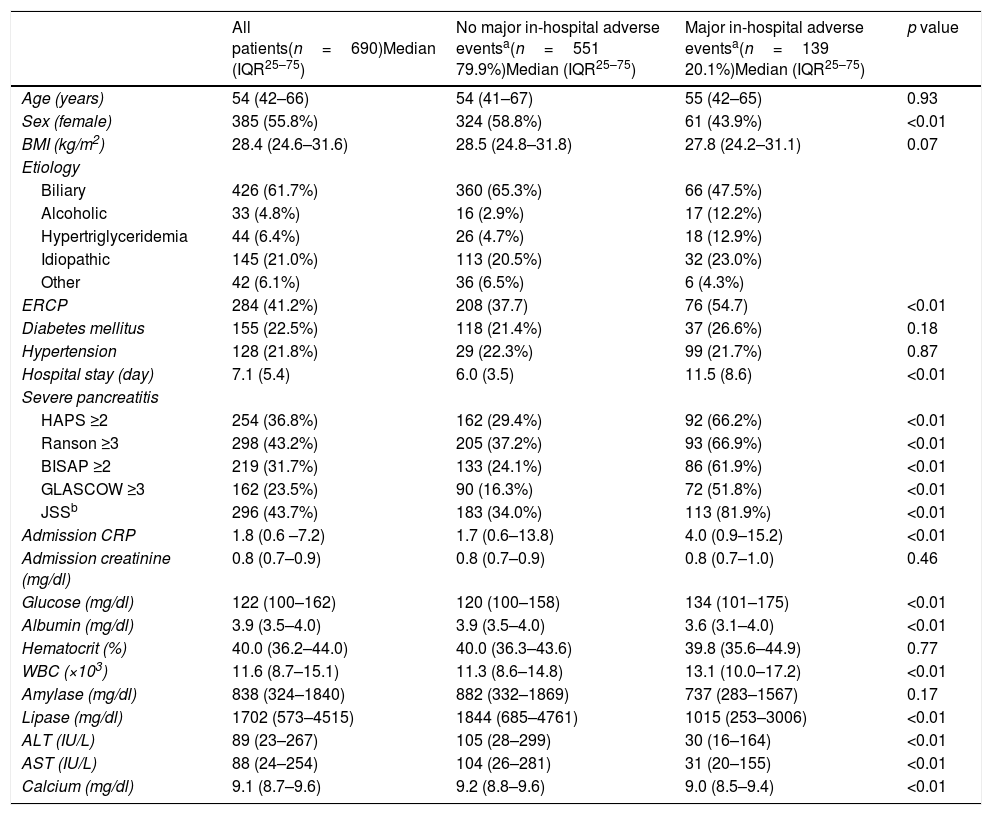
ResultsOverall 690 patients were included in the final analysis. Clinical characteristics and laboratory values are presented in Table 2. Median age was 54 (42–66) and 55.8% (n=385) of the patients were female. The most common etiology was biliary (n=426–61.7%). In-hospital major adverse events were observed in 139 (20.1%) patients of whom, 19 (2.5%) died during hospitalization. All five risk scoring systems had higher values in patients who developed in-hospital major adverse events (all p<0.01). While serum albumin, alanine transaminase, aspartate transaminase, lipase and calcium levels were lower in patients with major in-hospital major adverse events, blood glucose and white blood cell counts were significantly higher (all p<0.01). Admission hematocrit levels did not differ between the two groups.
Clinical characteristics and laboratory values of the study patients.
| All patients(n=690)Median (IQR25–75) | No major in-hospital adverse eventsa(n=551 79.9%)Median (IQR25–75) | Major in-hospital adverse eventsa(n=139 20.1%)Median (IQR25–75) | p value | |
|---|---|---|---|---|
| Age (years) | 54 (42–66) | 54 (41–67) | 55 (42–65) | 0.93 |
| Sex (female) | 385 (55.8%) | 324 (58.8%) | 61 (43.9%) | <0.01 |
| BMI (kg/m2) | 28.4 (24.6–31.6) | 28.5 (24.8–31.8) | 27.8 (24.2–31.1) | 0.07 |
| Etiology | ||||
| Biliary | 426 (61.7%) | 360 (65.3%) | 66 (47.5%) | |
| Alcoholic | 33 (4.8%) | 16 (2.9%) | 17 (12.2%) | |
| Hypertriglyceridemia | 44 (6.4%) | 26 (4.7%) | 18 (12.9%) | |
| Idiopathic | 145 (21.0%) | 113 (20.5%) | 32 (23.0%) | |
| Other | 42 (6.1%) | 36 (6.5%) | 6 (4.3%) | |
| ERCP | 284 (41.2%) | 208 (37.7) | 76 (54.7) | <0.01 |
| Diabetes mellitus | 155 (22.5%) | 118 (21.4%) | 37 (26.6%) | 0.18 |
| Hypertension | 128 (21.8%) | 29 (22.3%) | 99 (21.7%) | 0.87 |
| Hospital stay (day) | 7.1 (5.4) | 6.0 (3.5) | 11.5 (8.6) | <0.01 |
| Severe pancreatitis | ||||
| HAPS ≥2 | 254 (36.8%) | 162 (29.4%) | 92 (66.2%) | <0.01 |
| Ranson ≥3 | 298 (43.2%) | 205 (37.2%) | 93 (66.9%) | <0.01 |
| BISAP ≥2 | 219 (31.7%) | 133 (24.1%) | 86 (61.9%) | <0.01 |
| GLASCOW ≥3 | 162 (23.5%) | 90 (16.3%) | 72 (51.8%) | <0.01 |
| JSSb | 296 (43.7%) | 183 (34.0%) | 113 (81.9%) | <0.01 |
| Admission CRP | 1.8 (0.6 –7.2) | 1.7 (0.6–13.8) | 4.0 (0.9–15.2) | <0.01 |
| Admission creatinine (mg/dl) | 0.8 (0.7–0.9) | 0.8 (0.7–0.9) | 0.8 (0.7–1.0) | 0.46 |
| Glucose (mg/dl) | 122 (100–162) | 120 (100–158) | 134 (101–175) | <0.01 |
| Albumin (mg/dl) | 3.9 (3.5–4.0) | 3.9 (3.5–4.0) | 3.6 (3.1–4.0) | <0.01 |
| Hematocrit (%) | 40.0 (36.2–44.0) | 40.0 (36.3–43.6) | 39.8 (35.6–44.9) | 0.77 |
| WBC (×103) | 11.6 (8.7–15.1) | 11.3 (8.6–14.8) | 13.1 (10.0–17.2) | <0.01 |
| Amylase (mg/dl) | 838 (324–1840) | 882 (332–1869) | 737 (283–1567) | 0.17 |
| Lipase (mg/dl) | 1702 (573–4515) | 1844 (685–4761) | 1015 (253–3006) | <0.01 |
| ALT (IU/L) | 89 (23–267) | 105 (28–299) | 30 (16–164) | <0.01 |
| AST (IU/L) | 88 (24–254) | 104 (26–281) | 31 (20–155) | <0.01 |
| Calcium (mg/dl) | 9.1 (8.7–9.6) | 9.2 (8.8–9.6) | 9.0 (8.5–9.4) | <0.01 |
Abbreviations: ALT: alanine aminotransferase; AST: aspartate aminotransferase; BISAP: beside index of severity in acute pancreatitis; BMI: body mass index; CRP: C reactive protein; ERCP: endoscopic retrograde cholangiopancreatography; JSS: Japanese severity score; HAPS: harmless acute pancreatitis score; WBC: white blood cell count.
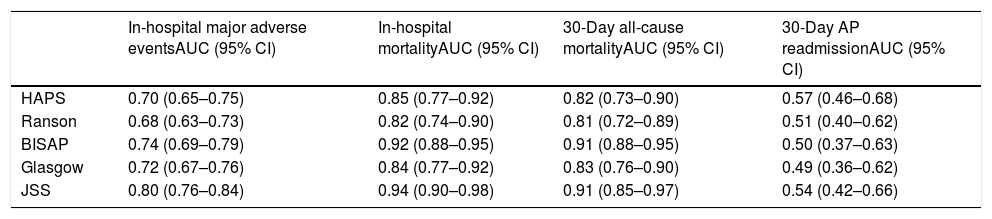
Thirty-day all-cause mortality and 30-day readmission were observed in 22 (3.2%) and 27 (3.9%) patients respectively. Receiver operator characteristic (ROC) analysis results are presented in Table 3 and Fig. 1. In addition to AUC values for in-hospital major adverse events which was the main outcome of the study, AUC values for in-hospital mortality were also provided separately. In addition to that, AUC values for 30-day mortality and 30-day readmission were also presented as the secondary outcome. The best classifier was the JSS scoring system which had the highest AUC values across all end-points (AUC=0.80, 0.94 and 0.91 for in-hospital major adverse events, in-hospital mortality and 30-day mortality respectively). However, all five scoring systems failed to predict 30-day readmission (AUC=0.49–0.57 all p>0.05).
ROC values of all risk scores for prediction of clinical outcomes.
| In-hospital major adverse eventsAUC (95% CI) | In-hospital mortalityAUC (95% CI) | 30-Day all-cause mortalityAUC (95% CI) | 30-Day AP readmissionAUC (95% CI) | |
|---|---|---|---|---|
| HAPS | 0.70 (0.65–0.75) | 0.85 (0.77–0.92) | 0.82 (0.73–0.90) | 0.57 (0.46–0.68) |
| Ranson | 0.68 (0.63–0.73) | 0.82 (0.74–0.90) | 0.81 (0.72–0.89) | 0.51 (0.40–0.62) |
| BISAP | 0.74 (0.69–0.79) | 0.92 (0.88–0.95) | 0.91 (0.88–0.95) | 0.50 (0.37–0.63) |
| Glasgow | 0.72 (0.67–0.76) | 0.84 (0.77–0.92) | 0.83 (0.76–0.90) | 0.49 (0.36–0.62) |
| JSS | 0.80 (0.76–0.84) | 0.94 (0.90–0.98) | 0.91 (0.85–0.97) | 0.54 (0.42–0.66) |
In-hospital adverse events include; all in-hospital complications, pancreatic necrosis and in-hospital mortality.
Abbreviations: AP: acute pancreatitis; AUC: area under curve; BISAP: beside index of severity in acute pancreatitis; CI: confidence interval; HAPS: harmless acute pancreatitis score; JSS: Japanese severity score: ROC: receiver operator characteristic.

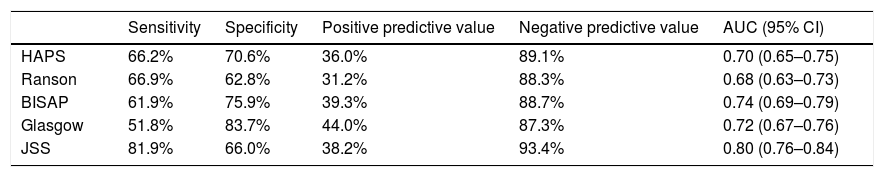
Sensitivity, specificity, positive predictive and negative predictive values of different scoring systems for prediction of major in-hospital major adverse events are presented in Table 4. Overall all scoring systems showed moderate specificity and positive predictive efficacy. On the other hand, sensitivity and negative predictive values were much higher. Among all, JSS had the highest negative predictive value (93.4%).
Sensitivity, specificity, positive predictive and negative predictive value of all scoring systems for prediction of major in-hospital adverse events.*
| Sensitivity | Specificity | Positive predictive value | Negative predictive value | AUC (95% CI) | |
|---|---|---|---|---|---|
| HAPS | 66.2% | 70.6% | 36.0% | 89.1% | 0.70 (0.65–0.75) |
| Ranson | 66.9% | 62.8% | 31.2% | 88.3% | 0.68 (0.63–0.73) |
| BISAP | 61.9% | 75.9% | 39.3% | 88.7% | 0.74 (0.69–0.79) |
| Glasgow | 51.8% | 83.7% | 44.0% | 87.3% | 0.72 (0.67–0.76) |
| JSS | 81.9% | 66.0% | 38.2% | 93.4% | 0.80 (0.76–0.84) |
AUC: area under curve; CI: confidence interval; HAPS: harmless acute pancreatitis score; BISAP: beside index of severity in acute pancreatitis; JSS: Japanese severity score.
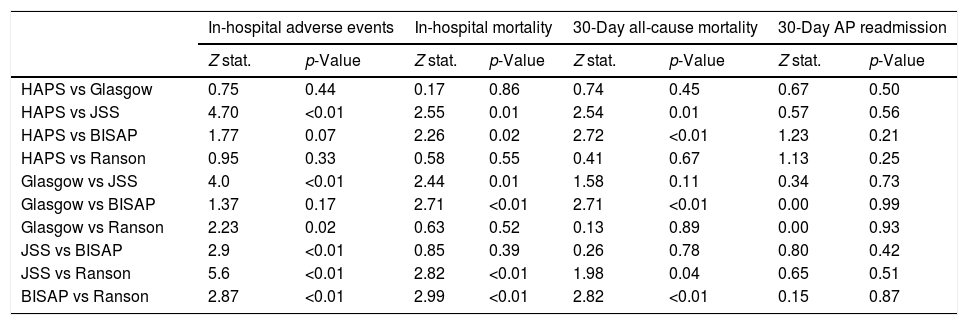
Pairwise comparisons of AUC values between each risk score using De-Long test are shown in Table 5. In terms of in-hospital major adverse events, JSS score outperformed HAPS, Glasgow, BISAP and Ranson scores (z=4.70, z=4.0, z=2.9, z=5.6 all p<0.01 respectively). However, there was no significant difference in 30-day readmission.
Pairwise comparison of AUC values among different risk scores using De-Long test.
| In-hospital adverse events | In-hospital mortality | 30-Day all-cause mortality | 30-Day AP readmission | |||||
|---|---|---|---|---|---|---|---|---|
| Z stat. | p-Value | Z stat. | p-Value | Z stat. | p-Value | Z stat. | p-Value | |
| HAPS vs Glasgow | 0.75 | 0.44 | 0.17 | 0.86 | 0.74 | 0.45 | 0.67 | 0.50 |
| HAPS vs JSS | 4.70 | <0.01 | 2.55 | 0.01 | 2.54 | 0.01 | 0.57 | 0.56 |
| HAPS vs BISAP | 1.77 | 0.07 | 2.26 | 0.02 | 2.72 | <0.01 | 1.23 | 0.21 |
| HAPS vs Ranson | 0.95 | 0.33 | 0.58 | 0.55 | 0.41 | 0.67 | 1.13 | 0.25 |
| Glasgow vs JSS | 4.0 | <0.01 | 2.44 | 0.01 | 1.58 | 0.11 | 0.34 | 0.73 |
| Glasgow vs BISAP | 1.37 | 0.17 | 2.71 | <0.01 | 2.71 | <0.01 | 0.00 | 0.99 |
| Glasgow vs Ranson | 2.23 | 0.02 | 0.63 | 0.52 | 0.13 | 0.89 | 0.00 | 0.93 |
| JSS vs BISAP | 2.9 | <0.01 | 0.85 | 0.39 | 0.26 | 0.78 | 0.80 | 0.42 |
| JSS vs Ranson | 5.6 | <0.01 | 2.82 | <0.01 | 1.98 | 0.04 | 0.65 | 0.51 |
| BISAP vs Ranson | 2.87 | <0.01 | 2.99 | <0.01 | 2.82 | <0.01 | 0.15 | 0.87 |
Abbreviations: AP: acute pancreatitis; BISAP: beside index of severity in acute pancreatitis; HAPS: harmless acute pancreatitis score; JSS: Japanese severity score.
In our study, all five risk scoring systems showed a good performance especially owing to their high negative predictive value despite only modest positive predictive capability. In addition, they also showed good performance in predicting 30-day all-cause mortality. Among these, JSS yielded the best AUC values. However, neither score was successful in predicting the 30-day readmission rate for which they were indeed not intended.
There are some important points in our study that need to be highlighted. First, to the best of our knowledge, this is one of the largest studies comparing AP scoring systems. Second, we calculated each scoring system solely based on the data obtained in the first 24h of admission. Studies conducted so far assessing the risk scores generally made calculations either within the first 48h or even later. We believe that this approach is against the purpose of a scoring system which is intended to predict the complications early in the disease course. Third, although these scoring systems were fundamentally developed to predict the severity of AP and related complications, we also tested them for 30-day readmission and 30-day all-cause mortality. In addition to that, we compared the historical and most validated risk scores which were Ranson and Glasgow against the relatively newer risk scores including HAPS, JSS and BISAP. Such comparisons are limited in the literature as well. Besides, in our study, alcoholic etiology was much less common in comparison to Western and Indian studies.
JSS is one of the latest risk scores which was revised in 2009.6 Although it is commonly used in Japan and has been validated in a number of large studies, its comparison with other risk scores is rare.12 There may be several explanations for the superior performance of JSS. Basically scoring systems consist of three distinct types; those incorporate only clinical variables such as Ranson and Glasgow; those rely solely on morphologic severity determined using a computed tomography imaging (computed tomography severity index) and risk scores that are not specific to acute pancreatitis (Apache II).13,14 Although, a recent study revealed that early imaging findings may predict the prognosis to some degree, scoring systems that lack clinical variables had limited value.15 Among all, JSS distinguishes itself by incorporating both the imaging finding of the pancreas and the clinical parameters. Due to these features, JSS scoring system might have outperformed others. Its sensitivity and negative predictive values were 81.9% and 93.4% respectively. In terms of positive predictive value, all scoring systems showed a moderate performance which was in accordance with the hitherto published data.
The low performance of Ranson score, in particular, may be related to the design of our study, in which only the data in the first 24h of admission were evaluated, a situation that obviously hampers the prognostic power of risk scores necessitating the data of the first 48h or even later. On the other hand, HAPS and BISAP scoring systems, which were developed based on the idea that an ideal score should be easily calculated at the bedside and consist of readily available parameters, were inferior to JSS for both in-hospital major adverse events and 30-day all-cause mortality. In this context, one of the most comprehensive studies came from Mounzer et al. in which nearly all scoring systems were compared in two different cohorts.11 In that study, BISAP scoring system was found to be the best classifier if the calculations were performed during admission and JSS outperformed all when these calculations were repeated at 48h after the first presentation. However, the authors also acknowledged that not all data were available to calculate all clinical scores for each patient.
The failure of all scoring systems used in our study for predicting 30-day readmission may be related to two distinct etiologies. First, obviously, the components of these indices were not designed and thus powered for this purpose. Second, the number of patients who experienced readmission was relatively low corresponding to only 3.9% of the entire cohort. Very recently a scoring system called Symptoms, Nutrition, Necrosis, Antibiotics and Pain (SNNAP) was developed to predict the readmission rate. However, we did not include this in our study.16
Finally, the outperformance of JSS score may indicate the need for early computed tomographic imaging to guide the appropriate therapy at least in selected patients as it may yield the extent, severity and the complications.
The main limitation of our study was its retrospective and single center design. In addition, we did not calculate APACHE II score since it was not AP specific, nevertheless, it may be considered as a major risk score.
ConclusionJSS scoring system was superior for predicting major in-hospital major adverse events and 30-day mortality especially with respect to its high sensitivity and negative predictive value while the rest having only modest discriminatory power. However, none of these scores showed enough efficacy for 30-day readmission.
FundingThis research did not receive any specific grant from funding agencies in the public, commercial, or not-for-profit sectors.
Conflicts of interestNone to declare.
We thank the staff working in the gastroenterology department for their support during archive search and patient contact.
