


Recently, the European Association for the Study of the Liver – Chronic Liver Failure (CLIF) Consortium defined two new prognostic scores, according to the presence or absence of acute-on-chronic liver failure (ACLF): the CLIF Consortium ACLF score (CLIF-C ACLFs) and the CLIF-C Acute Decompensation score (CLIF-C ADs). We sought to compare their accuracy in predicting 30- and 90-day mortality with some of the existing models: Child-Turcotte-Pugh (CTP), Model for End-Stage Liver Disease (MELD), MELD-Na, integrated MELD (iMELD), MELD to serum sodium ratio index (MESO), Refit MELD and Refit MELD-Na.
MethodsRetrospective cohort study that evaluated all admissions due to decompensated cirrhosis in 2 centers between 2011 and 2014. At admission each score was assessed, and the discrimination ability was compared by measuring the area under the ROC curve (AUROC).
ResultsA total of 779 hospitalizations were evaluated. Two hundred and twenty-two patients met criteria for ACLF (25.9%). The 30- and 90-day mortality were respectively 17.7 and 37.3%.
CLIF-C ACLFs presented an AUROC for predicting 30- and 90-day mortality of 0.684 (95% CI: 0.599–0.770) and 0.666 (95% CI: 0.588–0.744) respectively. No statistically significant differences were found when compared to traditional models. For patients without ACLF, CLIF-C ADs had an AUROC for predicting 30- and 90-day mortality of 0.689 (95% CI: 0.614–0.763) and 0.672 (95% CI: 0.624–0.720) respectively. When compared to other scores, it was only statistically superior to MELD for predicting 30-day mortality (p=0.0296).
ConclusionsThe new CLIF-C scores were not statistically superior to the traditional models, with the exception of CLIF-C ADs for predicting 30-day mortality.
Recientemente The European Association for the Study of the Liver-Chronic Liver Failure Consortium estableció 2 nuevos sistemas pronósticos considerando la existencia o no de Acute-on-chronic liver failure (ACLF): el score CLIF Consortium ACLF (CLIF-C ACLF) y el CLIF-C Acute Descompensation score (CLIF-C ADs). Pretendimos comparar su fiabilidad para predecir la mortalidad a los 30 y 90 días con la de algunos de los sistemas de puntuación existentes: Child-Turcotte-Pugh, Model for End-Stage Liver Disease (MELD), MELD-Na, integrated MELD, MELD to serum sodium ratio index, Refit MELD y Refit MELD-Na.
MétodosEstudio retrospectivo de cohortes incluyendo todos los pacientes con cirrosis ingresados en 2 centros entre 2011 y 2014 por descompensación de su enfermedad. En el momento de la admisión cada puntación fue calculada y fueron comparadas las áreas bajo la curva ROC (AUROC) para evaluar su capacidad de discriminación respecto a la mortalidad a los 30 y 90 días.
ResultadosFueron analizadas un total de 779 hospitalizaciones. Doscientos y veintidós pacientes cumplían criterios para ACLF (25,9%). La mortalidad a los 30 y 90 días fue de 17,7% y 37,3% respectivamente.
En los pacientes con ACLF el AUROC del CLIF-C ACLF para predecir la mortalidad a los 30 y 90 días fue 0,684 (IC 95%: 0,599-0,770) y 0,666 (IC 95%: 0,588-0,744) respectivamente. No se encontraron diferencias significativas con los modelos tradicionales. En los pacientes sin ACLF, el AUROC del CLIF-C ADs para predecir la mortalidad a los 30 y 90 días fue 0,689 (IC 95%: 0,614-0,763) y 0,672 (IC 95%: 0,624-0,720) respectivamente. Únicamente fue estadísticamente superior al MELD para predecir la mortalidad a los 30 días (p=0,0296).
ConclusionesLos nuevos modelos CLIF-C no fueron superiores estadísticamente a los modelos tradicionales, con la excepción del CLIF-C ADs en la predicción de la mortalidad a los 30 días.
Cirrhosis is the late stage of hepatic fibrosis and it is characterized by the distortion of the hepatic architecture and formation of regenerative nodules. It accounts for approximately 170,000 deaths per year in Europe.1 Patients with cirrhosis are susceptible to a variety of complications (ascites, spontaneous bacterial peritonitis, hepatic encephalopathy, hepatocellular carcinoma, hepatorenal and hepatopulmonary syndrome). When those complications appear, patients are considered to have decompensated cirrhosis and have a worse prognosis than those with compensated cirrhosis.2
The early use of stratification is essential as part of the initial evaluation of cirrhosis, as it provides objective information to the physician, allowing a useful guide to allocate patients according to their needs and prognosis.
Multiple studies were conducted in order to develop prognostic models for patients with cirrhosis, based on clinical and laboratory data. The two traditional used models are the Child-Turcotte-Pugh (CTP) classification and Model for End-Stage Liver Disease (MELD).3–5 The CTP score has many limitations, namely because of its reliance on subjective interpretation of qualitative parameters and the empirical choice of its variables.6 MELD has also been criticized for several reasons: for instance, different laboratorial methodologies to detect creatinine serum levels cause marked variations in this score, not allowing accurate comparison of scores between different centers; also, the fact that the international normalized ratio (INR) may not reflect the severity of liver disease (alterations in INR may reflect iatrogenic interventions or inherent disease state, not necessarily the severity of cirrhosis).7,8 Several attempts to improve the predictive accuracy of MELD were made, by adding clinical or laboratory parameters, as well as optimizing the equation by multivariate analysis, which resulted in new models like MELD-Na,9–12 MELD to serum sodium ratio index (MESO),13 integrated MELD (iMELD),14 Refit MELD, and Refit MELD-Na.15
Recently, from the Chronic Liver Failure (CLIF) Acute-on-Chronic Liver Failure in Cirrhosis (CANONIC) study,16 two new prognostic models were developed, based on the presence or absence of Acute-on-Chronic Liver Failure (ACLF), respectively, the CLIF Consortium ACLF score (CLIF-C ACLFs)17 and the CLIF-C Acute Decompensation score (CLIF-C ADs).18 Both of them demonstrated superiority over the CTP, MELD and MELD-Na at predicting mortality. ACLF is diagnosed using the CLIF Consortium organ failure score (CLIF-C OFs), which evaluates new prognostic determinants, as the presence of extra-hepatic organ failures (cerebral, lung and circulatory dysfunction), which are not taken into account in MELD based models.16–19
The aim of this study was to compare the accuracy of the new CLIF-C ACLFs and CLIF-C ADs with some of the traditional models used in clinical practice (CTP, MELD, MELD-Na, iMELD, MESO, Refit MELD, Refit MELD-Na), in order to predict 30- and 90-day mortality (in the first 24h of admission) of cirrhotic patients admitted due to decompensated cirrhosis.
Materials and methodsPopulationWe conducted a retrospective cohort study that evaluated all consecutive admissions to the Gastroenterology and Hepatology department due to decompensated cirrhosis in 2 centers between 2011 and 2014. The diagnosis of cirrhosis was based on conventional histological (when available), clinical, laboratory, endoscopic and imaging tests.
Acute decompensation was defined by new onset of hepatic encephalopathy, large volume ascites, gastrointestinal bleeding, or any combination of the previous. Exclusion criteria were: individuals admitted for elective procedures, or related complications and admissions unrelated to liver cirrhosis complications.
If a patient was admitted more than one time during the study period, it was included as a new hospitalization. Using the coding system of our centers and after exclusion criteria were applied, 779 consecutive admissions were identified. Organ failures were identified using the CLIF-C OFs and the presence or absence of ACLF and its degrees were evaluated according to the conventional criteria.17
Data and prognostic modelsDemographic, clinical and analytical parameters necessary to calculate each score were registered at admission (first 24h of hospitalization). The following formulas were used to calculate the models: CTP (ascites, hepatic encephalopathy, albumin, bilirubin and INR)3; MELD=9.6×loge (creatinine)+3.8×loge (bilirubin)+11.2×loge (INR)+6.43×(etiology: 0 if cholestatic or alcoholic, 1 otherwise)5; MELD-Na=MELD-Na−[0.025×MELD×(140−Na)+140]11; iMELD=MELD+(0.3×age)−(0.7+Na)+10013; MESO=(MELD/Na)×1014; Refit MELD=4.082×loge (bilirubin)+10,671×loge(INR)+8.485×loge (creatinine)+7.432; Refit MELD-Na=4.258×loge (bilirubin)+6.792×loge (creatinine)+8.290×loge (INR)+0.652×(140−Na)−0.194×(140−Na)×bilirubin+6.32715; CLIF-C ACLFs=10×[0.33×CLIF-OFs+0.04×Age+0.63×Ln (WBC count)−2]17; CLIF-C ADs: 10×[0.03×Age+0.66×Ln (Creatinine)+1.71×Ln(INR)+0.88×Ln (WBC count)−0.05×Na+8].18
Statistical analysisContinuous variables were compared using Student's t tests and categorical variables were compared using Chi-squared tests or Fisher's tests. The predictive ability for each model was evaluated according to Areas Under Receiver-Operating Characteristics curves (AUROC). Comparisons of AUROCs were performed by MedCalc software version 12.4, by the technique described by DeLong et al.20 The p value was considered significant when it was less than 0.05.
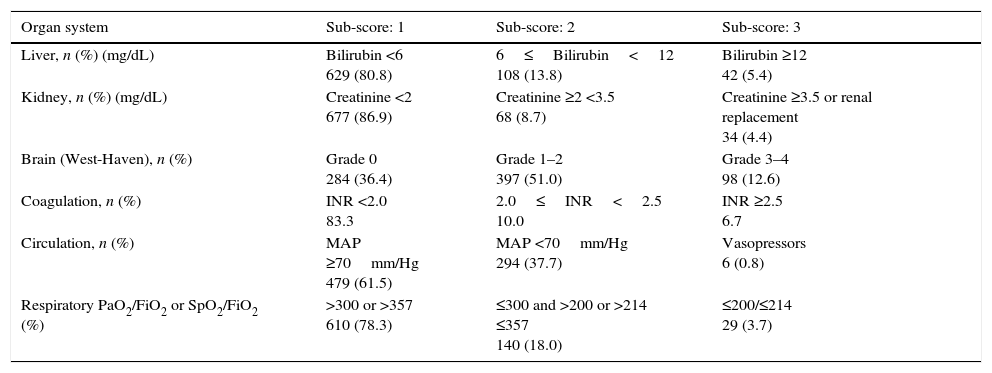
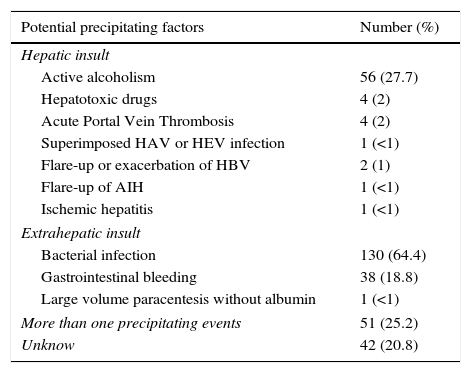
ResultsPatientsSeven hundred and seventy nine consecutive admissions for chronic liver disease were studied. Forty-nine patients were lost to follow-up at 90 days. Patient's characteristics are described in Table 1. The mean age was 59.98 (±11.62) years; 81.5% were male. The major cause of chronic liver disease was alcohol (65.1%), followed by hepatitis C virus (20.7%). At admission, 349 (44.8%) had criteria for infection, 174 (22.3%) presented acute gastrointestinal bleeding and 77 (9.9%) a diagnosis of hepatocarcinoma. The mean length of hospital stay was 10.86 (±10.48) days. Table 2 describes the distribution of patients according to the CLIF-C OFs. Two hundred and two patients met criteria for ACLF (25.9%) and were categorized as ACLF grade 1 in 71.7% of cases, grade 2 in 21.6% and Grade 3 in 6.7% of cases. Five hundred seventy seven patients were classified as having an acute decompensation (AD) without ACLF (74.1%). Table 3 reports the potential precipitating events for the development of ACLF. In 25.2% of patients there were possibly more than one insult leading to ACLF and in 20.8% of patients, there were no identifiable precipitants.
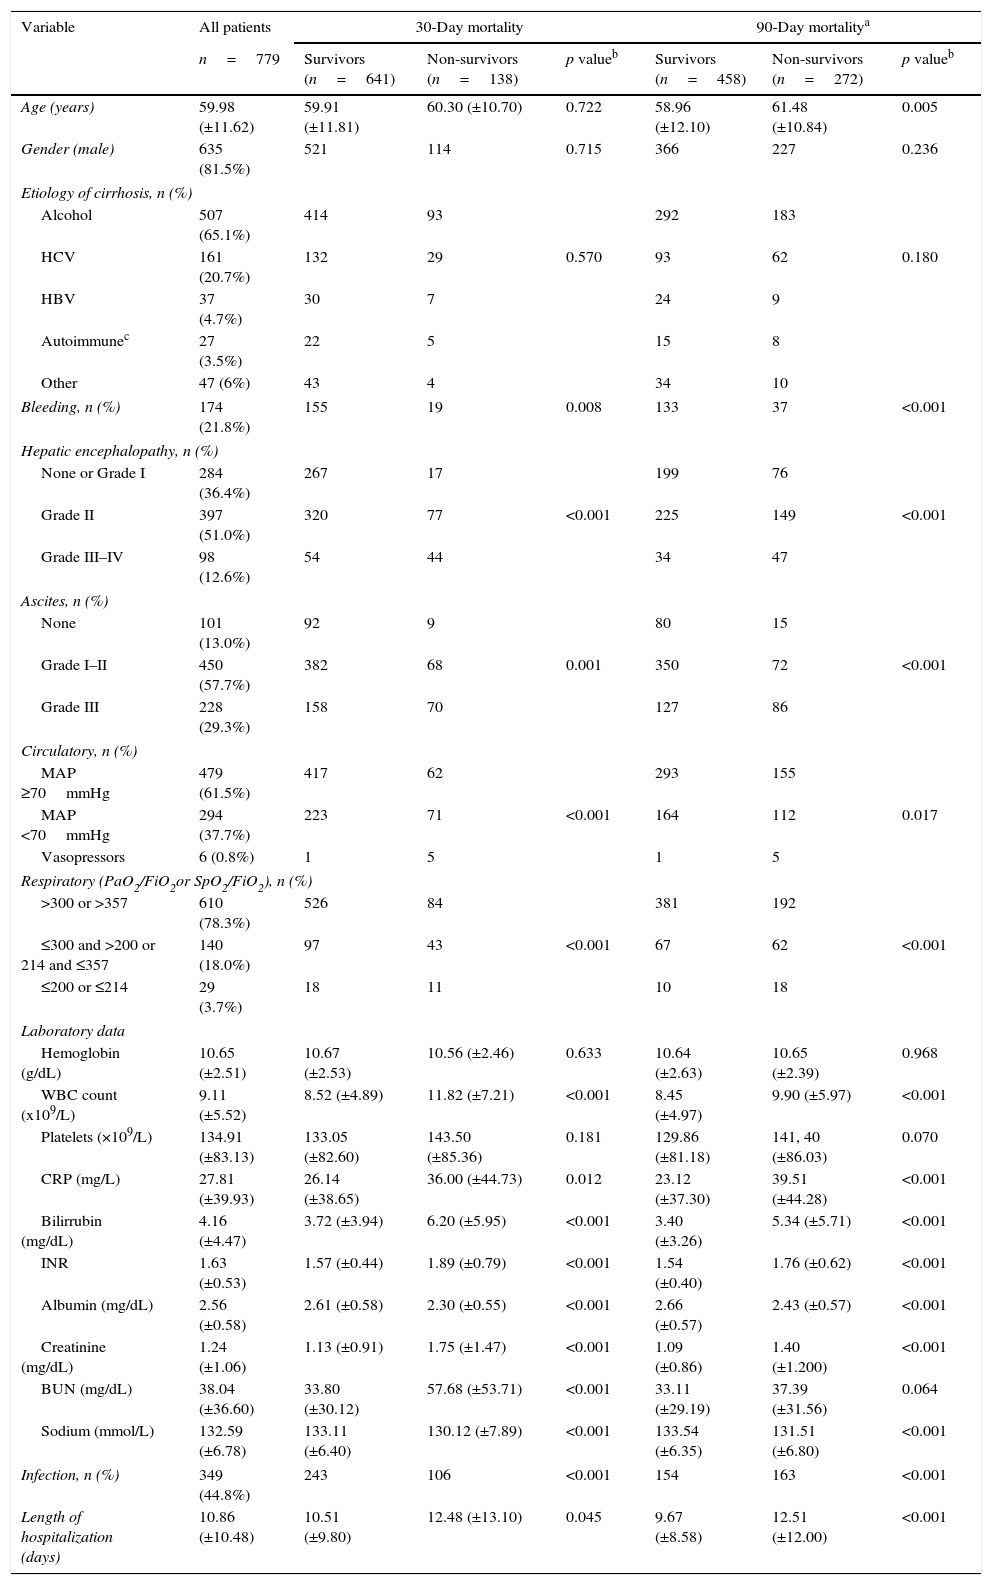
Patients characteristics on admission and factors associated with 30- and 90-day mortality (univariate analysis).
| Variable | All patients | 30-Day mortality | 90-Day mortalitya | ||||
|---|---|---|---|---|---|---|---|
| n=779 | Survivors (n=641) | Non-survivors (n=138) | p valueb | Survivors (n=458) | Non-survivors (n=272) | p valueb | |
| Age (years) | 59.98 (±11.62) | 59.91 (±11.81) | 60.30 (±10.70) | 0.722 | 58.96 (±12.10) | 61.48 (±10.84) | 0.005 |
| Gender (male) | 635 (81.5%) | 521 | 114 | 0.715 | 366 | 227 | 0.236 |
| Etiology of cirrhosis, n (%) | |||||||
| Alcohol | 507 (65.1%) | 414 | 93 | 292 | 183 | ||
| HCV | 161 (20.7%) | 132 | 29 | 0.570 | 93 | 62 | 0.180 |
| HBV | 37 (4.7%) | 30 | 7 | 24 | 9 | ||
| Autoimmunec | 27 (3.5%) | 22 | 5 | 15 | 8 | ||
| Other | 47 (6%) | 43 | 4 | 34 | 10 | ||
| Bleeding, n (%) | 174 (21.8%) | 155 | 19 | 0.008 | 133 | 37 | <0.001 |
| Hepatic encephalopathy, n (%) | |||||||
| None or Grade I | 284 (36.4%) | 267 | 17 | 199 | 76 | ||
| Grade II | 397 (51.0%) | 320 | 77 | <0.001 | 225 | 149 | <0.001 |
| Grade III–IV | 98 (12.6%) | 54 | 44 | 34 | 47 | ||
| Ascites, n (%) | |||||||
| None | 101 (13.0%) | 92 | 9 | 80 | 15 | ||
| Grade I–II | 450 (57.7%) | 382 | 68 | 0.001 | 350 | 72 | <0.001 |
| Grade III | 228 (29.3%) | 158 | 70 | 127 | 86 | ||
| Circulatory, n (%) | |||||||
| MAP ≥70mmHg | 479 (61.5%) | 417 | 62 | 293 | 155 | ||
| MAP <70mmHg | 294 (37.7%) | 223 | 71 | <0.001 | 164 | 112 | 0.017 |
| Vasopressors | 6 (0.8%) | 1 | 5 | 1 | 5 | ||
| Respiratory (PaO2/FiO2or SpO2/FiO2), n (%) | |||||||
| >300 or >357 | 610 (78.3%) | 526 | 84 | 381 | 192 | ||
| ≤300 and >200 or 214 and ≤357 | 140 (18.0%) | 97 | 43 | <0.001 | 67 | 62 | <0.001 |
| ≤200 or ≤214 | 29 (3.7%) | 18 | 11 | 10 | 18 | ||
| Laboratory data | |||||||
| Hemoglobin (g/dL) | 10.65 (±2.51) | 10.67 (±2.53) | 10.56 (±2.46) | 0.633 | 10.64 (±2.63) | 10.65 (±2.39) | 0.968 |
| WBC count (x109/L) | 9.11 (±5.52) | 8.52 (±4.89) | 11.82 (±7.21) | <0.001 | 8.45 (±4.97) | 9.90 (±5.97) | <0.001 |
| Platelets (×109/L) | 134.91 (±83.13) | 133.05 (±82.60) | 143.50 (±85.36) | 0.181 | 129.86 (±81.18) | 141, 40 (±86.03) | 0.070 |
| CRP (mg/L) | 27.81 (±39.93) | 26.14 (±38.65) | 36.00 (±44.73) | 0.012 | 23.12 (±37.30) | 39.51 (±44.28) | <0.001 |
| Bilirrubin (mg/dL) | 4.16 (±4.47) | 3.72 (±3.94) | 6.20 (±5.95) | <0.001 | 3.40 (±3.26) | 5.34 (±5.71) | <0.001 |
| INR | 1.63 (±0.53) | 1.57 (±0.44) | 1.89 (±0.79) | <0.001 | 1.54 (±0.40) | 1.76 (±0.62) | <0.001 |
| Albumin (mg/dL) | 2.56 (±0.58) | 2.61 (±0.58) | 2.30 (±0.55) | <0.001 | 2.66 (±0.57) | 2.43 (±0.57) | <0.001 |
| Creatinine (mg/dL) | 1.24 (±1.06) | 1.13 (±0.91) | 1.75 (±1.47) | <0.001 | 1.09 (±0.86) | 1.40 (±1.200) | <0.001 |
| BUN (mg/dL) | 38.04 (±36.60) | 33.80 (±30.12) | 57.68 (±53.71) | <0.001 | 33.11 (±29.19) | 37.39 (±31.56) | 0.064 |
| Sodium (mmol/L) | 132.59 (±6.78) | 133.11 (±6.40) | 130.12 (±7.89) | <0.001 | 133.54 (±6.35) | 131.51 (±6.80) | <0.001 |
| Infection, n (%) | 349 (44.8%) | 243 | 106 | <0.001 | 154 | 163 | <0.001 |
| Length of hospitalization (days) | 10.86 (±10.48) | 10.51 (±9.80) | 12.48 (±13.10) | 0.045 | 9.67 (±8.58) | 12.51 (±12.00) | <0.001 |
Patients distribution at admission, according to the CLIF-C OFs.
| Organ system | Sub-score: 1 | Sub-score: 2 | Sub-score: 3 |
|---|---|---|---|
| Liver, n (%) (mg/dL) | Bilirubin <6 629 (80.8) | 6≤Bilirubin<12 108 (13.8) | Bilirubin ≥12 42 (5.4) |
| Kidney, n (%) (mg/dL) | Creatinine <2 677 (86.9) | Creatinine ≥2 <3.5 68 (8.7) | Creatinine ≥3.5 or renal replacement 34 (4.4) |
| Brain (West-Haven), n (%) | Grade 0 284 (36.4) | Grade 1–2 397 (51.0) | Grade 3–4 98 (12.6) |
| Coagulation, n (%) | INR <2.0 83.3 | 2.0≤INR<2.5 10.0 | INR ≥2.5 6.7 |
| Circulation, n (%) | MAP ≥70mm/Hg 479 (61.5) | MAP <70mm/Hg 294 (37.7) | Vasopressors 6 (0.8) |
| Respiratory PaO2/FiO2 or SpO2/FiO2 (%) | >300 or >357 610 (78.3) | ≤300 and >200 or >214 ≤357 140 (18.0) | ≤200/≤214 29 (3.7) |
Potential precipitating events of ACLF.
| Potential precipitating factors | Number (%) |
|---|---|
| Hepatic insult | |
| Active alcoholism | 56 (27.7) |
| Hepatotoxic drugs | 4 (2) |
| Acute Portal Vein Thrombosis | 4 (2) |
| Superimposed HAV or HEV infection | 1 (<1) |
| Flare-up or exacerbation of HBV | 2 (1) |
| Flare-up of AIH | 1 (<1) |
| Ischemic hepatitis | 1 (<1) |
| Extrahepatic insult | |
| Bacterial infection | 130 (64.4) |
| Gastrointestinal bleeding | 38 (18.8) |
| Large volume paracentesis without albumin | 1 (<1) |
| More than one precipitating events | 51 (25.2) |
| Unknow | 42 (20.8) |
The 30- and 90-day mortality were respectively 17.7% and 37.3%. When evaluating the group of patients with AD without ACLF, the 30- and 90-day mortality were respectively, 10.3% and 31.1%. In the group of patients with ACLF, the 30- and 90-day mortality was 35.4% and 62.8%, respectively. No statistically significant differences were noticed between centers concerning the 30- and 90-day mortality (respectively, p=0.539 and p=0.542).
Comparison of survivors versus non-survivorsTable 1 describes univariate analysis for 30- and 90-day mortality. Patients who at admission presented Lower Median Arterial Pressure (MAP; 30-day mortality: p<0.001; 90-day mortality: p=0.017), Partial pressure of Arterial Oxygen (PaO2) or pulse Oximetric Saturation (SpO2; p<0.001; p<0.001), ascites (p<0.001; p<0.001) and encephalopathy (p<0.001; p<0.001), had higher 30- and 90-day mortality. Moreover, those who presented higher White Blood Count (WBC; p<0.001; p<0.001), CRP (C-reactive protein; p=0.012; p<0.001), Bilirubin (p<0.001; p<0.001), INR (p<0.001; p<0.001), and lower serum Creatinine (p<0.001; p<0.001) and Na (p<0.001; p<0.001) presented as well higher 30- and 90-day mortality. Higher age (p=0.005) was associated with increased 90-day mortality and higher Blood Urea Nitrogen (BUN; p<0.001) values with augmented 30-day mortality. Criteria for infection were also associated with worse prognosis (p<0.001; p<0.001). Admission for gastrointestinal bleeding (p=0.008; p<0.001) was a protective factor. Gender and the etiology of cirrhosis were not significantly associated with an increased risk of death. No differences were observed for the other variables (Table 1).
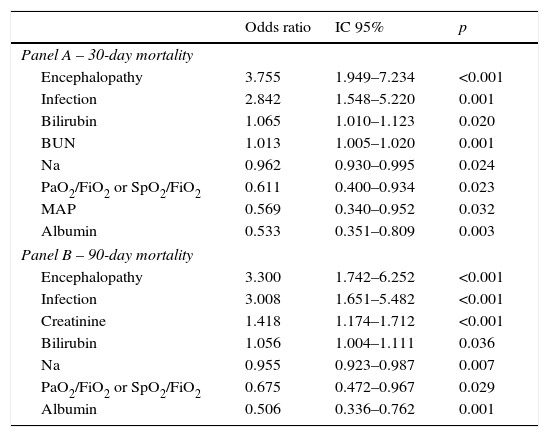
Table 4 describes the factors independently associated with 30- and 90-day mortality. In multivariate logistic regression, elevated BUN, Bilirubin, lower Sodium, Albumin, MAP, PaO2 or SpO2 and presence of Encephalopathy and Infection at admission, were independently associated with increased 30-day mortality. Ninety-day mortality was independently associated with higher Bilirubin, Creatinine, lower Na, Albumin, PaO2 or SpO2 and presence of Encephalopathy and Infection at admission.
Factors independently associated with 30 (Panel A) and 90 day mortality (Panel B) at admission – multivariable logistic regression with stepwise selection of variables.
| Odds ratio | IC 95% | p | |
|---|---|---|---|
| Panel A – 30-day mortality | |||
| Encephalopathy | 3.755 | 1.949–7.234 | <0.001 |
| Infection | 2.842 | 1.548–5.220 | 0.001 |
| Bilirubin | 1.065 | 1.010–1.123 | 0.020 |
| BUN | 1.013 | 1.005–1.020 | 0.001 |
| Na | 0.962 | 0.930–0.995 | 0.024 |
| PaO2/FiO2 or SpO2/FiO2 | 0.611 | 0.400–0.934 | 0.023 |
| MAP | 0.569 | 0.340–0.952 | 0.032 |
| Albumin | 0.533 | 0.351–0.809 | 0.003 |
| Panel B – 90-day mortality | |||
| Encephalopathy | 3.300 | 1.742–6.252 | <0.001 |
| Infection | 3.008 | 1.651–5.482 | <0.001 |
| Creatinine | 1.418 | 1.174–1.712 | <0.001 |
| Bilirubin | 1.056 | 1.004–1.111 | 0.036 |
| Na | 0.955 | 0.923–0.987 | 0.007 |
| PaO2/FiO2 or SpO2/FiO2 | 0.675 | 0.472–0.967 | 0.029 |
| Albumin | 0.506 | 0.336–0.762 | 0.001 |
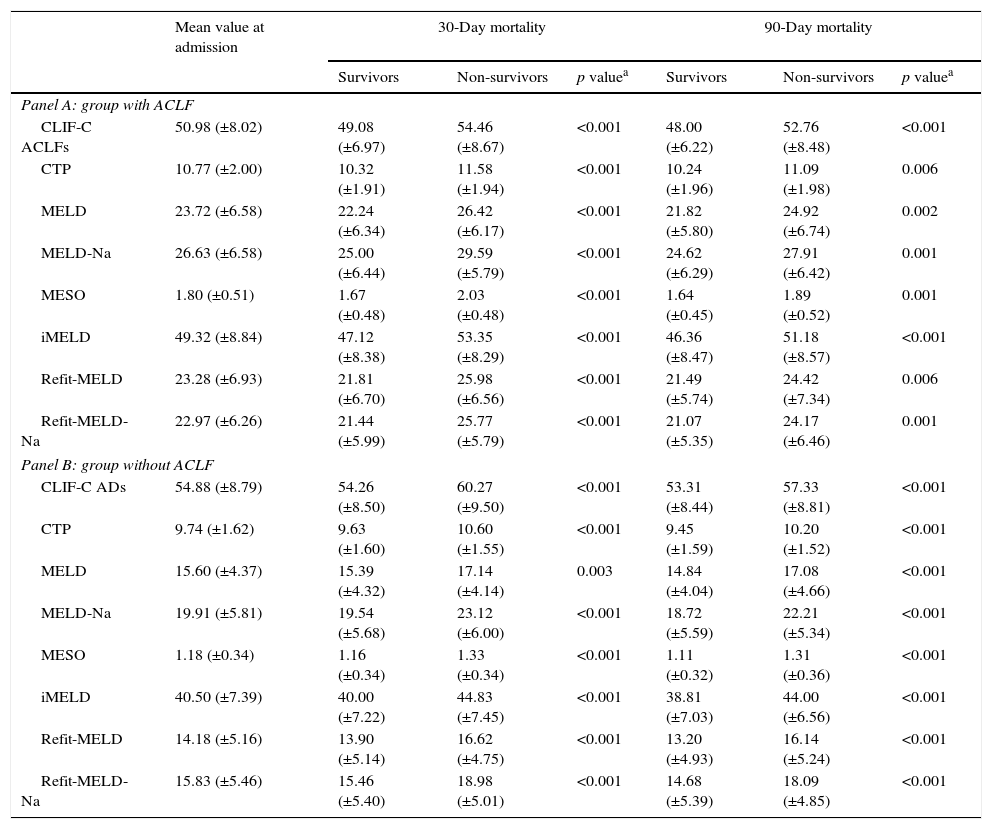
Table 5 shows the values of the models at admission, according to the presence or absence of ACLF and mortality. As expected, in both groups significantly higher mean values were observed for all models among individuals who died at 30 and 90 days, comparing to survivors.
Models mean value according to the presence (Panel A) or absence of ACLF at admission (Panel B) and prognosis.
| Mean value at admission | 30-Day mortality | 90-Day mortality | |||||
|---|---|---|---|---|---|---|---|
| Survivors | Non-survivors | p valuea | Survivors | Non-survivors | p valuea | ||
| Panel A: group with ACLF | |||||||
| CLIF-C ACLFs | 50.98 (±8.02) | 49.08 (±6.97) | 54.46 (±8.67) | <0.001 | 48.00 (±6.22) | 52.76 (±8.48) | <0.001 |
| CTP | 10.77 (±2.00) | 10.32 (±1.91) | 11.58 (±1.94) | <0.001 | 10.24 (±1.96) | 11.09 (±1.98) | 0.006 |
| MELD | 23.72 (±6.58) | 22.24 (±6.34) | 26.42 (±6.17) | <0.001 | 21.82 (±5.80) | 24.92 (±6.74) | 0.002 |
| MELD-Na | 26.63 (±6.58) | 25.00 (±6.44) | 29.59 (±5.79) | <0.001 | 24.62 (±6.29) | 27.91 (±6.42) | 0.001 |
| MESO | 1.80 (±0.51) | 1.67 (±0.48) | 2.03 (±0.48) | <0.001 | 1.64 (±0.45) | 1.89 (±0.52) | 0.001 |
| iMELD | 49.32 (±8.84) | 47.12 (±8.38) | 53.35 (±8.29) | <0.001 | 46.36 (±8.47) | 51.18 (±8.57) | <0.001 |
| Refit-MELD | 23.28 (±6.93) | 21.81 (±6.70) | 25.98 (±6.56) | <0.001 | 21.49 (±5.74) | 24.42 (±7.34) | 0.006 |
| Refit-MELD-Na | 22.97 (±6.26) | 21.44 (±5.99) | 25.77 (±5.79) | <0.001 | 21.07 (±5.35) | 24.17 (±6.46) | 0.001 |
| Panel B: group without ACLF | |||||||
| CLIF-C ADs | 54.88 (±8.79) | 54.26 (±8.50) | 60.27 (±9.50) | <0.001 | 53.31 (±8.44) | 57.33 (±8.81) | <0.001 |
| CTP | 9.74 (±1.62) | 9.63 (±1.60) | 10.60 (±1.55) | <0.001 | 9.45 (±1.59) | 10.20 (±1.52) | <0.001 |
| MELD | 15.60 (±4.37) | 15.39 (±4.32) | 17.14 (±4.14) | 0.003 | 14.84 (±4.04) | 17.08 (±4.66) | <0.001 |
| MELD-Na | 19.91 (±5.81) | 19.54 (±5.68) | 23.12 (±6.00) | <0.001 | 18.72 (±5.59) | 22.21 (±5.34) | <0.001 |
| MESO | 1.18 (±0.34) | 1.16 (±0.34) | 1.33 (±0.34) | <0.001 | 1.11 (±0.32) | 1.31 (±0.36) | <0.001 |
| iMELD | 40.50 (±7.39) | 40.00 (±7.22) | 44.83 (±7.45) | <0.001 | 38.81 (±7.03) | 44.00 (±6.56) | <0.001 |
| Refit-MELD | 14.18 (±5.16) | 13.90 (±5.14) | 16.62 (±4.75) | <0.001 | 13.20 (±4.93) | 16.14 (±5.24) | <0.001 |
| Refit-MELD-Na | 15.83 (±5.46) | 15.46 (±5.40) | 18.98 (±5.01) | <0.001 | 14.68 (±5.39) | 18.09 (±4.85) | <0.001 |
CLIF-C ACLF: Chronic Liver Failure Consortium Acute-on-Chronic Liver Failure score; CTP: Child Turcotte Pugh; CLIF-C ADs: Chronic Liver Failure Consortium Acute Decompensation score; MELD: Model for End-Stage Liver Disease; MELD-Na: MELD with serum sodium incorporation; MESO: model for end stage liver disease to sodium index; iMELD: integrated MELD; Refit MELD: revised model for end-stage liver disease; Refit MELD-Na: revised model for end-stage liver disease with sodium.
The presence of ACLF was associated with higher 30 (p<0.001) and 90-day mortality (p<0.001). Increasing stage of ACLF was also associated with higher 30- (p<0.001) and 90-day mortality (p<0.001).
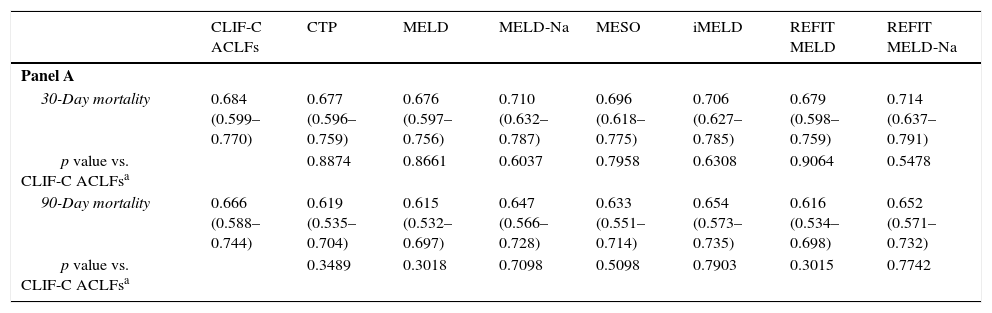
Table 6 demonstrates AUROCs of the studied models at admission to evaluate their reliability in predicting 30- and 90-day mortality. It also compares the CLIF-C models with the traditional scores, according to the presence or absence of ACLF.
Comparison of CLIF-C models according to the presence or absence of ACLF at admission, using ROC curves. Panel A: patients without ACLF (every model versus CLIF-C ADs); Panel B: patients with ACLF (every model versus CLIF-C ACLFs).
| CLIF-C ACLFs | CTP | MELD | MELD-Na | MESO | iMELD | REFIT MELD | REFIT MELD-Na | |
|---|---|---|---|---|---|---|---|---|
| Panel A | ||||||||
| 30-Day mortality | 0.684 (0.599–0.770) | 0.677 (0.596–0.759) | 0.676 (0.597–0.756) | 0.710 (0.632–0.787) | 0.696 (0.618–0.775) | 0.706 (0.627–0.785) | 0.679 (0.598–0.759) | 0.714 (0.637–0.791) |
| p value vs. CLIF-C ACLFsa | 0.8874 | 0.8661 | 0.6037 | 0.7958 | 0.6308 | 0.9064 | 0.5478 | |
| 90-Day mortality | 0.666 (0.588–0.744) | 0.619 (0.535–0.704) | 0.615 (0.532–0.697) | 0.647 (0.566–0.728) | 0.633 (0.551–0.714) | 0.654 (0.573–0.735) | 0.616 (0.534–0.698) | 0.652 (0.571–0.732) |
| p value vs. CLIF-C ACLFsa | 0.3489 | 0.3018 | 0.7098 | 0.5098 | 0.7903 | 0.3015 | 0.7742 | |
| CLIF-C ADs | CTP | MELD | MELD-Na | MESO | iMELD | REFIT MELD | REFIT MELD-Na | |
|---|---|---|---|---|---|---|---|---|
| Panel B | ||||||||
| 30-Day mortality | 0.689 (0.614–0.763) | 0.665 (0.593–0.735) | 0.605 (0.532–0.679) | 0.659 (0.582–0.735) | 0.627 (0.553–0.701) | 0.666 (0.593–0.738) | 0.637 (0.565–0.709) | 0.673 (0.599–0.747) |
| p value vs. CLIF-C ADsa | 0.5905 | 0.0296 | 0.3442 | 0.0830 | 0.4391 | 0.1519 | 0.6135 | |
| 90-Day mortality | 0.672 (0.624–0.720) | 0.649 (0.601–0.697) | 0.644 (0.595–0.693) | 0.689 (0.642–0.736) | 0.662 (0.613–0.710) | 0.707 (0.662–0.752) | 0.670 (0.621–0.718) | 0.700 (0.654–0.747) |
| p value vs. CLIF-C ADsa | 0.4422 | 0.2966 | 0.4238 | 0.6830 | 0.0500 | 0.9233 | 0.1565 | |
For the group with ACLF, upon admission, the values for the area under the ROC curve (AUROC) for 30-day mortality were: 0.684±0.044 (CLIF-C ACLFs), 0.677±0.041 (CTP), 0.676±0.041 (MELD), 0.710±0.040 (MELD-Na), 0.696±0.040 (MESO), 0.706±0.040 (iMELD), 0.679±0.041 (Refit MELD) and 0.714±0.039 (Refit MELD-Na). No significant differences were observed when models were compared to CLIF-C ACLFs. For 90-day mortality, the values for the AUROC were: 0.666±0.040 (CLIF-C ACLFs), 0.619±0.043 (CTP), 0.615±0.042 (MELD), 0.647±0.041 (MELD-Na), 0.633±0.042 (MESO), 0.654±0.042 (iMELD), 0.616±0.042 (Refit MELD), and 0.652±0.041 (Refit MELD-Na). No significant differences were observed when traditional models were compared to CLIF-C ACLFs.
For the group with AD without ACLF, for 30-day mortality, the values for the AUROC were: 0.689±0.038 (CLIF-C ADs), 0.665±0.036 (CTP), 0.605±0.037 (MELD), 0.659±0.039 (MELD-Na), 0.627±0.038 (MESO), 0.666±0.037 (iMELD), 0.637±0.037 (Refit MELD), and 0.673±0.038 (Refit MELD-Na). With the exception of MELD (which was inferior when compared to CLIF-C ADs), no statistically significant differences were noticed between the discriminative ability of CLIF-C ADs and the other tested models. For 90-day mortality, the values of the AUROC were: 0.672±0.025 (CIF-C ADs), 0.649±0.025 (CTP), 0.644±0.025 (MELD), 0.689±0.024 (MELD-Na), 0.662±0.025 (MESO), 0.707±0.023 (iMELD), 0.670±0.025 (Refit MELD), and 0.700±0.024 (Refit MELD-Na). No significant differences were observed when other models were compared to CLIF-C ADs.
DiscussionA good prognostic model should rely on objective data, minimizing the influence of subjective physician evaluation, should be easy to use and have a high predictive ability.
The two most studied models correspond to CTP and MELD. A recent meta-analysis by Peng et al.21 compared the discriminating ability between CTP and MELD for predicting the prognosis of cirrhotic patients. After evaluating 119 papers they concluded that for the prediction of in-hospital, 3- and 6-month mortality, MELD score was significantly better than CTP. CTP and MELD had statistically similar discriminative ability in some subgroups, like 12-month mortality, patients with alcohol exclusively related liver cirrhosis, liver transplant candidates and patients undergoing TIPS. Although there are some controversies in literature, especially when analyzing cirrhotic patients admitted to Intensive Care Units, iMELD, MESO, MELD-Na, Refit MELD, and Refit MELD-Na seem to be superior to both CTP and MELD in predicting short, medium, and long term mortality.11,10,13,22–30
In the study conducted by Jalan et al.,17 which had into account two different populations (275 patients with ACLF from CANONIC study and 225 patients from Paul Brousse Hospital, Villejuif)16,31 it was demonstrated that CLIF-C ACLFs was significantly superior to both CTP, MELD and MELD-Na for predicting the risk of short, medium, and long term mortality. A later study by Jalan et al.,18 developed and validated CLIF-C ADs. This study evaluated two different populations (1349 patients with AD from CANONIC study and 225 to two European hospitals). CLIF-C ADs was significantly superior to both CTP, MELD and MELD-Na for predicting cirrhotic patients prognosis. Similar results were reported in the retrospective cohort studies by Shi et al.32 (209 patients with ACLF and 1245 patients with AD) and Li et al.33 (590 patients with ACLF and 57 with AD).
These new CLIF models were object of criticism based on the following: (1) their high complexity when compared to conventional models make them difficult to be used as a bedside index; (2) serum bilirubin was not an independent predictor of prognosis in the CANONIC study, neither in the one conducted by Shi et al. in which bilirubin was only associated with worse prognosis in cirrhotic patients with ACLF secondary to an hepatic insult16,31,32,34; (3) both CLIF-C ACLFs and ADs, take into account the variable “Age of the patient” Although the variable “age” was obtained by multivariate analysis, there are some theoretical limitations for its use in the equations, given the absence of a linear relation between it and the patient's prognosis. For instance, patients with cirrhosis related to Alcohol and Hepatitis C virus, tend to have a more severe disease earlier than those with cirrhosis solely linked to alcohol ingestion. In that instance, patients with both risk factors would have lower scores and their prognosis could be underestimated according to the new models.
Recently, a retrospective study by Dupont et al.35 that evaluated 281 cirrhotic patients admitted to Intermediate Care Unit, failed to show CLIF-C ACLFs superiority to predict in-hospital mortality when compared to MELD, MELD-Na and CTP. In the study by Shi et al.,34 which evaluated cirrhotic patients according to the nature (hepatic or extrahepatic) of the precipitant insult of ACLF (277 patients with ACLF), the model that presented the higher discriminating ability for short, medium and long term mortality was iMELD in the hepatic-ACLF group and the CLIF-C ACLFs in the group with extrahepatic-ACLF.
There are some limitations of our work that should be considered when analyzing our results: firstly there are the limitations linked to the multicentric retrospective nature of the work, where there were no standardized protocols for treatment and reference to a transplant center. We had a higher 30- and 90-day mortality in both groups than the reported in the majority of literature.17,32,35,36 That can be eventually explained by the fact that we had a higher number of patients with bacterial infections at admission (44.8%), especially when evaluated the group of patients without ACLF (37.7%). Literature reports bacterial infections as an independent risk factor for worse prognosis and as a known risk factor for developing ACLF.36–39 We hypothesize that some of the patients without ACLF, could have eventually developed ACLF as the result of infection. Also we took into account the multiple hospitalizations for the same patient during the study period and therefore, we analyzed patients with progressive and more severe forms of disease. Our study was conducted in a Western population, fact that is well reflected when analyzed the cirrhosis etiologies of patients, with a predominance of alcohol and Hepatitis C virus related cirrhosis. Both works by Jalan et al.17,18 and Dupont et al.35 were also conducted in an Occidental population. Shi et al. and Li et al. studies were conducted in an Eastern population with a predominance of Hepatitis B virus related cirrhosis.32,3 The influence of cirrhosis etiologies to the new CLIF-C models is yet to be evaluated. Our tested models presented a very similar accuracy to predict 30- and 90-day mortality. Our mean values for the traditional models were in accordance with the acceptable range described in literature. In our study, the new CLIF-C models, presented lower discriminating ability than the one described previously.17,18,32,35 Although CLIF-C ACLFs variables evaluate more organ system failures than traditional models, that was not translated in a significantly higher ability for predicting 30- and 90-day mortality in our study. In multivariate analysis, parameters considered in CLIF-C models (Age; WBC count) did not show association with poor prognosis. Also CLIF-C ADs was only statistically superior to MELD for the prediction of 30-day mortality. Nevertheless, both CLIF-C models generally presented a superior AUROC when compared with the traditional models, although it was not statistically significant.
In summary, our results confirmed the good accuracy of the new CLIF-C models in order to predict 30- and 90-day mortality. In our work, their ability to predict patient prognosis was not consistently superior to the majority of the traditional models. Nevertheless, they represent an important objective tool for the assessment of patient prognosis, which takes into account the concept of organ dysfunction and constitute a useful complement to clinical evaluation in the management of cirrhotic patients.
Conflict of interestsThe authors declare that they have no conflict of interest.
