


Correctly identifying patients with biliary atresia (BA), while avoiding invasive diagnostic methods is challenging. The purpose of this study was to determine the value of serum immune indicators for distinguishing BA from other causes of cholestasis in infants.
Patients and methodsThe data of infants with a surgical/histological diagnosis of BA and those with other causes of cholestatic jaundice were retrospectively analyzed. Patients were divided into a BA group and a cholestasis control (CC) group. Biochemical parameters, major lymphocyte subsets, immunoglobin and C3 and C4 complement levels were compared between the groups.
ResultsA total of 129 infants with BA and 63 with other causes of cholestasis (CC control group) with a median age of 2.2 months were included in the analysis. The levels of CD3+ T cells, CD3+CD4+ T cells, and premature T cells and the levels of C3 and C4 were all significantly higher in the BA group compared to the CC group (all P<0.05). Pair-wise correlation analyses indicated that C3 and C4 had a significant positive correlation with γ-GT in the BA group, but not in the CC group. Five indices were found to be significantly associated with BA: stool color, globulin, γ-GT, C3 and C4. A model incorporating stool color, gamma-glutamyl transpeptidase level, and C3 level exhibited an area under the ROC curve (AUC) of 0.93, and a sensitivity of 93% and specificity of 83% for the diagnosis of BA.
ConclusionsModels incorporating serum C3 levels may be useful for accurately diagnosing BA in infants.
Es difícil la identificación correcta de los pacientes con atresia biliar (AB), evitando los métodos diagnósticos invasivos. El objetivo de este estudio fue determinar el valor de los indicadores inmunológicos séricos para distinguir AB de otras causas de colestasis en niños.
Pacientes y métodosSe analizaron retrospectivamente los datos de niños con diagnóstico quirúrgico/histológico de AB y los datos de niños con otras causas de ictericia colestásica. Se dividió a los pacientes entre el grupo AB y el grupo de control de colestasis (CC). Se comparó entre los dos grupo los parámetros bioquímicos, principales subconjuntos linfocíticos, inmunoglobina y niveles séricos de C3 y C4 del complemento.
ResultadosSe incluyó en el análisis a un total de 129 niños con AB y 63 con otras causas de colestasis (grupo control CC) con una edad media de 2,2 meses. Los niveles de células T CD3+, células T CD3+CD4+, células T prematuras y los niveles de C3 y C4 fueron significativamente más altos en el grupo AB en comparación con el grupo CC (all P < 0,05). Los análisis de correlación pareada indicaron que C3 y C4 tenían una correlación positiva significativa con -GT en el grupo AB, pero no en el grupo CC. Se determinó que cinco índices estaban significativamente asociados a AB: color de las heces, globulina, -GT, C3 y C4. Un modelo que incorporó el color de las heces, nivel de gamma-glutamil transpeptidasa, y nivel de C3 reflejó un área bajo la curva ROC (AUC) de 0,93, sensibilidad del 93% y especificidad del 83% para el diagnóstico de AB.
ConclusionesLos modelos que incorporan niveles séricos de C3 pueden ser de utilidad para diagnosticar AB de manera precisa en niños.
Biliary atresia (BA) is a destructive, inflammatory and obliterative cholangiopathy of neonates that affects the lengths of the intrahepatic and extrahepatic bile ducts.1 BA has a complex pathogenesis, typically manifests as cholestatic jaundice, and progresses rapidly to end-stage cirrhosis if not diagnosed and treated in a timely manner.2 The disease occurs with variable geographical frequency, ranging from 1 in 5000 live births per year in Taiwan to an estimated 1 in 15,000–19,000 live births per year in the United States and The Netherlands.3–6 Once diagnosed, BA is managed surgically by removing atretic biliary remnants and creating a Roux-en-Y intestinal conduit for bile drainage, a procedure known as Kasai hepatoportoenterostomy.7 However, the procedure is not effective in around half of patients, and the definitive treatment for BA is liver transplantation.2
Other conditions can cause cholestatic jaundice, and most will resolve completely with conservative management.7 Thus, it is vitally important to distinguish BA from other conditions that cause chole.2,7 Cholangiography and liver biopsy performed laparoscopically or via laparotomy are highly accurate for differentiating BA from other causes of cholestatic jaundice, but they are invasive and associated with risks inherent to invasive surgery.8,9 There is no consensus regarding the diagnosis of BA with non-invasive methods. However, studies have suggested that models incorporating levels of circulatory immune markers and other risk factors for BA may be useful for distinguishing BA from other causes of cholestatic jaundice.10–13
Thus, the purpose of this study was to develop a model incorporating lymphocyte subsets, immunoglobulin and complement levels in order to distinguish BA from other causes of cholestatic jaundice.
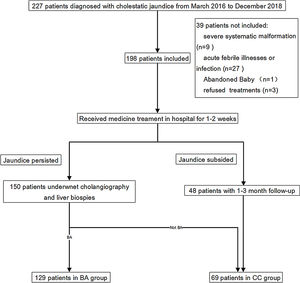
Patients and methodsPatients and study designThis was a retrospective study that used patient data and blood and tissue specimens collected in a previous clinical trial (ChiCTR1800015717). The prior clinical trial enrolled 227 patients who were newly diagnosed with cholestatic jaundice at the Guangzhou Women and Children's Medical Center in Guangzhou, China, between March 2016 and December 2018. Of the 227 patients, 35 were excluded for reasons including a recent acute febrile illnesses or infection, severe malformation of other organs or choledochal cysts. Thus, 192 patients were included in the trial, and were assigned to a BA group or a cholestasis control (CC) group. The flow chart of patient selection was shown in Supplemental Fig. 1. Group assignment and BA diagnosis was based on cholangiography and liver biopsy.
The current study was approved by the Ethics Committee of Guangzhou Women and Children's Medical Center (approval number 2016030304). Because of the retrospective nature of the study, the requirement of informed patient consent was waived. All patients provided written informed consent for participation in the prior clinical trial and for all procedures performed, and to have their data used for research purposes.
Patient characteristicsThe following data were collected in the clinical study and were extracted from the medical records for the current analysis. Demographic and clinical information included the patient sex, age, stool color at hospital admission and age in days at the time of surgery. Stool color was obtained by questioning parents at the time of admission. Hematological studies at the time of admission included total white blood cell (WBC) count, neutrophil count, monocyte count, lymphocyte count, and eosinophil count. Biochemical studies included serum aspartate aminotransferase (AST), alanine aminotransferase (ALT), albumin, globulin, total bilirubin, direct bilirubin, and gamma-glutamyl transpeptidase (γ-GT) levels.
Flow cytometryFlow cytometry for identification of lymphocytes was performed with a BD FACS Canto® II flow cytometer using commercially available antibodies (BD Multitest IMK Kit). Lymphocytes were identified by low side scatter, and moderate/bright CD45 expression. Back-gating on CD3-positive events was performed to avoid contamination by monocytes and other non-lymphocyte subsets. Lymphocyte subsets were counted as an absolute number, and a percentage of the total lymphocytes identified in the lymphocyte gate, according to the kit instructions.
Enzyme-linked immunosorbent assay (ELISA) measurement of immunoglobulin and complement levelsSerum IgG, IgA, IgM, and IgE and C3 and C4 levels were determined using an Immage® 800 instrument (Beckman Coulter, Inc.) with commercially available antibodies, according to the manufacturer's instructions.
Statistical analysisCategorical variables were presented as number (percentage). Continuous variables were presented as median (interquartile range [IQR]) if normality was not assumed; otherwise as mean±standard deviation. An assessment of the diagnostic performance of lymphocyte subsets and immunoglobulin and complement levels for diagnosis of BA was performed in 3 steps using γ-GT as the reference. First, all of the indices were compared between the BA group and the CC group using the Mann–Whitney U test or chi-square test, as appropriate. Second, Spearman correlation coefficients were determined and scatter plots were generated to further assess the relations among the parameters and relations with age. Third, univariate and multivariate logistic regression analyses were performed to determine the best combination of indicators for predicting BA. Independent variables with a value of P<0.10 in the univariate analysis were entered into the multivariate model. Variables found to be significant in the multivariate analysis were considered to be significantly associated with BA. Receiver operating characteristic (ROC) curve analysis was performed to examine the diagnostic value of different indicator combinations. The diagnostic values of the various combinations was assessed by examining the change (Δ) of the area under the ROC curve (AUC).14,15
All statistical analyses were 2-tailed and a value of P<0.05 was considered to indicate statistical significance. All analyses were performed using IBM SPSS version 20 statistical software (SPSS Statistics V20, IBM Corporation, Somers, New York).
ResultsSample size estimationSample size was estimated by software G*Power version 3.1 (Heinrich-Heine-Universität Düsseldorf, Düsseldorf, German). The effect size was conservatively set at a medium level of 0.5, type I error (alpha) of 0.05, power of 0.80, and the number of independent groups of 2 (BA and CC). The ratio of sample size between group (BA/CC) was set at 2. Statistical method was Mann–Whitney U test. The estimated minimum required sample size of BA and CC was 50 and 100, respectively.
In post hoc estimation of statistical power by the results of C3 and C4, the estimated statistical powers were 99.86% and 71.17%, respectively.
Considering the prior estimation of sample size and post hoc estimation of statistical power, the final sample sizes of both groups in this study were acceptable.
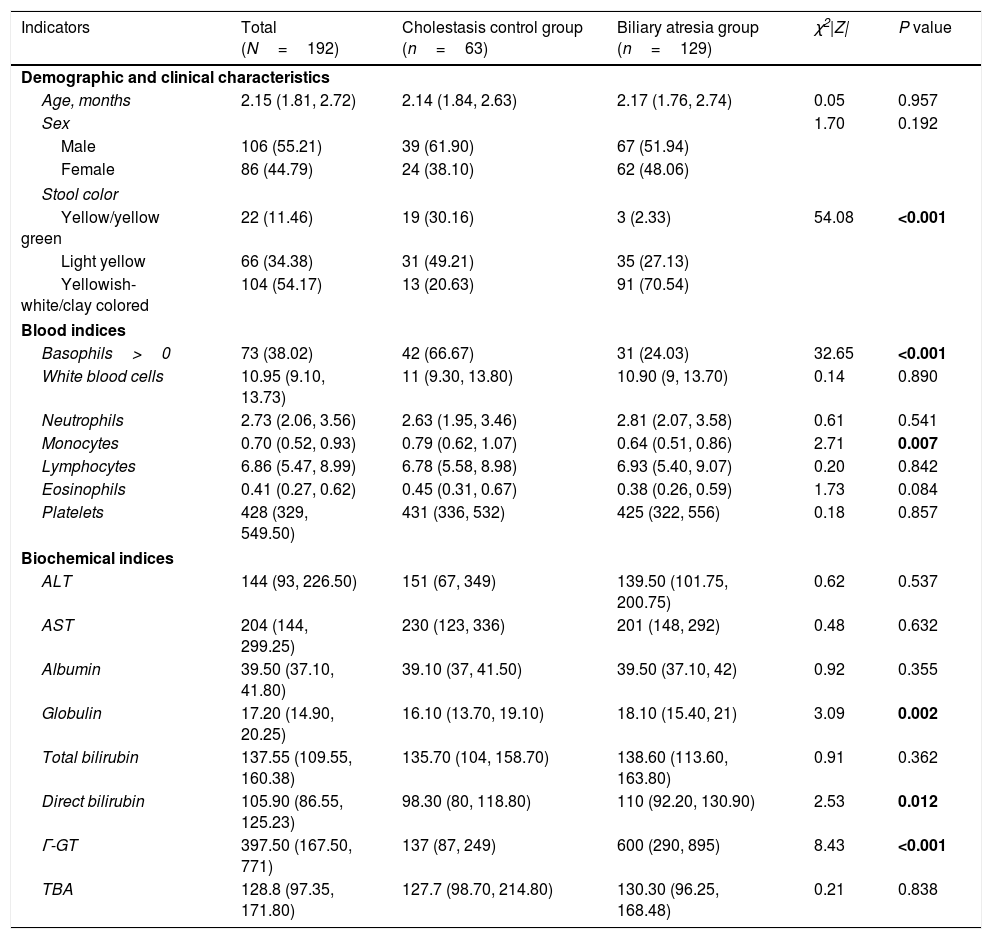
Patient characteristicsA total of 106 male and 86 female infants with a median age of 2.2 months (IQR: 1.8–2.7 months) were included in the current analysis. Of the 192 infants, 129 (67.2%) were included in the BA group and 63 cases (32.8%) were included in the CC group. In the CC group, there were 40 cases of neonatal cholestasis, 4 cases of congenital bile duct anomalies, and 19 cases of genetic and metabolic cholestatic diseases. Approximately three-quarters (70%) of the BA group had yellowish-white/clay colored stool on admission, which was significantly higher than that in the CC group (20%) (P<0.001). In the BA group, basophil count and monocyte count were significantly lower, and globulin, direct bilirubin and γ-GT levels were significantly higher than in the CC group (all P<0.05). Other demographic and laboratory characteristics were similar between the 2 groups (Table 1).
Patient demographic and clinical characteristics.
| Indicators | Total (N=192) | Cholestasis control group (n=63) | Biliary atresia group (n=129) | χ2|Z| | P value |
|---|---|---|---|---|---|
| Demographic and clinical characteristics | |||||
| Age, months | 2.15 (1.81, 2.72) | 2.14 (1.84, 2.63) | 2.17 (1.76, 2.74) | 0.05 | 0.957 |
| Sex | 1.70 | 0.192 | |||
| Male | 106 (55.21) | 39 (61.90) | 67 (51.94) | ||
| Female | 86 (44.79) | 24 (38.10) | 62 (48.06) | ||
| Stool color | |||||
| Yellow/yellow green | 22 (11.46) | 19 (30.16) | 3 (2.33) | 54.08 | <0.001 |
| Light yellow | 66 (34.38) | 31 (49.21) | 35 (27.13) | ||
| Yellowish-white/clay colored | 104 (54.17) | 13 (20.63) | 91 (70.54) | ||
| Blood indices | |||||
| Basophils>0 | 73 (38.02) | 42 (66.67) | 31 (24.03) | 32.65 | <0.001 |
| White blood cells | 10.95 (9.10, 13.73) | 11 (9.30, 13.80) | 10.90 (9, 13.70) | 0.14 | 0.890 |
| Neutrophils | 2.73 (2.06, 3.56) | 2.63 (1.95, 3.46) | 2.81 (2.07, 3.58) | 0.61 | 0.541 |
| Monocytes | 0.70 (0.52, 0.93) | 0.79 (0.62, 1.07) | 0.64 (0.51, 0.86) | 2.71 | 0.007 |
| Lymphocytes | 6.86 (5.47, 8.99) | 6.78 (5.58, 8.98) | 6.93 (5.40, 9.07) | 0.20 | 0.842 |
| Eosinophils | 0.41 (0.27, 0.62) | 0.45 (0.31, 0.67) | 0.38 (0.26, 0.59) | 1.73 | 0.084 |
| Platelets | 428 (329, 549.50) | 431 (336, 532) | 425 (322, 556) | 0.18 | 0.857 |
| Biochemical indices | |||||
| ALT | 144 (93, 226.50) | 151 (67, 349) | 139.50 (101.75, 200.75) | 0.62 | 0.537 |
| AST | 204 (144, 299.25) | 230 (123, 336) | 201 (148, 292) | 0.48 | 0.632 |
| Albumin | 39.50 (37.10, 41.80) | 39.10 (37, 41.50) | 39.50 (37.10, 42) | 0.92 | 0.355 |
| Globulin | 17.20 (14.90, 20.25) | 16.10 (13.70, 19.10) | 18.10 (15.40, 21) | 3.09 | 0.002 |
| Total bilirubin | 137.55 (109.55, 160.38) | 135.70 (104, 158.70) | 138.60 (113.60, 163.80) | 0.91 | 0.362 |
| Direct bilirubin | 105.90 (86.55, 125.23) | 98.30 (80, 118.80) | 110 (92.20, 130.90) | 2.53 | 0.012 |
| Γ-GT | 397.50 (167.50, 771) | 137 (87, 249) | 600 (290, 895) | 8.43 | <0.001 |
| TBA | 128.8 (97.35, 171.80) | 127.7 (98.70, 214.80) | 130.30 (96.25, 168.48) | 0.21 | 0.838 |
ALT, alanine aminotransferase; AST, aspartate aminotransferase; ALB, albumin; γ-GT, gamma-glutamyl transpeptidase; TBA; total bile acids.
Continuous variables were presented as median (IQR: interquartile range), and compared using the Mann–Whitney U test as they were non-normally distributed. Categorical variables were presented as number (percentage), and compared using the chi-square test. Bold values denote statistical significance at the P <0.05.
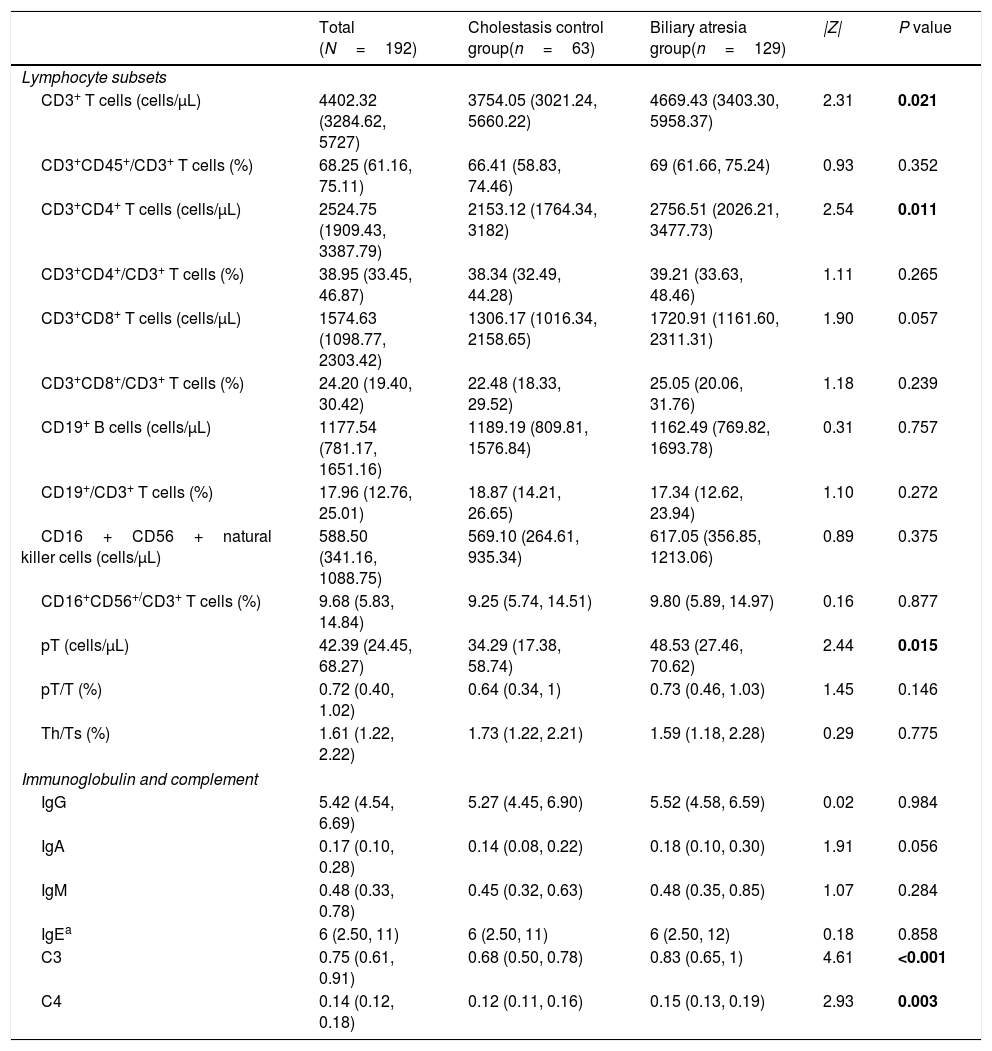
However, the levels of CD3+ T cells, CD3+CD4+ T cells premature T cells and the levels of C3 and C4 were all significantly higher in the BA group compared to the CC group (all P<0.05) (Table 2).
Lymphocyte subsets and immunoglobulin and complement levels in the biliary atresia and cholestasis control groups.
| Total (N=192) | Cholestasis control group(n=63) | Biliary atresia group(n=129) | |Z| | P value | |
|---|---|---|---|---|---|
| Lymphocyte subsets | |||||
| CD3+ T cells (cells/μL) | 4402.32 (3284.62, 5727) | 3754.05 (3021.24, 5660.22) | 4669.43 (3403.30, 5958.37) | 2.31 | 0.021 |
| CD3+CD45+/CD3+ T cells (%) | 68.25 (61.16, 75.11) | 66.41 (58.83, 74.46) | 69 (61.66, 75.24) | 0.93 | 0.352 |
| CD3+CD4+ T cells (cells/μL) | 2524.75 (1909.43, 3387.79) | 2153.12 (1764.34, 3182) | 2756.51 (2026.21, 3477.73) | 2.54 | 0.011 |
| CD3+CD4+/CD3+ T cells (%) | 38.95 (33.45, 46.87) | 38.34 (32.49, 44.28) | 39.21 (33.63, 48.46) | 1.11 | 0.265 |
| CD3+CD8+ T cells (cells/μL) | 1574.63 (1098.77, 2303.42) | 1306.17 (1016.34, 2158.65) | 1720.91 (1161.60, 2311.31) | 1.90 | 0.057 |
| CD3+CD8+/CD3+ T cells (%) | 24.20 (19.40, 30.42) | 22.48 (18.33, 29.52) | 25.05 (20.06, 31.76) | 1.18 | 0.239 |
| CD19+ B cells (cells/μL) | 1177.54 (781.17, 1651.16) | 1189.19 (809.81, 1576.84) | 1162.49 (769.82, 1693.78) | 0.31 | 0.757 |
| CD19+/CD3+ T cells (%) | 17.96 (12.76, 25.01) | 18.87 (14.21, 26.65) | 17.34 (12.62, 23.94) | 1.10 | 0.272 |
| CD16+CD56+natural killer cells (cells/μL) | 588.50 (341.16, 1088.75) | 569.10 (264.61, 935.34) | 617.05 (356.85, 1213.06) | 0.89 | 0.375 |
| CD16+CD56+/CD3+ T cells (%) | 9.68 (5.83, 14.84) | 9.25 (5.74, 14.51) | 9.80 (5.89, 14.97) | 0.16 | 0.877 |
| pT (cells/μL) | 42.39 (24.45, 68.27) | 34.29 (17.38, 58.74) | 48.53 (27.46, 70.62) | 2.44 | 0.015 |
| pT/T (%) | 0.72 (0.40, 1.02) | 0.64 (0.34, 1) | 0.73 (0.46, 1.03) | 1.45 | 0.146 |
| Th/Ts (%) | 1.61 (1.22, 2.22) | 1.73 (1.22, 2.21) | 1.59 (1.18, 2.28) | 0.29 | 0.775 |
| Immunoglobulin and complement | |||||
| IgG | 5.42 (4.54, 6.69) | 5.27 (4.45, 6.90) | 5.52 (4.58, 6.59) | 0.02 | 0.984 |
| IgA | 0.17 (0.10, 0.28) | 0.14 (0.08, 0.22) | 0.18 (0.10, 0.30) | 1.91 | 0.056 |
| IgM | 0.48 (0.33, 0.78) | 0.45 (0.32, 0.63) | 0.48 (0.35, 0.85) | 1.07 | 0.284 |
| IgEa | 6 (2.50, 11) | 6 (2.50, 11) | 6 (2.50, 12) | 0.18 | 0.858 |
| C3 | 0.75 (0.61, 0.91) | 0.68 (0.50, 0.78) | 0.83 (0.65, 1) | 4.61 | <0.001 |
| C4 | 0.14 (0.12, 0.18) | 0.12 (0.11, 0.16) | 0.15 (0.13, 0.19) | 2.93 | 0.003 |
Continuous variables were presented as median (IQR: interquartile range), and compared using the Mann–Whitney U test as they were non-normally distributed. Bold values denote statistical significance at the P <0.05.
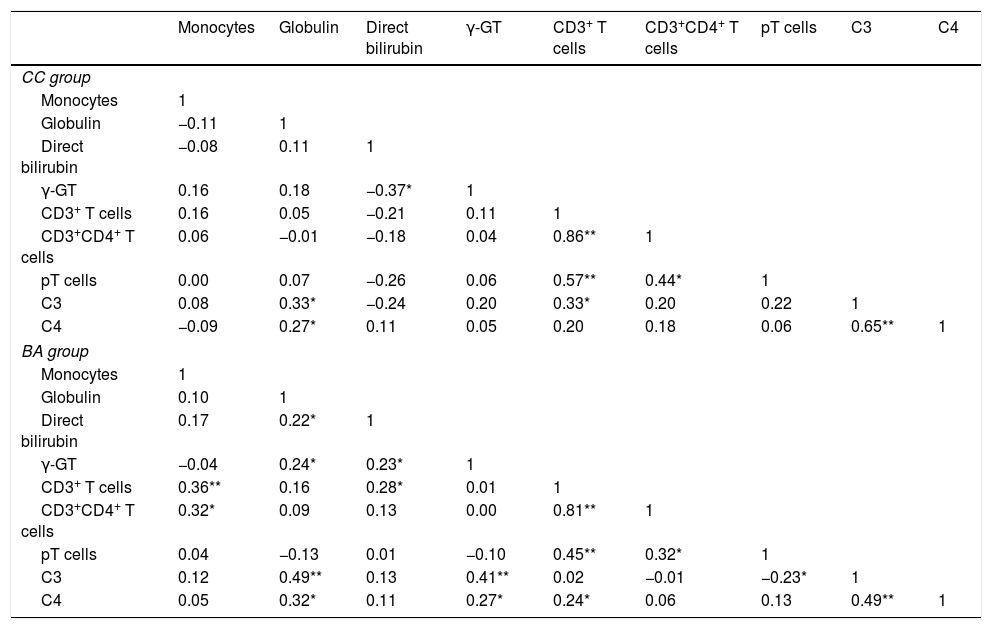
Analysis indicated that monocytes, globulin, direct bilirubin, γ-GT, CD3+ T cells, CD3+CD4+ T cells, pT cells, C3 and C4 were significantly associated with BA (all P<0.05). However, pair-wise correlation analyses indicated that C3 and C4 had a significant positive correlation with γ-GT in the BA group, but not in the CC group (Table 3).
Pair-wise correlation matrix of monocytes, globulin, direct bilirubin, γ-GT, CD3+T cells, CD3+CD4+ T cells, pT cells, and C3 and C4 in the biliary atresia and cholestasis control groups.
| Monocytes | Globulin | Direct bilirubin | γ-GT | CD3+ T cells | CD3+CD4+ T cells | pT cells | C3 | C4 | |
|---|---|---|---|---|---|---|---|---|---|
| CC group | |||||||||
| Monocytes | 1 | ||||||||
| Globulin | −0.11 | 1 | |||||||
| Direct bilirubin | −0.08 | 0.11 | 1 | ||||||
| γ-GT | 0.16 | 0.18 | −0.37* | 1 | |||||
| CD3+ T cells | 0.16 | 0.05 | −0.21 | 0.11 | 1 | ||||
| CD3+CD4+ T cells | 0.06 | −0.01 | −0.18 | 0.04 | 0.86** | 1 | |||
| pT cells | 0.00 | 0.07 | −0.26 | 0.06 | 0.57** | 0.44* | 1 | ||
| C3 | 0.08 | 0.33* | −0.24 | 0.20 | 0.33* | 0.20 | 0.22 | 1 | |
| C4 | −0.09 | 0.27* | 0.11 | 0.05 | 0.20 | 0.18 | 0.06 | 0.65** | 1 |
| BA group | |||||||||
| Monocytes | 1 | ||||||||
| Globulin | 0.10 | 1 | |||||||
| Direct bilirubin | 0.17 | 0.22* | 1 | ||||||
| γ-GT | −0.04 | 0.24* | 0.23* | 1 | |||||
| CD3+ T cells | 0.36** | 0.16 | 0.28* | 0.01 | 1 | ||||
| CD3+CD4+ T cells | 0.32* | 0.09 | 0.13 | 0.00 | 0.81** | 1 | |||
| pT cells | 0.04 | −0.13 | 0.01 | −0.10 | 0.45** | 0.32* | 1 | ||
| C3 | 0.12 | 0.49** | 0.13 | 0.41** | 0.02 | −0.01 | −0.23* | 1 | |
| C4 | 0.05 | 0.32* | 0.11 | 0.27* | 0.24* | 0.06 | 0.13 | 0.49** | 1 |
γ-GT, gamma-glutamyl transpeptidase.
The γ-GT level was correlated with age in the BA group (rsBA=0.3, P=0.003), but not in the CC group. Similarly, globulin level was correlated with age in the BA group (rsBA=0.3, P=0.002), but not in the CC group. The correlation coefficients of all other indices examined with respect to age were not statistically significant, indicating the indices were stable with age (Fig. 1).
Investigation of factors associated with BA
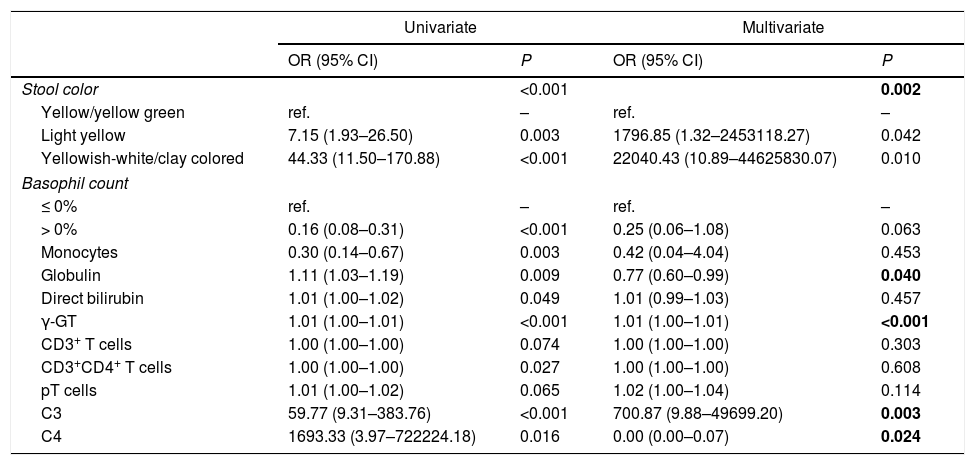
Independent variables, which were significantly different between the BA and CC groups, were analyzed by univariate and multivariate logistic regression. As shown in Tables 4 and 5, indices were found to be significantly associated with BA: stool color, globulin, γ-GT, C3 and C4. With respect to stool color, light yellow and yellowish-white/clay colored were both associated with a higher risk of BA than yellow/yellow green stool. Of the other indices, higher globulin level and higher C4 level were associated with a lower risk of BA, while higher γ-GT level and higher C3 level were associated with a higher risk of BA.
Investigation of indices associated with biliary atresia and cholestasis of other causes.
| Univariate | Multivariate | |||
|---|---|---|---|---|
| OR (95% CI) | P | OR (95% CI) | P | |
| Stool color | <0.001 | 0.002 | ||
| Yellow/yellow green | ref. | – | ref. | – |
| Light yellow | 7.15 (1.93–26.50) | 0.003 | 1796.85 (1.32–2453118.27) | 0.042 |
| Yellowish-white/clay colored | 44.33 (11.50–170.88) | <0.001 | 22040.43 (10.89–44625830.07) | 0.010 |
| Basophil count | ||||
| ≤ 0% | ref. | – | ref. | – |
| > 0% | 0.16 (0.08–0.31) | <0.001 | 0.25 (0.06–1.08) | 0.063 |
| Monocytes | 0.30 (0.14–0.67) | 0.003 | 0.42 (0.04–4.04) | 0.453 |
| Globulin | 1.11 (1.03–1.19) | 0.009 | 0.77 (0.60–0.99) | 0.040 |
| Direct bilirubin | 1.01 (1.00–1.02) | 0.049 | 1.01 (0.99–1.03) | 0.457 |
| γ-GT | 1.01 (1.00–1.01) | <0.001 | 1.01 (1.00–1.01) | <0.001 |
| CD3+ T cells | 1.00 (1.00–1.00) | 0.074 | 1.00 (1.00–1.00) | 0.303 |
| CD3+CD4+ T cells | 1.00 (1.00–1.00) | 0.027 | 1.00 (1.00–1.00) | 0.608 |
| pT cells | 1.01 (1.00–1.02) | 0.065 | 1.02 (1.00–1.04) | 0.114 |
| C3 | 59.77 (9.31–383.76) | <0.001 | 700.87 (9.88–49699.20) | 0.003 |
| C4 | 1693.33 (3.97–722224.18) | 0.016 | 0.00 (0.00–0.07) | 0.024 |
CI, confidence interval; OR, odds ratio; γ-GT, gamma-glutamyl transpeptidase.
Independent variables with a value of P<0.10 in the univariate analysis were entered into the multivariate analysis. In the multivariate analysis, independent variables with a value of P<0.05 were considered associated variables. Bold values denote statistical significance at the P <0.05.
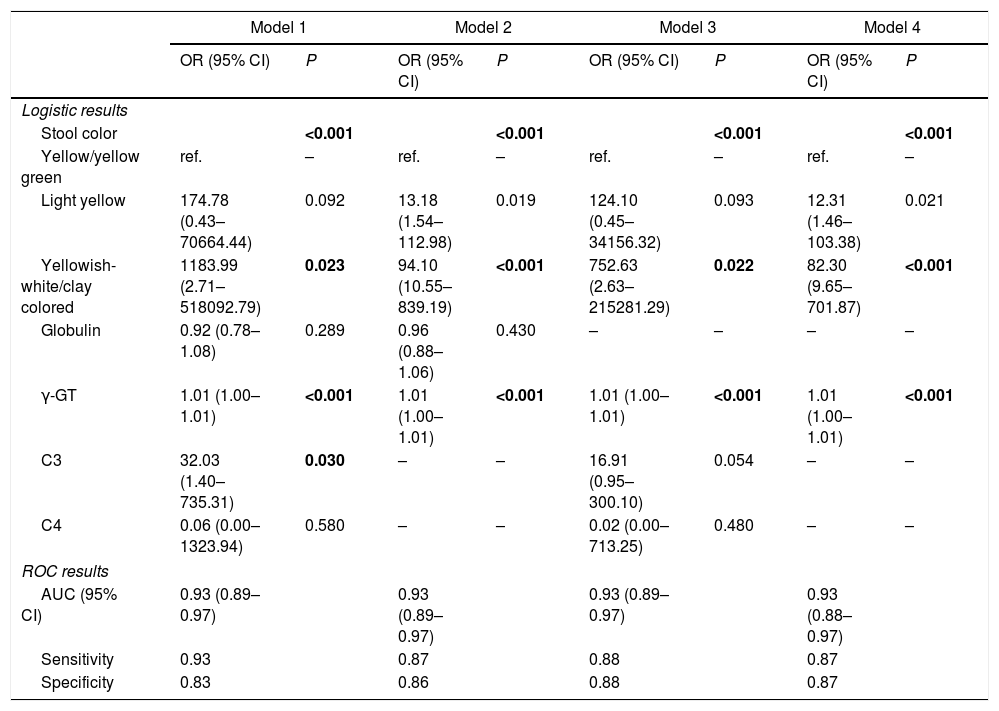
Different multivariate logistic regression models and corresponding ROC analysis results.
| Model 1 | Model 2 | Model 3 | Model 4 | |||||
|---|---|---|---|---|---|---|---|---|
| OR (95% CI) | P | OR (95% CI) | P | OR (95% CI) | P | OR (95% CI) | P | |
| Logistic results | ||||||||
| Stool color | <0.001 | <0.001 | <0.001 | <0.001 | ||||
| Yellow/yellow green | ref. | – | ref. | – | ref. | – | ref. | – |
| Light yellow | 174.78 (0.43–70664.44) | 0.092 | 13.18 (1.54–112.98) | 0.019 | 124.10 (0.45–34156.32) | 0.093 | 12.31 (1.46–103.38) | 0.021 |
| Yellowish-white/clay colored | 1183.99 (2.71–518092.79) | 0.023 | 94.10 (10.55–839.19) | <0.001 | 752.63 (2.63–215281.29) | 0.022 | 82.30 (9.65–701.87) | <0.001 |
| Globulin | 0.92 (0.78–1.08) | 0.289 | 0.96 (0.88–1.06) | 0.430 | – | – | – | – |
| γ-GT | 1.01 (1.00–1.01) | <0.001 | 1.01 (1.00–1.01) | <0.001 | 1.01 (1.00–1.01) | <0.001 | 1.01 (1.00–1.01) | <0.001 |
| C3 | 32.03 (1.40–735.31) | 0.030 | – | – | 16.91 (0.95–300.10) | 0.054 | – | – |
| C4 | 0.06 (0.00–1323.94) | 0.580 | – | – | 0.02 (0.00–713.25) | 0.480 | – | – |
| ROC results | ||||||||
| AUC (95% CI) | 0.93 (0.89–0.97) | 0.93 (0.89–0.97) | 0.93 (0.89–0.97) | 0.93 (0.88–0.97) | ||||
| Sensitivity | 0.93 | 0.87 | 0.88 | 0.87 | ||||
| Specificity | 0.83 | 0.86 | 0.88 | 0.87 | ||||
AUC, area under the receiver operating characteristic (ROC) curve; CI, confidence interval; γ-GT, gamma-glutamyl transpeptidase; OR, odds ratio. Bold values denote statistical significance at the P <0.05.
The 5 aforementioned associated indices were examined in different combinations for their diagnostic value. All of the multivariate logistic regression results and corresponding ROC analysis results of the different models are summarized in Table 5. In Model 1 and Model 2, globulin level was not a stable predictor of BA, and after removing globulin level, the value of C3 and C4 became insignificant. Comparison of the different models indicated that stool color and γ-GT were stable (significant) indices associated with BA. The AUC of Model 4 was 0.93 (95% confidence interval [CI]: 0.88–0.97), with a sensitivity of 87% and a specificity of 87%. Adding C3 and C4 to model 4 did not significantly improve the diagnostic accuracy for determining BA (ΔAUC<0.01, P>0.05).
The ROC curves of the 4 models indicate there are only slight differences among the different models (Fig. 2).
Discussion curves of (A) Model 1; (B) Model 2; (C) Model 3; and (D) Model 4.")
In this study, we found that serum complement C3 and C4 levels were significantly increased in the BA group compared to CC group, and were positively correlated with γ-GT, globulin and stool color in patients with BA, irrespective of age. However, the addition of C3 and C4 to the most useful model did not improve the diagnostic accuracy.
Accurately distinguishing BA from other cholestatic diseases is crucial because most cholestatic diseases will resolve completely with conservative treatment, while BA requires surgery. There is currently no single diagnostic tool that can non-invasively provide a definitive diagnosis of BA. Rather, a number of diagnostic tools are collectively used to establish a diagnosis. Recently, The Childhood Liver Disease Research Network reported an optimized prediction model (AUC=0.89) that uses 7 clinical variables: sex, acholic stools, normal facial features, γ-GT, weighted Z-score, palpable liver below the costal margin and a sonographically absent gallbladder.16 However, the high precision required to differentiate BA from non-BA was not achieved: a predicted probability of >0.8 yielded an 81% true positive rate for BA and <0.2 yielded an 11% false negative rate. In another study, a nomogram model was developed using a large respective cohort of Chinese patients.17 The model included 5 indices: sex, weight, direct bilirubin, alanine aminotransferase and γ-GT. While the model displayed a high sensitivity and positive predictive value (PPV), the specificity was low. Interestingly, a study showed that including γ-GT can improve the accuracy of BA diagnosis.18
As the aforementioned studies suggest, the existing diagnostic methods are insufficient for establishing a diagnosis of BA. Other studies, however, have suggested that circulatory immune markers, in combination with γ-GT, may be valuable in the diagnosis of liver diseases.12,13,17,19 Based on these, studies, we sought to determine the value of immune markers in the diagnosis of BA. Our results suggest that serum C3 level may be useful for distinguishing BA from other causes of cholestasis.
Our results raise the question of why serum C3 level is increased in BA. While the pathogenesis of BA is not completely understood, studies have indicated that abnormal inflammation and autoimmunity play key roles in the disease process.2 Elevations of serum C3 in BA may be responsible for liver inflammation and fibrosis associated with the disease.20 Three large clinical studies have confirmed an association between serum C3 levels and non-alcoholic fatty liver disease (NAFLD).21–23 However, few studies examining the complement system and BA have been published. In 1983, Larcher et al.24 measured C3 and C4 concentrations in sera from 69 children with liver disease and 39 controls, and reported mean serum C3 and C4 concentrations were not different between children with BA (9 cases) and controls. In another study, 11 potential serum biomarkers, including C3, were identified by 2-dimensional difference gel electrophoresis; however, no single biomarker reliably distinguished BA from neonatal cholestasis, although the sample size of the study was small.13
Much research on BA has examined the cell-mediated immune response seen in liver tissue. Histologically examination of liver tissues from patients with BA found that C4d complement was expressed in the endothelium of the portal vein.25 Another study showed an increased concentration of the C3 complement effector protein during the progression of liver regeneration26 and hence may be an independent protective factor for BA. Other studies of patients with liver cirrhosis indicated that serum concentrations of C3 correlated negatively with Child–Pugh score, regardless of the cause of cirrhosis.27–30 Taken together these data suggest that C3 is involved in the course of BA, and monitoring serum C3 levels may be useful for determining the deterioration of liver function in BA. However, prospective studies are needed to confirm this hypothesis.
This study is limited in part by its retrospective nature and the statistical power associated with the relatively small number of patients. For the sample of 129 BA cases and 63 CC controls, the statistical power to detect a C3 level difference of 0.1 is approximately 76%. Furthermore, the relatively low number of patients in the control group may have resulted in biased data selection.
ConclusionsThe results of this study suggest that a model incorporating serum C3 level may be useful for diagnosing BA in infants, and potentially avoid the need for invasive diagnostic procedures. The role of C3 in the pathogenesis of BA is unknown and further in vitro and in vivo studies are needed. Based on the results of this study, further studies incorporating serum C3 level into predictive models for BA are warranted. Accurate, non-invasive methods to diagnosis BA, or rule out BA, may help avoid unnecessary invasive diagnostic procedures.
FundingThis study was supported by funds from the Guangzhou Women and Children's Medical Center/Guangzhou Institute of Pediatrics [No: 0160038].
Conflict of interestNone.
We thank our colleagues from the clinical laboratory department of Guangzhou Women and Children's Medical Center for their assistance.