


To identify glutamic pyruvic transaminase (GPT) and hepatitis B virus DNA (HBV-DNA) cut-off values at diagnosis in patients with hepatitis B virus e antigen-negative chronic infection (HBeAg(−)), which may be predictors of clinical course, prognosis and/or the need for antiviral therapy.
MethodsA retrospective and observational cohort study of patients diagnosed with HBeAg(−) chronic infection (2005–2012). A normal GPT cut-off value at diagnosis that predicts abnormal GPT values in the clinical course of the infection, a baseline HBV-DNA cut-off value that predicts an increase in HBV-DNA above 2000IU/ml, and GPT and HBV-DNA as predictors of the need for treatment were investigated using ROC curves.
Results126 patients were enrolled (follow-up: 42.1±21.5months), 93 of which had normal GPT levels at diagnosis. In the ROC curve analysis, 900IU/ml was found to be the HBV-DNA cut-off value that best predicted this value's increase above 2000IU/ml (sensitivity: 90%; specificity: 88%; PPV: 79%; NPV: 100%; diagnostic precision: 89%), while 25mU/ml was the normal GPT cut-off value at diagnosis that best predicted subsequently elevated GPT levels (sensitivity: 95.4%; specificity: 81.6%; PPV: 67%; NPV: 96%; diagnostic precision: 80.6%). Patients with GPT 26–40mU/ml at diagnosis presented with more complications or required more treatment than subjects with GPT≤25mU/ml (p<0.05). The combined GPT and HBV-DNA values that elicited the highest treatment need were 38mU/ml of GPT and 6000IU/ml of HBV-DNA (sensitivity: 75%; specificity: 93.4%; PPV: 60%; NPV: 96.6%).
ConclusionHBeAg(−) patients with GPT<25mU/ml and HBV-DNA<900IU/ml at diagnosis have positive outcomes and may not require such stringent follow-up in the first years after diagnosis.
Buscar puntos de corte de la glutámico-pirúvica transaminasa (GPT) y de ADN del virus de hepatitis B (ADN-VHB) al diagnóstico, en pacientes con infección crónica VHB antígeno e negativo (AgHBe(–)), que puedan ser predictores de la evolución, pronóstico y/o de la necesidad de terapia antiviral.
MétodosEstudio observacional de cohortes retrospectivo de pacientes diagnosticados de infección crónica por VHB AgHBe(–) (2005-2012). Se investigó un punto de corte de GPT normal al diagnóstico que predijera la alteración de esta en la evolución, de ADN-VHB basal que predijera la elevación de este por encima de 2.000UI/ml, y de GPT y ADN-VHB como predictores de la necesidad de tratamiento, mediante curvas ROC.
ResultadosSe incluyeron 126 pacientes (seguimiento: 42,1±21,5meses), de los cuales 93 tenían GPT normal al diagnóstico. En el análisis de curvas ROC el punto de corte de ADN-VHB que mejor predijo la elevación de este por encima de 2.000UI/ml fue 900UI/ml (sensibilidad: 90%; especificidad: 88%; VPP: 79%; VPN: 100%; precisión diagnóstica: 89%), y el que mejor predijo la alteración de GPT normal al diagnóstico posteriormente elevada fue 25mU/ml (sensibilidad: 95,4%; especificidad: 81,6%; VPP: 67%; VPN: 96%; precisión diagnóstica: 80,6%). Los pacientes con GPT 26-40mU/ml al diagnóstico presentaron más complicaciones o necesidad de tratamiento que aquellos con GPT≤25mU/ml (p<0,05). La combinación de GPT y ADN-VHB que maximizó la necesidad de tratamiento fue 38mU/ml de GPT y 6.000UI/ml de ADN-VHB (sensibilidad: 75%; especificidad: 93,4%; VVP: 60%; VPN: 96,6%).
ConclusiónLos pacientes VHB AgHBe(–) con GPT<25mU/ml y ADN-VHB<9.000UI/ml al diagnóstico presentan buena evolución y podrían no requerir un seguimiento tan estrecho en los primeros años desde el diagnóstico.
Chronic hepatitis B virus (HBV) infection is a public health problem worldwide. It is estimated that 350–400million people in the world have chronic HBV infection1 and that some 620,000 people die each year in connection with this infection.2,3
Chronic HBeAg(−) infection occurs after hepatitis B e antigen (HBeAg) seroconversion, with loss of HBeAg and the development of anti-HBeAg antibodies during the immune-reactive phase, representing one of the final stages of the natural history of the infection. In 75% of cases, individuals change from the immune-reactive HBeAg(+) state to the inactive HBV carrier (IC) state, characterised by persistently normal glutamic-pyruvic transaminase (GPT) levels, low deoxyribonucleic acid (DNA) levels and little or no histological involvement. In the remaining 25%, HBeAg seroconversion leads to chronic hepatitis due to HBeAg(−) HBV (HBc), or directly, largely due to mutations in the nucleotides of the precore and/or core promoter region; or, secondarily, to reactivation from IC, characterised by reactivation with fluctuating levels of HBV DNA (HBV-DNA), aminotransferases and active hepatitis.4
The chronic HBeAg(−) infection stage was first reported in Mediterranean countries,5,6 but is currently reported worldwide.7 Recent studies in Europe, Asia and the United States describe an increasing prevalence of these types of patients,8–11 currently accounting for 85–90% of patients. In our recently published series,12 such patients account for 87.61% of all patients, similar to other studies recently published in Spain13,14 and in other areas of the world.15–24
At present, any patient recently diagnosed with chronic HBV HBeAg(−) infection needs close monitoring for the first few months after diagnosis to determine the stage of the disease. In recent years, several studies have been published to determine if other cut-off values for normal GPT could be more appropriate for correctly classifying HBeAg(−) patients and for detecting patients with significant histological impairment; there are papers in favour25–32 and against33–38 such cut-off values. We therefore set out to investigate whether there were any GPT and HBV-DNA cut-off values at diagnosis that could predict changes in these values over the clinical course of the infection, observing if they could be predictors of poor prognosis and/or the need for treatment during the first few years of follow-up, which could help in managing these types of patients.
Materials and methodsPatientsObservational, retrospective cohort study of patients diagnosed with chronic HBV HBeAg(−) infection at the time of diagnosis from 1 June 2005 to 1 July 2011 for the inclusion of patients, with follow-up until 31 December 2012.
All patients over the age of 13 who were HBsAg-positive for more than 6 months, with HBeAg(−) and anti-HBeAg(+), and 3 or more blood tests with GPT and HBV-DNA levels were included. The following patients were excluded: HIV, HCV and/or HDV co-infected patients; presence of advanced kidney failure (defined as creatinine clearance <30ml/min and/or dialysis), other associated liver diseases (thyroid hormone levels, autoimmunity, iron tests [haemochromatosis gene if 2 TS values >45%], urine porphyrins, alpha-1 antitrypsin, cupremia, urine copper and ceruloplasmin); patients with type 2 obesity or higher (body mass index [BMI]≥35kg/m2), steatohepatitis in liver biopsy, cirrhosis the cause of which is not clearly related to chronic HBV infection and alcohol consumption ≥40g/day, plus those patients who had received prior treatment for HBV infection.
Clinical-analytical features at diagnosis were collected. Over the course of the study, analytical, serological and HBV-DNA data were collected every 6±2 months by polymerase chain reaction (PCR) and an ultrasound was performed every 6 months in cirrhotic patients and every 1–2 years in non-cirrhotic patients.
Space-occupying lesions >1cm were diagnosed as hepatocellular carcinoma (HCC) in patients with liver cirrhosis who had at least one imaging test (tomography and/or magnetic resonance imaging with contrast) showing typical HCC findings (arterial phase imaging and portal venous or delayed phase wash-out). A histological study was also performed in patients with atypical or suspicious radiology findings and in those with no liver cirrhosis.
The development of cirrhosis, related complications (decompensated liver disease with oedema/ascites [DLD], hepatic encephalopathy [HE], upper gastrointestinal bleeding due to oesophageal varices [UGB], HCC), need for treatment or death associated with chronic HBV infection were considered unfavourable hepatic events.
Different PCR techniques were used to determine viral load: from June 2005 to February 2009, Cobas Amplicor HBV Monitor (Roche Diagnostics); from March to November 2009, Cobas Ampliprep/Cobas Taqman HBV test (Roche Diagnostics); and from December 2009 to December 2012, Cobas Ampliprep/Cobas Taqman HBV test version 2.0 (Roche Diagnostics).
The liver fibrosis study was carried out by liver biopsy (METAVIR39 classification) or Fibroscan®, as instructed in the clinical guidelines in effect at that time. Patients with low DNA-HBV levels (<2000IU/ml), persistently normal GPT (<40mU/ml), no suspected fibrosis (blood tests, examination or ultrasound) were not considered to have liver disease. A liver biopsy or Fibroscan® were therefore not performed as procedures were only performed in patients with suspicious findings. The following categories were established for this study: normal liver biopsy or minimal changes (A0-F0), cirrhosis (F4) and different stages of fibrosis. If no liver biopsy was performed but Fibroscan® was performed, the different stages of liver fibrosis were classified according to the values given in the study by Viganò et al.40: F0-1 (2.5–6.2kPa), normal; F2-3 (6.2–13.1kPa), different stages of fibrosis; and F4 (>13.1kPa), cirrhosis. In turn, patients with clinical-analytical data or definitive imaging tests of cirrhosis (chronic liver disease with portal hypertension), in whom a liver biopsy or Fibroscan® was not required to reach a diagnosis, were included as cirrhotic patients. Therefore, 43 patients (46.2%) required a liver fibrosis study, with a liver biopsy performed in 21 (48.84%) and Fibroscan® in 22 (51.16%).
Clinical follow-up of patients continued until the last check-up at the hepatology clinic. The very last follow-up HBV serology test was included in the analytical study, which included only those patients with 3 or more blood tests during follow-up. For patients who required medical treatment for chronic HBV infection (based on the indications given in the European Association of the Study of the Liver [EASL] clinical practice guideline in effect at that time), the clinical follow-up ran until the date of the consultation in which treatment started and the analytical follow-up ran until the last blood test prior to treatment.
The study was approved by our centre's Ethics Committee.
Statistical analysisA comparative analysis of persistently normal GPT (PNGPT) vs intermittently elevated GPT (IEGPT) was carried out. The non-parametric Mann–Whitney U test was used for this comparative analysis, while the chi-square test was used for qualitative variables.
ROC curves were used to find the normal GPT value at diagnosis that best predicted rises in this value over the course of the study. Sensitivity (S), specificity (SP), positive predictive value (PPV) and negative predictive value (NPV) were obtained from this point. Once this was determined, a comparative analysis comparing the new GPT cut-off value without taking gender into account and the classic value of 30mU/ml in men and 19mU/ml in women was performed using the same tests described above. GPT below this cut-off value, but within the normal GPT range, is considered normal low GPT and GPT between this cut-off value and 39mU/ml is considered normal high GPT. A fluctuation analysis was performed based on these cut-off values, also taking into account the poor prognosis factors of each group in the study.
We built a GPT fluctuation prediction model from normal baseline values to elevated values using a logistic model into which we entered fluctuations (or non-fluctuations) of this value during patient follow-up as the dependent variable and fluctuations that were significantly different in the previous analysis as the independent variable. The results are shown as OR and 95% confidence interval.
A comparative analysis of two GPT cut-off values (considering and not considering gender) was performed in patients with normal GPT (<40mU/ml) at diagnosis, evaluating whether there are significant differences in baseline characteristics, formation of groups based on changes in GPT and poor prognosis factors.
Finally, an ROC curve analysis was performed to evaluate which DNA-HBV value <2000IU/ml at diagnosis best predicts its rise above 2000IU/ml over the course of the disease and to evaluate a combined GPT and DNA-HBV cut-off value at diagnosis that predicts the need for treatment upon progression.
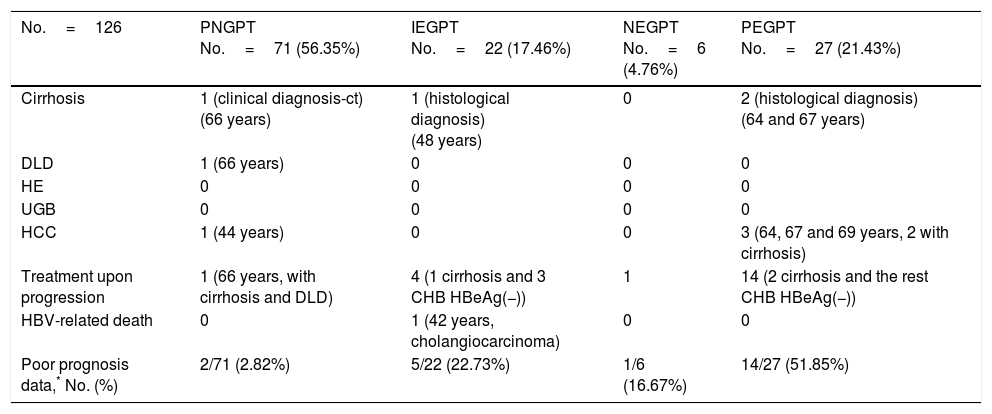
ResultsA total of 216 patients with HBsAg(+) were detected. 126 patients met the inclusion criteria (mean follow-up of 42.1±21.5 months) and their baseline characteristics can be viewed in a recent publication by our group.41Fig. 1 shows a flow chart of GPT at diagnosis and during follow-up and Table 1 shows unfavourable hepatic events based on the groups formed according to GPT.

Flow chart of normal or elevated GPT at diagnosis and over the course of the disease. Percentage of peak HBV-DNA reached in each group. GPT: glutamic-pyruvic transaminase; IEGPT: normal and then elevated GPT; NEGPT: elevated GPT at diagnosis that normalised during the course of the disease; pDNA: peak HBV deoxyribonucleic acid; PEGPT: persistently elevated GPT; PNGPT: persistently normal GPT.
Unfavourable hepatic events based on the groups formed with GPT cut-off value of 40mU/ml.
| No.=126 | PNGPT No.=71 (56.35%) | IEGPT No.=22 (17.46%) | NEGPT No.=6 (4.76%) | PEGPT No.=27 (21.43%) |
|---|---|---|---|---|
| Cirrhosis | 1 (clinical diagnosis-ct) (66 years) | 1 (histological diagnosis) (48 years) | 0 | 2 (histological diagnosis) (64 and 67 years) |
| DLD | 1 (66 years) | 0 | 0 | 0 |
| HE | 0 | 0 | 0 | 0 |
| UGB | 0 | 0 | 0 | 0 |
| HCC | 1 (44 years) | 0 | 0 | 3 (64, 67 and 69 years, 2 with cirrhosis) |
| Treatment upon progression | 1 (66 years, with cirrhosis and DLD) | 4 (1 cirrhosis and 3 CHB HBeAg(−)) | 1 | 14 (2 cirrhosis and the rest CHB HBeAg(−)) |
| HBV-related death | 0 | 1 (42 years, cholangiocarcinoma) | 0 | 0 |
| Poor prognosis data,* No. (%) | 2/71 (2.82%) | 5/22 (22.73%) | 1/6 (16.67%) | 14/27 (51.85%) |
CHB: chronic hepatitis B; ct: complementary tests; DLD: decompensated liver disease with oedema and ascites; GPT: glutamic-pyruvic transaminase; HBeAg(−): HBV e antigen-negative; HBV: hepatitis B virus; HCC: hepatocellular carcinoma; HE: hepatic encephalopathy; IEGPT: intermittently elevated GPT; NEGPT: elevated GPT at diagnosis that normalised during the course of the disease; PEGPT: persistently elevated GPT; PNGPT: persistently normal GPT; UGB: upper gastrointestinal bleeding.
Of the 126 patients included, 93 had normal GPT at diagnosis. Of these 93 patients, a comparative analysis of patients with PNGPT (71 (76.3%)) vs IEGPT (22 (23.7%)) was performed. With regard to demographic variables, there were no significant differences in age (37.9 [31.9–45.9] vs 37.1 [32.3–47.8]; p=0.93) or nationality (38% vs 41%; p=0.8) but there were significant differences in gender, with 72.7% of patients with IEGPT being male vs 32.39% of patients with PNGPT (p=0.001). Baseline analytical variables showed significant differences in GOT (20 [17–23] vs 26 [23–31.2]mU/ml), GPT (21 [16–24] vs 32 [28.5–36.2]mU/ml) and median GGT (14 [9–19] vs 20 [13–35.2]mU/ml), with higher values in the IEGPT group (p<0.05). In turn, both peak (25 [19–29] vs 92 [60.2–140.5]mU/ml and trough (16 [13–18] vs 40 [24.2–50.7] mU/ml) GPT values were higher in patients with IEGPT (p<0.05). The median viral load at diagnosis of both groups was PNGPT 811 (144–3520) vs IEGPT 940 (600–17,000), p=0.37. The percentage of patients with DNA>20,000IU/ml was significantly higher in patients with IEGPT (4.23% vs 18.1%; p=0.03). A higher frequency of cirrhosis was observed in the IEGPT group (9% vs 3.1%) and more normal results were observed in the PNGPT group (71.8% vs 54.5%), without reaching statistical significance (p=0.50).
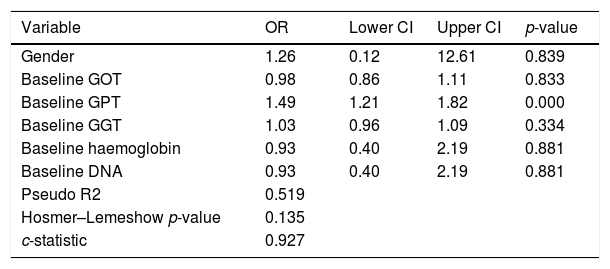
We performed an ROC curve analysis that allowed us to find a GPT value at diagnosis that predicts fluctuations from this baseline value to an elevated value above 39mU/ml during the course of the disease. The highest point in both statistics was 25mU/ml, with a percentage of correctly classified patients of 80.6% (S: 95.4%; SP: 81.6%; PPV: 67.7%; NPV: 96.6%) (area under the ROC curve: 0.927). We performed a univariate logistic regression in order to find out the risk of elevated GPT according to its baseline value, entering the GPT group as the dependent variable and whether the individual has a baseline GPT above 25mU/ml or not as the independent variable, obtaining an OR of 44.6 (p<0.001). The result of the multivariate GPT fluctuation prediction model from normal baseline values to elevated values is shown in Table 2, where we can see that the baseline GPT value determines the change in GPT. In other words, with each mU/ml increase in GPT at diagnosis, there is risk of GPT fluctuating to elevated values of 49%.
Multivariate model in patients with normal baseline GPT followed by elevated GPT according to GOT, GPT, GGT, haemoglobin and baseline DNA.
| Variable | OR | Lower CI | Upper CI | p-value |
|---|---|---|---|---|
| Gender | 1.26 | 0.12 | 12.61 | 0.839 |
| Baseline GOT | 0.98 | 0.86 | 1.11 | 0.833 |
| Baseline GPT | 1.49 | 1.21 | 1.82 | 0.000 |
| Baseline GGT | 1.03 | 0.96 | 1.09 | 0.334 |
| Baseline haemoglobin | 0.93 | 0.40 | 2.19 | 0.881 |
| Baseline DNA | 0.93 | 0.40 | 2.19 | 0.881 |
| Pseudo R2 | 0.519 | |||
| Hosmer–Lemeshow p-value | 0.135 | |||
| c-statistic | 0.927 |
CI: confidence interval; DNA: deoxyribonucleic acid; GGT: gamma-glutamyl transferase; GOT: glutamate-oxaloacetate transaminase; GPT: glutamic-pyruvic transaminase; OR: odds ratio.
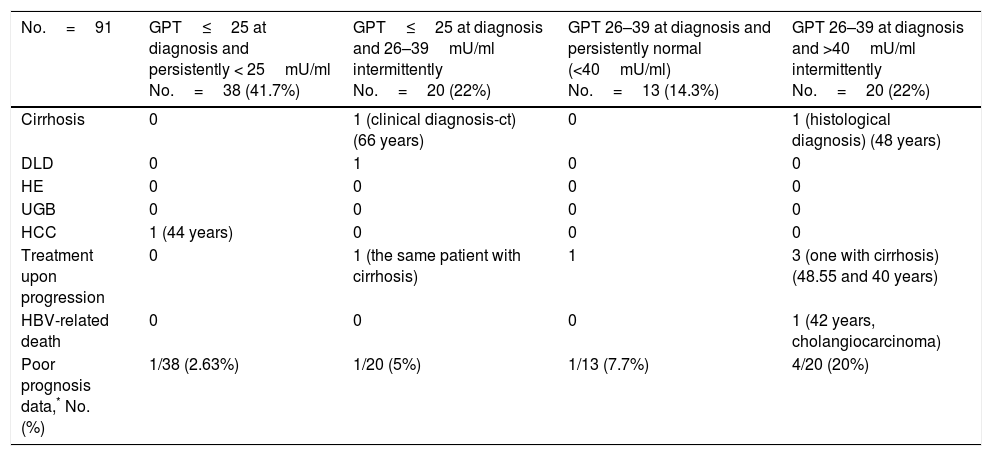
The formation of groups over the course of the disease based on baseline GPT and during follow-up considering a new cut-off value of 25mU/ml and the peak DNA reached over the course of the disease in each group are shown in Fig. 2. Based on these groups formed, Table 3 shows the complications, need for treatment, death and percentage of patients with poor prognosis in each group at diagnosis and over the course of the disease.

Unfavourable hepatic events in patients with normal GPT at diagnosis (<40mU/ml) according to the groups formed with cut-off value of 25mU/ml.
| No.=91 | GPT≤25 at diagnosis and persistently < 25mU/ml No.=38 (41.7%) | GPT≤25 at diagnosis and 26–39mU/ml intermittently No.=20 (22%) | GPT 26–39 at diagnosis and persistently normal (<40mU/ml) No.=13 (14.3%) | GPT 26–39 at diagnosis and >40mU/ml intermittently No.=20 (22%) |
|---|---|---|---|---|
| Cirrhosis | 0 | 1 (clinical diagnosis-ct) (66 years) | 0 | 1 (histological diagnosis) (48 years) |
| DLD | 0 | 1 | 0 | 0 |
| HE | 0 | 0 | 0 | 0 |
| UGB | 0 | 0 | 0 | 0 |
| HCC | 1 (44 years) | 0 | 0 | 0 |
| Treatment upon progression | 0 | 1 (the same patient with cirrhosis) | 1 | 3 (one with cirrhosis) (48.55 and 40 years) |
| HBV-related death | 0 | 0 | 0 | 1 (42 years, cholangiocarcinoma) |
| Poor prognosis data,* No. (%) | 1/38 (2.63%) | 1/20 (5%) | 1/13 (7.7%) | 4/20 (20%) |
ct: complementary tests; DLD: decompensated liver disease with oedema and ascites; HCC: hepatocellular carcinoma; HE: hepatic encephalopathy; GPT: glutamic-pyruvic transaminase; UGB: upper gastrointestinal bleeding due to varices.
On performing the same analysis for a known cut-off value taking into account gender (30mU/ml GPT for men and 19mU/ml GPT for women), we obtained a percentage of correctly classified patients of 66.6% (S: 72.7%; SP: 64.7%; PPV: 39%; NPV: 88.4%). In turn, Fig. 3 shows the percentage of patients distributed in each of the groups formed with this cut-off value at diagnosis and over the course of the disease, and the percentage of peak HBV-DNA (pDNA) reached over the course of the disease. The same analysis was performed with the groups formed with this cut-off value according to gender in relation to complications, need for treatment, death and the percentage of poor prognosis factors over the course of the disease, which was similar to that obtained with the cut-off value of 25mU/ml.

Flow chart of patients with normal GPT at diagnosis according to evolution of GPT with cut-off value of 30mU/ml in men and 19mU/ml in women. Percentage of peak HBV-DNA reached in each group. GPT: glutamic-pyruvic transaminase; pDNA: peak HBV deoxyribonucleic acid; PNGPT: persistently normal GPT.
A comparative analysis was performed for these two cut-off values within a normal GPT range (considering and not considering gender). No significant differences in baseline characteristics at diagnosis (p<0.05) or in the formation of groups according to GPT (p<0.05) or in the percentage of patients requiring treatment or with poor prognosis data over the course of the disease (p<0.05) were observed.
In relation to HBV-DNA, we performed a ROC curve analysis to find out which cut-off value at diagnosis best predicts elevation above 2000IU/ml over the course of the disease, observing that the cut-off value of 900IU/ml HBV-DNA at diagnosis gave the best values, with a percentage of correctly classified patients of 89.8% (S: 90.7%; SP: 88.7%; PPV; 78.9%; NPV: 100%), and an area under the curve of 96.03% (CI: 91.7–98.9). In turn, we performed an analysis of the change in HBV-DNA in patients with PNGPT according to baseline HBV-DNA, observing that of all the patients with HBV-DNA <2000IU/ml at diagnosis, only 23% reached pDNA between 2000 and 20,000IU/ml and none exceeded 20,000IU/ml; and of those with HBV-DNA of 2000–20,000IU/ml at diagnosis, only 9% had pDNA above 20,000IU/ml (p=0.000).
Finally, we performed a ROC curve analysis to find out which GPT and HBV-DNA cut-off value at diagnosis best predicted the need for treatment over the course of the disease, observing that the combined cut-off value of 6000IU/ml HBV-DNA and 38mU/ml GPT shows the best values (S: 75%; SP: 93.44%; PPV: 60%; NPV: 96.61%).
DiscussionGPT is the most specific liver enzyme for determining liver impairment. Because the enzyme concentration in a population forms a continuous distribution, the cut-off value that discriminates between healthy and diseased livers is not clearly defined. Therefore, it is not clear if the current GPT limits of normal are the most appropriate for determining whether there is liver damage in most individuals or not, with associated implications. Some investigators have suggested the need for a lower cut-off value as the normal standard. This is based on records of GPT values in blood donors,25 on the link between normal GPT and high death rates related to liver diseases,29 and on the increased risk of complications or high levels of HBV viral load in relation to their liver disease in patients with chronic hepatitis B (CHB).42,43
Over the last 35 years, the upper limit of normal (ULN) for GPT has varied between 30 and 50mU/ml, with the most common limit being around 38–40mU/ml.44,45 However, the reference populations may have included individuals with mild-moderate liver impairment that was undetected due to non-diagnosis of the disease, as is possible in IC state patients. Currently, the ULN for GPT has been re-assessed in several countries with the participation of various age groups. These studies suggest that the upper limit of normal for GPT should be revised, recommending 30mU/ml for men and 19mU/ml for women,25,26,30–32,46 showing that a significant percentage of patients with histological damage could be lost, which varies between 1532 and 8.4%.28 In a recent study conducted in 53,037 Chinese adults, 35mU/ml in men and 23mU/ml in women27 was established as the new cut-off value for normal GPT for this population, which is also lower than the currently established cut-off value.
In our study, we have obtained 25mU/ml as the best cut-off value for normal GPT at diagnosis, without considering gender, to predict the probability of GPT values changing from normal to elevated over the course of the disease. Our results show that patients with IEGPT are more commonly men, have higher levels of GOT, GGT, viral load at diagnosis and peak and trough GPT, and a higher percentage of pDNA >20,000IU/ml in a statistically significant manner, with associated implications. As can be observed in Fig. 2, patients with intermittently elevated GPT over the course of the disease are in the normal high GPT group (26–39mU/ml) at diagnosis in most cases, while only 2 patients are in the normal low GPT group (0–25mU/ml). However, these 2 cases had pDNA <2000IU/ml, indicating that their GPT was probably elevated due to reasons other than HBV infection (usually overweight/class I obesity). In the liver fibrosis study, we found no statistical differences, although 2 patients with cirrhosis were in the normal high GPT group (26–39mU/ml) at diagnosis or over the course of the disease, and there is a higher percentage of normal results or mild fibrosis in the PNGPT group. Some authors have reported that patients in the upper range of normal GPT have statistically significant greater histological impairment,28,32 and such histological impairment is directly related to age >40 years and GPT >0.5xULN, which matches our results.
With regard to poor prognosis factors during follow-up, we have seen that patients who are in the normal high GPT group and whose GPT is elevated over the course of the disease report a higher number of poor prognosis factors, mainly in relation to need for treatment (Table 3). However, in two-thirds of cases, patients with GPT≤25mU/ml at diagnosis maintain GPT within the same range over the course of the disease, with DNA<20,000IU/ml in nearly 100% of cases, and only one 44-year-old patient had a poor prognosis factor (HCC).
Other studies of patients with chronic HBV infection with PNGPT find that HBeAg(−) patients with normal low or high GPT levels in relation to a traditional cut-off value had similar histological impairment and course of disease,33–38 and, therefore, some groups have concluded that establishing a cut-off value within the normal GPT range is not useful for managing these types of patients.47 However, most of these studies compare groups of patients that remain within the normal high or normal low GPT range over time, while we have suggested that these cut-off values are useful mainly at the time of diagnosis.
On analysing our patients with the cut-off value of 30mU/ml for men and 19mU/ml for women, we found no statistically significant differences in baseline characteristics, the formation of groups or in the percentage of poor prognosis factors; however, we observed a smaller percentage of correctly classified patients for predicting GPT elevations over the course of the disease and therefore the cut-off value of 25mU/ml GPT seems more useful in clinical practice.
The need for treatment in patients with HBV-DNA greater than 2000IU/ml is well known due to potential histological damage.48 Over recent years, the need for tools to help us predict the outcome of these patients has been recognised and the value of HBsAg quantitation is becoming increasingly important for differentiating between inactive carriers and patients with CHB HBeAg(−).49 We have not been able to perform this type of analysis since this test is not available, but we have observed that patients with HBV-DNA <900IU/ml at diagnosis have an NPV of 100% if HBV-DNA does not rise above 2000IU/ml in the first 3 years after diagnosis, which places these patients in IC state with a better clinical outcome and the possibility of less stringent follow-up. Moreover, patients with PNGPT and HBV-DNA <2000IU/ml at diagnosis maintain HBV-DNA at <2000IU/ml in three-quarters of cases during the study period. Treatment was indicated in our series due to the presence of cirrhosis (20%) and CHB HBeAg(−) state (80%). Of those patients with CHB HBeAg(−) state, 87.5% had elevated GPT at diagnosis and, therefore, most patients requiring treatment had elevated GPT from diagnosis. In a Spanish study13 including patients recently diagnosed with chronic HBV infection (91% HBeAg(−)), 17% were treated, which is similar to our own study. In our group, treatment was required in most cases according to EASL recommendations. Therefore, in accordance with these indications, we have found that the combined cut-off value at diagnosis of ≤6000IU/ml HBV-DNA and ≤38mU/ml GPT has a high NPV for not requiring treatment during the first few years after diagnosis, which could be relevant for the type of follow-up required for patients below these cut-off values at diagnosis.
Based on these data, we suggest that patients with GPT≤25IU/ml and HBV-DNA<900IU/ml could have less regular follow-up at diagnosis, every one or 2 years; patients with GPT≤25IU/ml and HBV-DNA>900IU/ml or GPT 26–39IU/ml with HBV-DNA<900IU/ml, 6–12 months; and patients with GPT 26–39IU/ml and HBV-DNA>900IU/ml require more regular follow-up, every 3–6 months, provided that the result of the fibrosis study performed for each patient is taken into account.
Notwithstanding the above, we recognise that our study has limitations: retrospective study performed at a single centre, only half of the liver fibrosis study patients were available, and only medium-term follow-up. Our results support the need for prospective, multi-centre studies with longer follow-up periods in order to confirm whether our data remain valid in this type of study.
With the results presented in this article, we can confirm once more how patients with chronic HBV HBeAg(−) infection and normal GPT at diagnosis are not a homogeneous group, requiring follow-up during the first few years after diagnosis. Nevertheless, we have suggested some GPT and HBV-DNA cut-off values at diagnosis to differentiate between patients at high and low risk of developing poor prognosis factors and/or need for treatment and to be able to perform more individualised follow-up of each case.
Conflicts of interestThe authors declare that they have no conflicts of interest.
We would like to thank Dr Marcelino Sánchez Casado, ICU staff physician at Hospital Virgen de la Salud de Toledo, for his assistance in both the methodology and statistics.
We would also like to thank Dr Belén Piqueras and Dr Fernando Bermejo, staff physician and head of the Digestive Diseases Department at Hospital Universitario de Fuenlabrada, respectively, for their assistance in the final review of this article.
Please cite this article as: Guardiola-Arévalo A, Gómez Rodríguez R, Romero Gutiérrez M, Gómez Moreno AZ, García Vela A, Sánchez Simón R, et al. Infección crónica por virus de la hepatitis B antígeno e negativo. Manejo en función de puntos de corte de glutámico-pirúvica transaminasa y ácido desoxirribonucleico del virus de la hepatitis B. Gastroenterol Hepatol. 2018;41:153–162.
