
To assess the efficacy of a new quality control strategy based on daily randomised sampling and monitoring of a sentinel surveillance system (SSS) medication cart, in order to identify medication errors and their origin at different levels of the process.
MethodProspective quality control study with one-year follow-up. An SSS medication cart was randomly selected once a week and double-checked before dispensing medication. Medication errors were recorded before the cart was taken to the relevant hospital ward. Information concerning complaints after receiving medication and 24-h monitoring was also noted. Type and origin of error data were assessed by a unit dose quality control group, which proposed relevant improvement measures.
ResultsThirty-four SSS carts were assessed, including 5130 medication lines and 9952 dispensed doses, corresponding to 753 patients. Ninety erroneous lines (1.8%) and 142 mistaken doses (1.4%) were identified at the pharmacy department. The most frequent error was dose duplication (38%) and its main cause was inappropriate management and forgetfulness (69%). Fifty medication complaints (6.6% of patients) were mainly due to new treatment at admission (52%), and 41 (0.8% of all medication lines), did not completely match the prescription (0.6% lines) as recorded by the pharmacy department. Thirty-seven (4.9% of patients) medication complaints due to changes at admission and 32 matching errors (0.6% medication lines) were recorded. The main cause also was inappropriate management and forgetfulness (24%). The simultaneous recording of incidences due to complaints and new medication coincided in 33.3%. In addition, 433 (4.3%) of dispensed doses were returned to the pharmacy department. After the unit dose quality control group conducted their feedback analysis, 64 improvement measures for pharmacy department nurses, 37 for pharmacists, and 24 for the hospital ward were introduced.
ConclusionsThe SSS programme has proven to be useful as a quality control strategy to identify unit dose distribution system errors at initial, intermediate and final stages of the process, improving the involvement of the pharmacy department and ward nurses.
Analizar la eficacia de una nueva estrategia de control de calidad basada en el muestreo aleatorio y seguimiento de carros de dispensación de dosis unitaria (carro centinela) para identificar los errores en las distintas fases del proceso de dispensación y sus causas.
MétodoEstudio prospectivo para valoración de eficacia de un control de calidad en la identificación de errores de dispensación durante un periodo de 12 meses. Una vez por semana fue aleatoriamente seleccionado un carro de medicación denominado «carro centinela» y doblemente revisado antes de la dispensación. Se registraron los errores de medicación en la revisión, antes de ser conducido a la unidad de hospitalización así como las reclamaciones tras su recepción y monitorización durante las 24h siguientes. Un grupo de calidad de dosis unitarias instaurado al efecto analizó el tipo y origen de los errores y propuso las correspondientes acciones de mejora.
ResultadosSe analizaron 34 carros centinela que incluyeron 5.130 líneas de medicación, y 9.952 dosis dispensadas correspondientes a 753 pacientes. Se identificaron 90 (1,8%) líneas con error de tratamiento y 142 (1,4%) dosis erróneas en la preparación en el servicio de farmacia. El error más frecuente fue la duplicidad de dosis (38%) y el fallo de memoria o atención la causa que más lo generó (69%). Cincuenta medicaciones (6,6% de pacientes) reclamadas debido principalmente al inicio de nuevos tratamientos por ingreso (52%) y 41 (0,8% del total de líneas) discrepancias respecto a la prescripción fueron registradas en el Servicio de Farmacia. En la unidad de hospitalización se registraron 37 (4,9% de pacientes) medicaciones reclamadas en su mayoría por nuevo ingreso (43,2%) y 32 (0,6% de líneas) por discrepancias con la prescripción original, cuya causa más frecuente fue fallo de memoria o falta de atención (24%). El grado de coincidencia en el registro simultáneo de incidencias por reclamaciones y demanda de nueva medicación fue del 33,3%. Además se devolvieron 433 (4,3%) dosis no administradas. Tras el análisis de calidad se generaron 64, 37 y 24 acciones de mejora dirigidas al equipo de enfermería de farmacia, farmacéuticos y Unidad de Hospitalización, respectivamente.
ConclusionesEl programa del carro centinela ha demostrado su eficacia en la identificación de errores de dispensación de dosis unitarias mediante un control de calidad instaurado al principio, durante y al final del proceso, facilitando una mayor implicación de los profesionales relacionados con el mismo.
A quality policy with clear strategies is needed in the hospital environment, to be able to guarantee patient security, monitoring each of the links in the pharmacotherapeutic chain: prescription, validation, preparation, dispensing, administration and follow-up.
The incidence of medication errors and their causes have been analysed in previous studies by various authors,1–4 as well as our own research group.5 In 2004, Jornet el al.6 analysed the whole process during a specific time period. They asked healthcare professionals to voluntarily report errors to the hospitalisation units (HU). However, most of the studies that we have reviewed are observational and analyse only some aspects of the process, mainly prescription and administration. Vincent et al.7 conducted a meta-analysis, which included 6 papers on prescription errors and 10 on administration errors. They observed that while the incidence of prescription errors has continued to be stable over time, the number of administration errors has increased. However, it is difficult to make a comparison between studies as different scenarios and methods have been used.8,9 Furthermore, the hospital pharmacy medication preparation process is one of the three medication error risk factors, alongside health professionals’ lack of pharmacological knowledge and errors made by nurses in patient documentation.10
It is not surprising that complaints are made for discrepancies between the medication prescribed and dispensed, and that medication is requested out of dispensing hours, because the work circuit and pharmacy department's (PD) performance is of low quality. It is normal for this type of incidence to be quantitatively registered by our PD11,12 staff, and to a lesser extent, by HU staff. However, qualitative analysis, i.e. evaluation of the cause of such incidences is not common. With this aim, in 2007, our Unit Dose Functional Unit established a procedure to improve the circuit, involving the professionals who participated in the process, encouraging them to be responsible for carrying out their daily activities. This programme focuses on the preparation and dispensing process at the HU, but overall information about the work circuit allows us to also detect prescription, validation and administration errors. The objective of this study is to assess the efficacy of a new quality control strategy based on random sampling and monitoring sentinel surveillance system (SSS) medication carts to identify the errors in different phases of the dispensing process and their causes.
MethodDesignProspective quality control (QC) study to identify dispensing errors during a period of 12 months (June 2007–2008).
ScopePublic hospital with 845 beds, 585 (69.2%) corresponding to 19 HU with unit dose drug dispensing system (UDDDS), and electronic medical prescription and pharmaceutical validation. The SSS involves randomly selecting a medication cart one day a week from the 19 prepared by semi-automated cabinets (Kardex®) and modified manually. We then monitored it for the following 24h. The study checked and recorded the SSS medication cart preparation errors (DE), complaints or discrepancies with prescribed medication (MC) and requests or orders for unscheduled medication (MR), i.e. not being included in the usual medication dispensing circuit from the HU and the returns from the HU in the same time period. Furthermore, the HU nursing staff was asked to participate by simultaneously recording the incidences, with the aim of checking their level of involvement. The records obtained were analysed by a UD quality control group, which was formed by the head pharmacotherapy pharmacist, the UD pharmacist, the area pharmacist, the pharmacy supervisor, and the nurse and the technician who checked the SSS cart. During weekly meetings, this group proposed improvement measures for the work procedures of the professionals involved in the PD and the HU.
VariablesThe DE, MC, MR, returns and their causes. The number of medication lines prepared, the number of total units dispensed, total number of patients, and number of modifications that have developed since issuing the final list.
Statistical AnalysisThe percentage distribution of all variables was estimated.
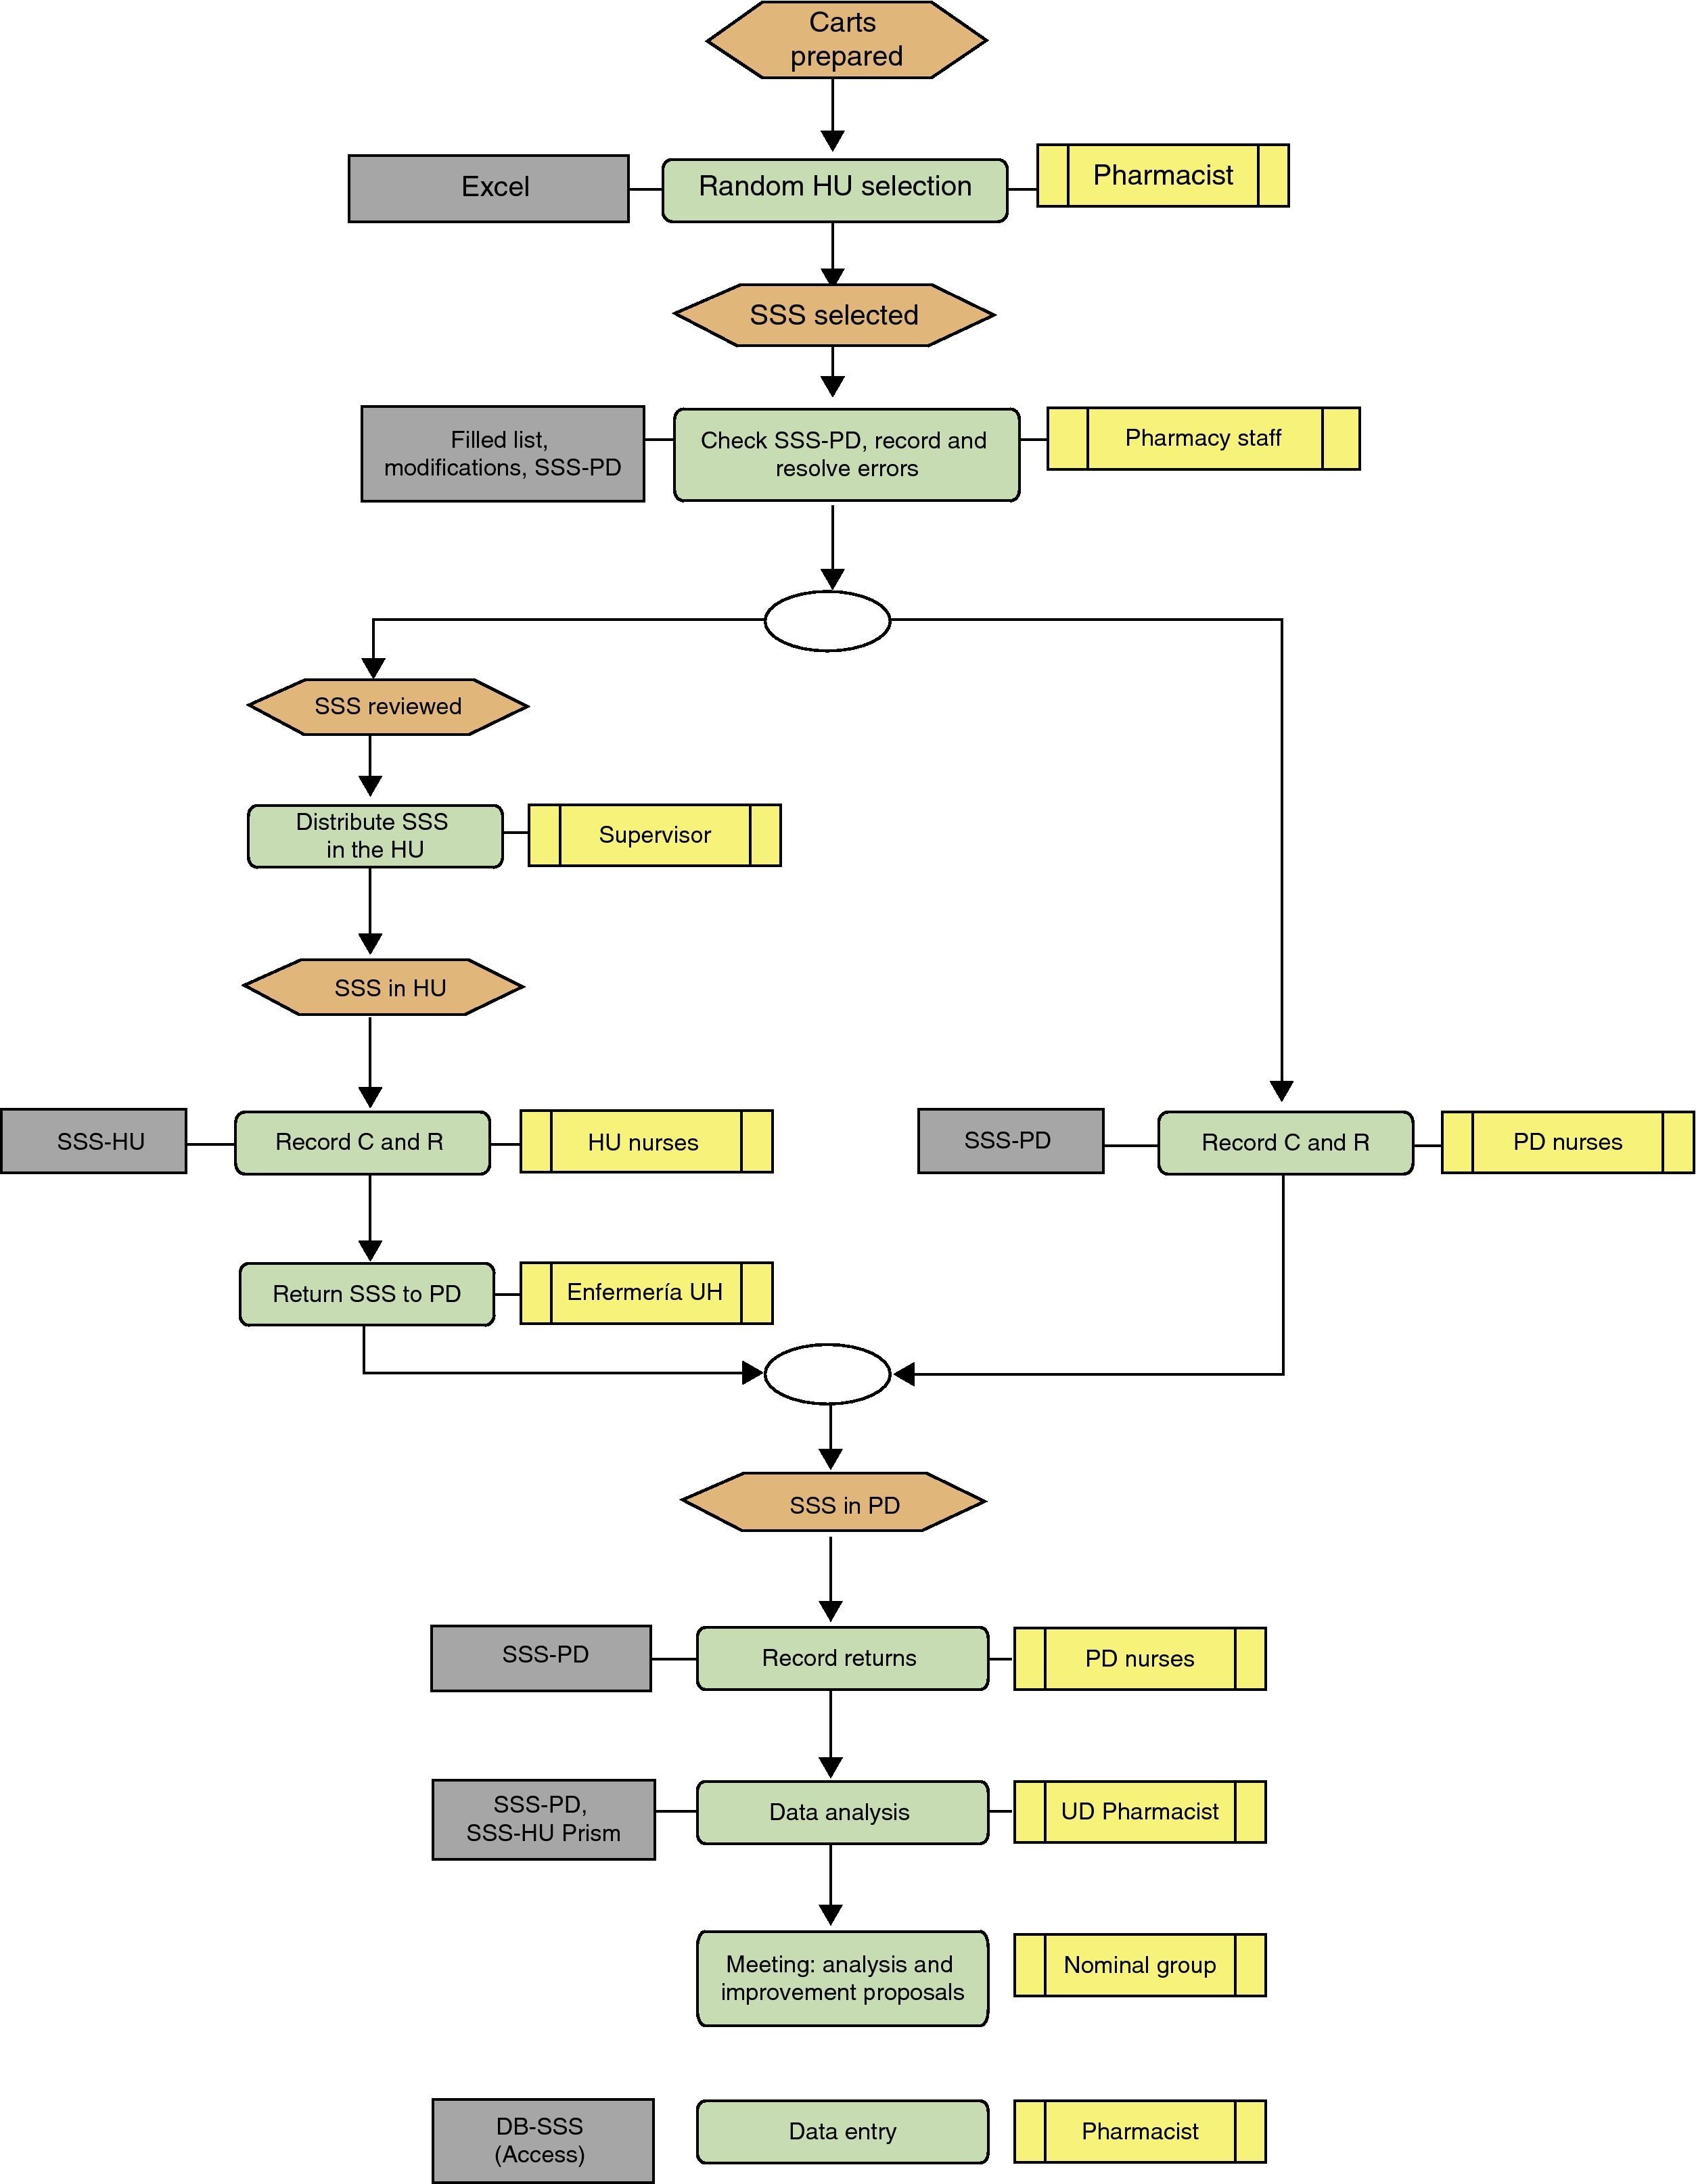
Description of the Sentinel Surveillance System MethodThree-day programme (Fig. 1):
Day 1: SSS medication cart checked in the pharmacy department and incidences recorded in the pharmacy department and hospitalisation unit
- -
Pharmacy department; the UDDDS head nurse and an auxiliary nurse checked the cart once finished using the following documentation (SSS dossier):
- 1.
Provisional list (approximately 08.00) and confirmed list (approximately 14.00) which includes the patient's name, bed number, dose and number of medication units prescribed.
- 2.
Treatment modification sheets until review, signed by those responsible for the changes made.
- 3.
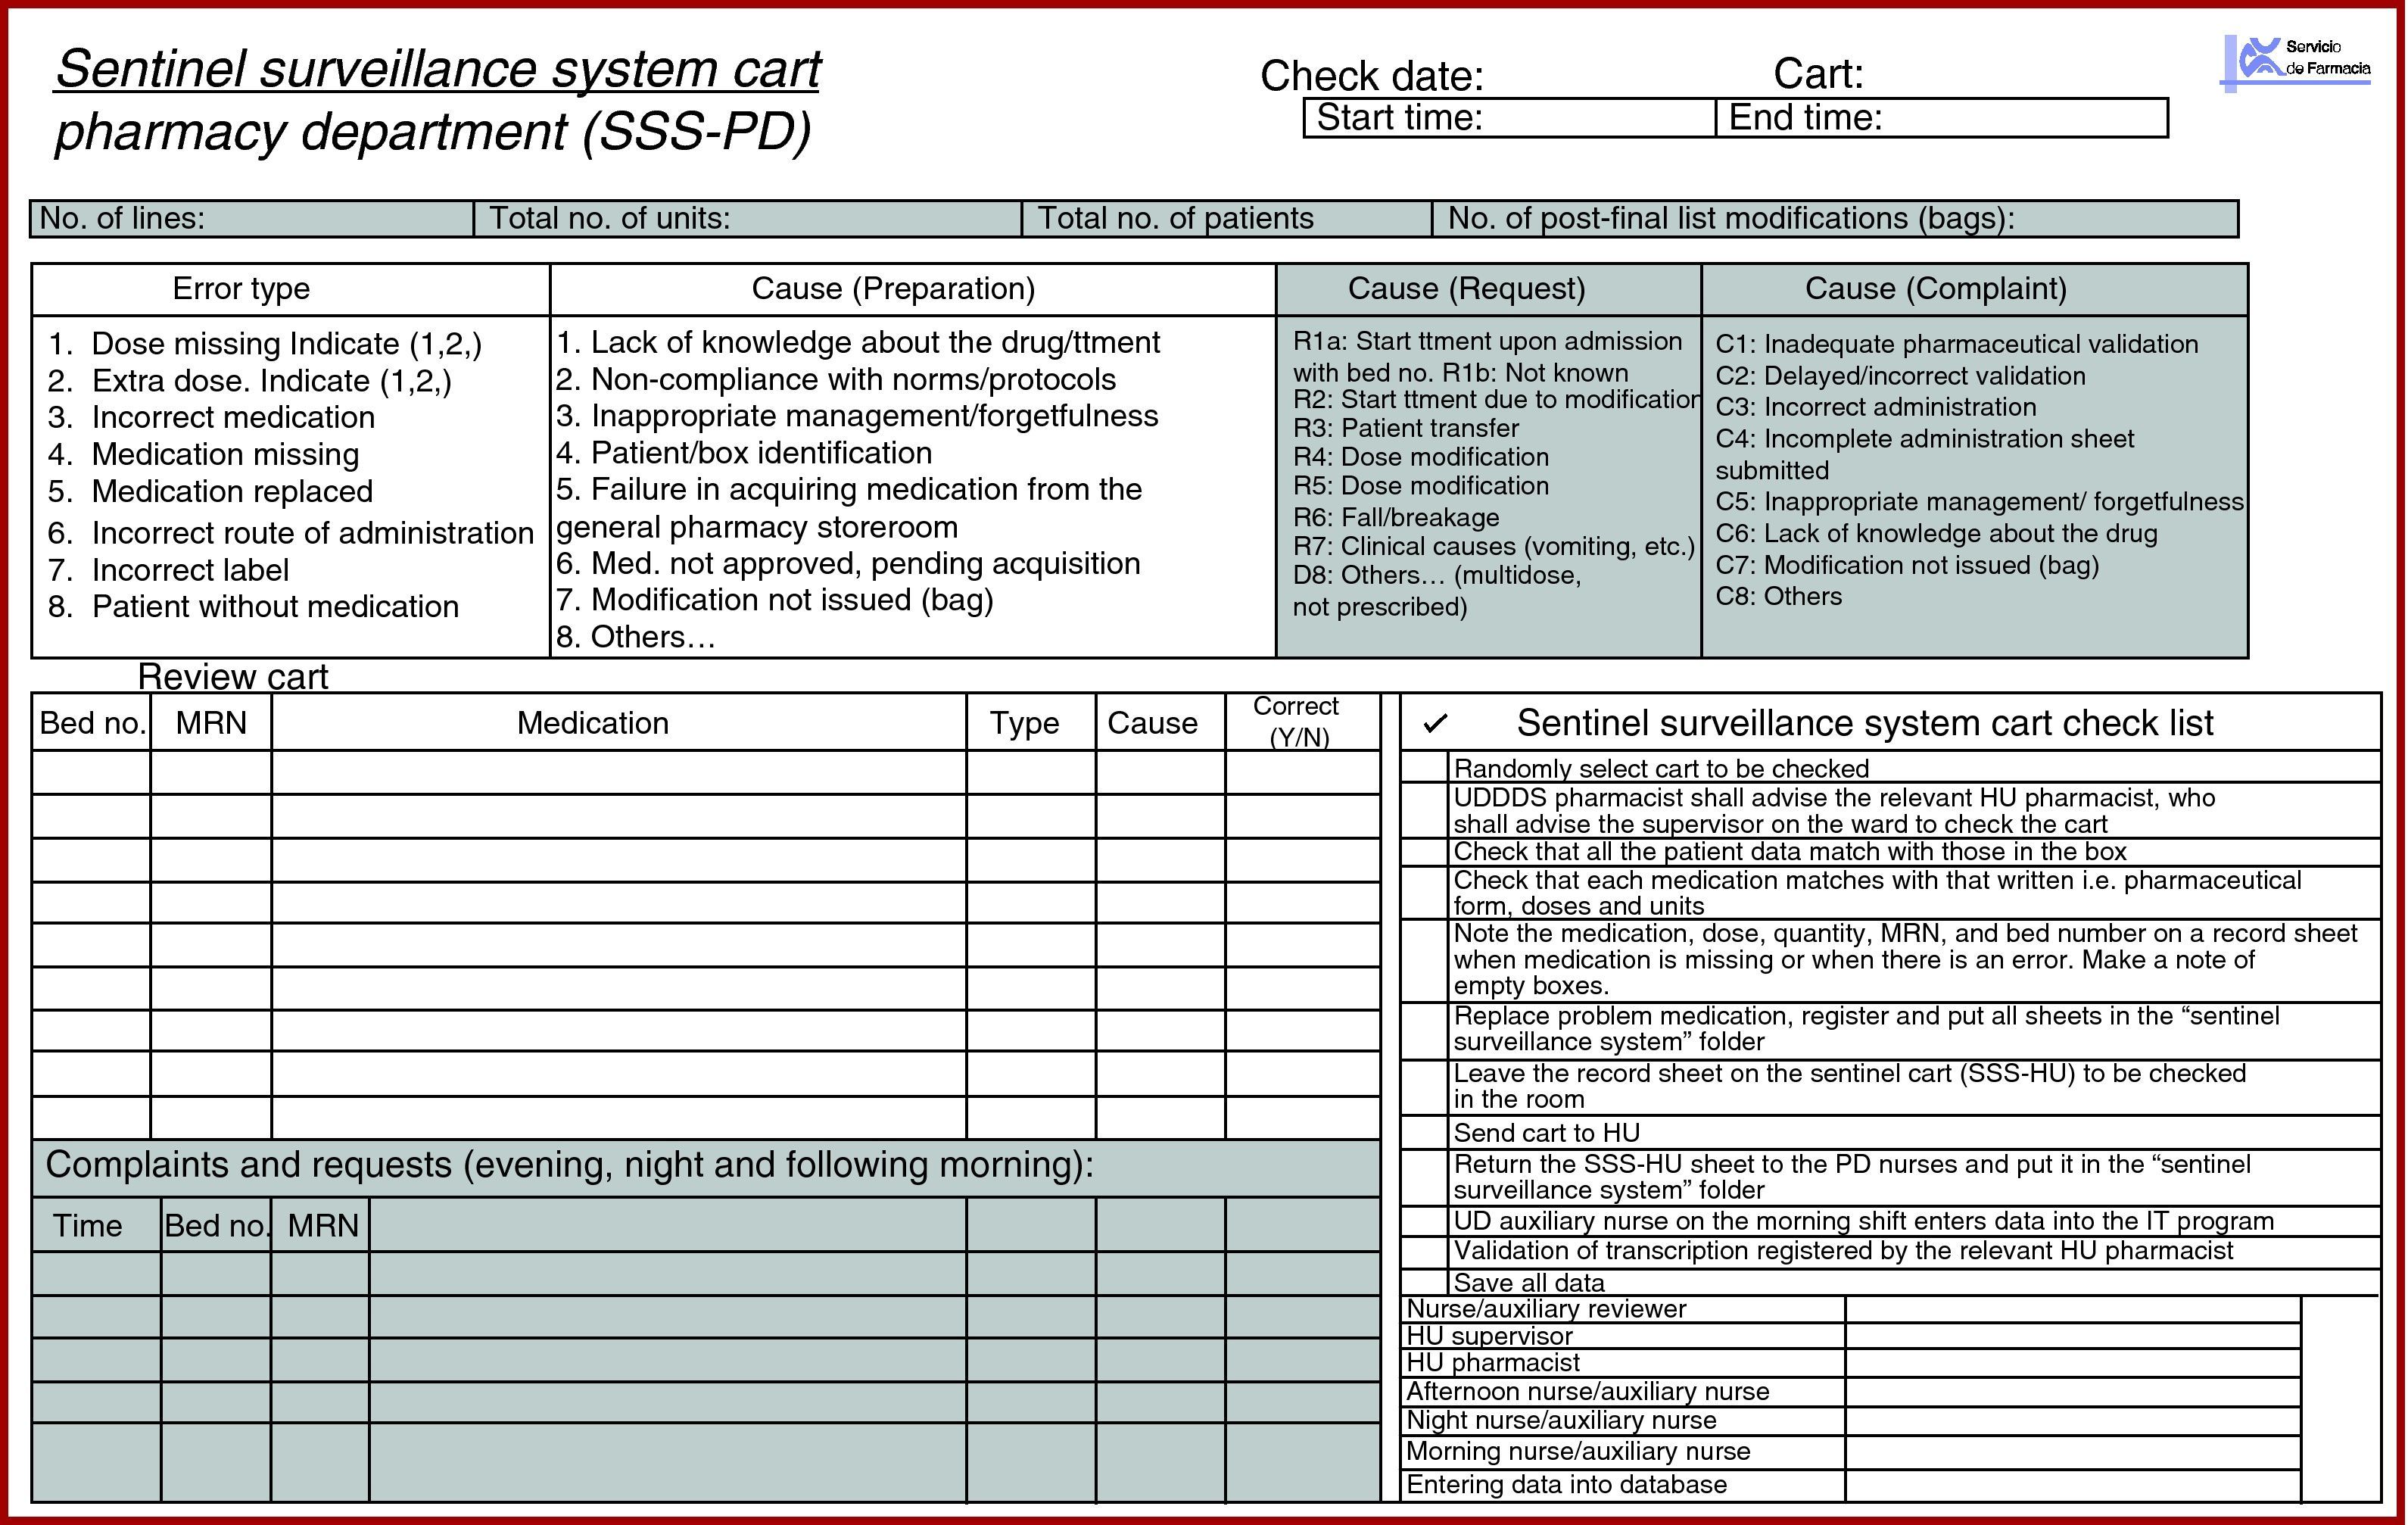
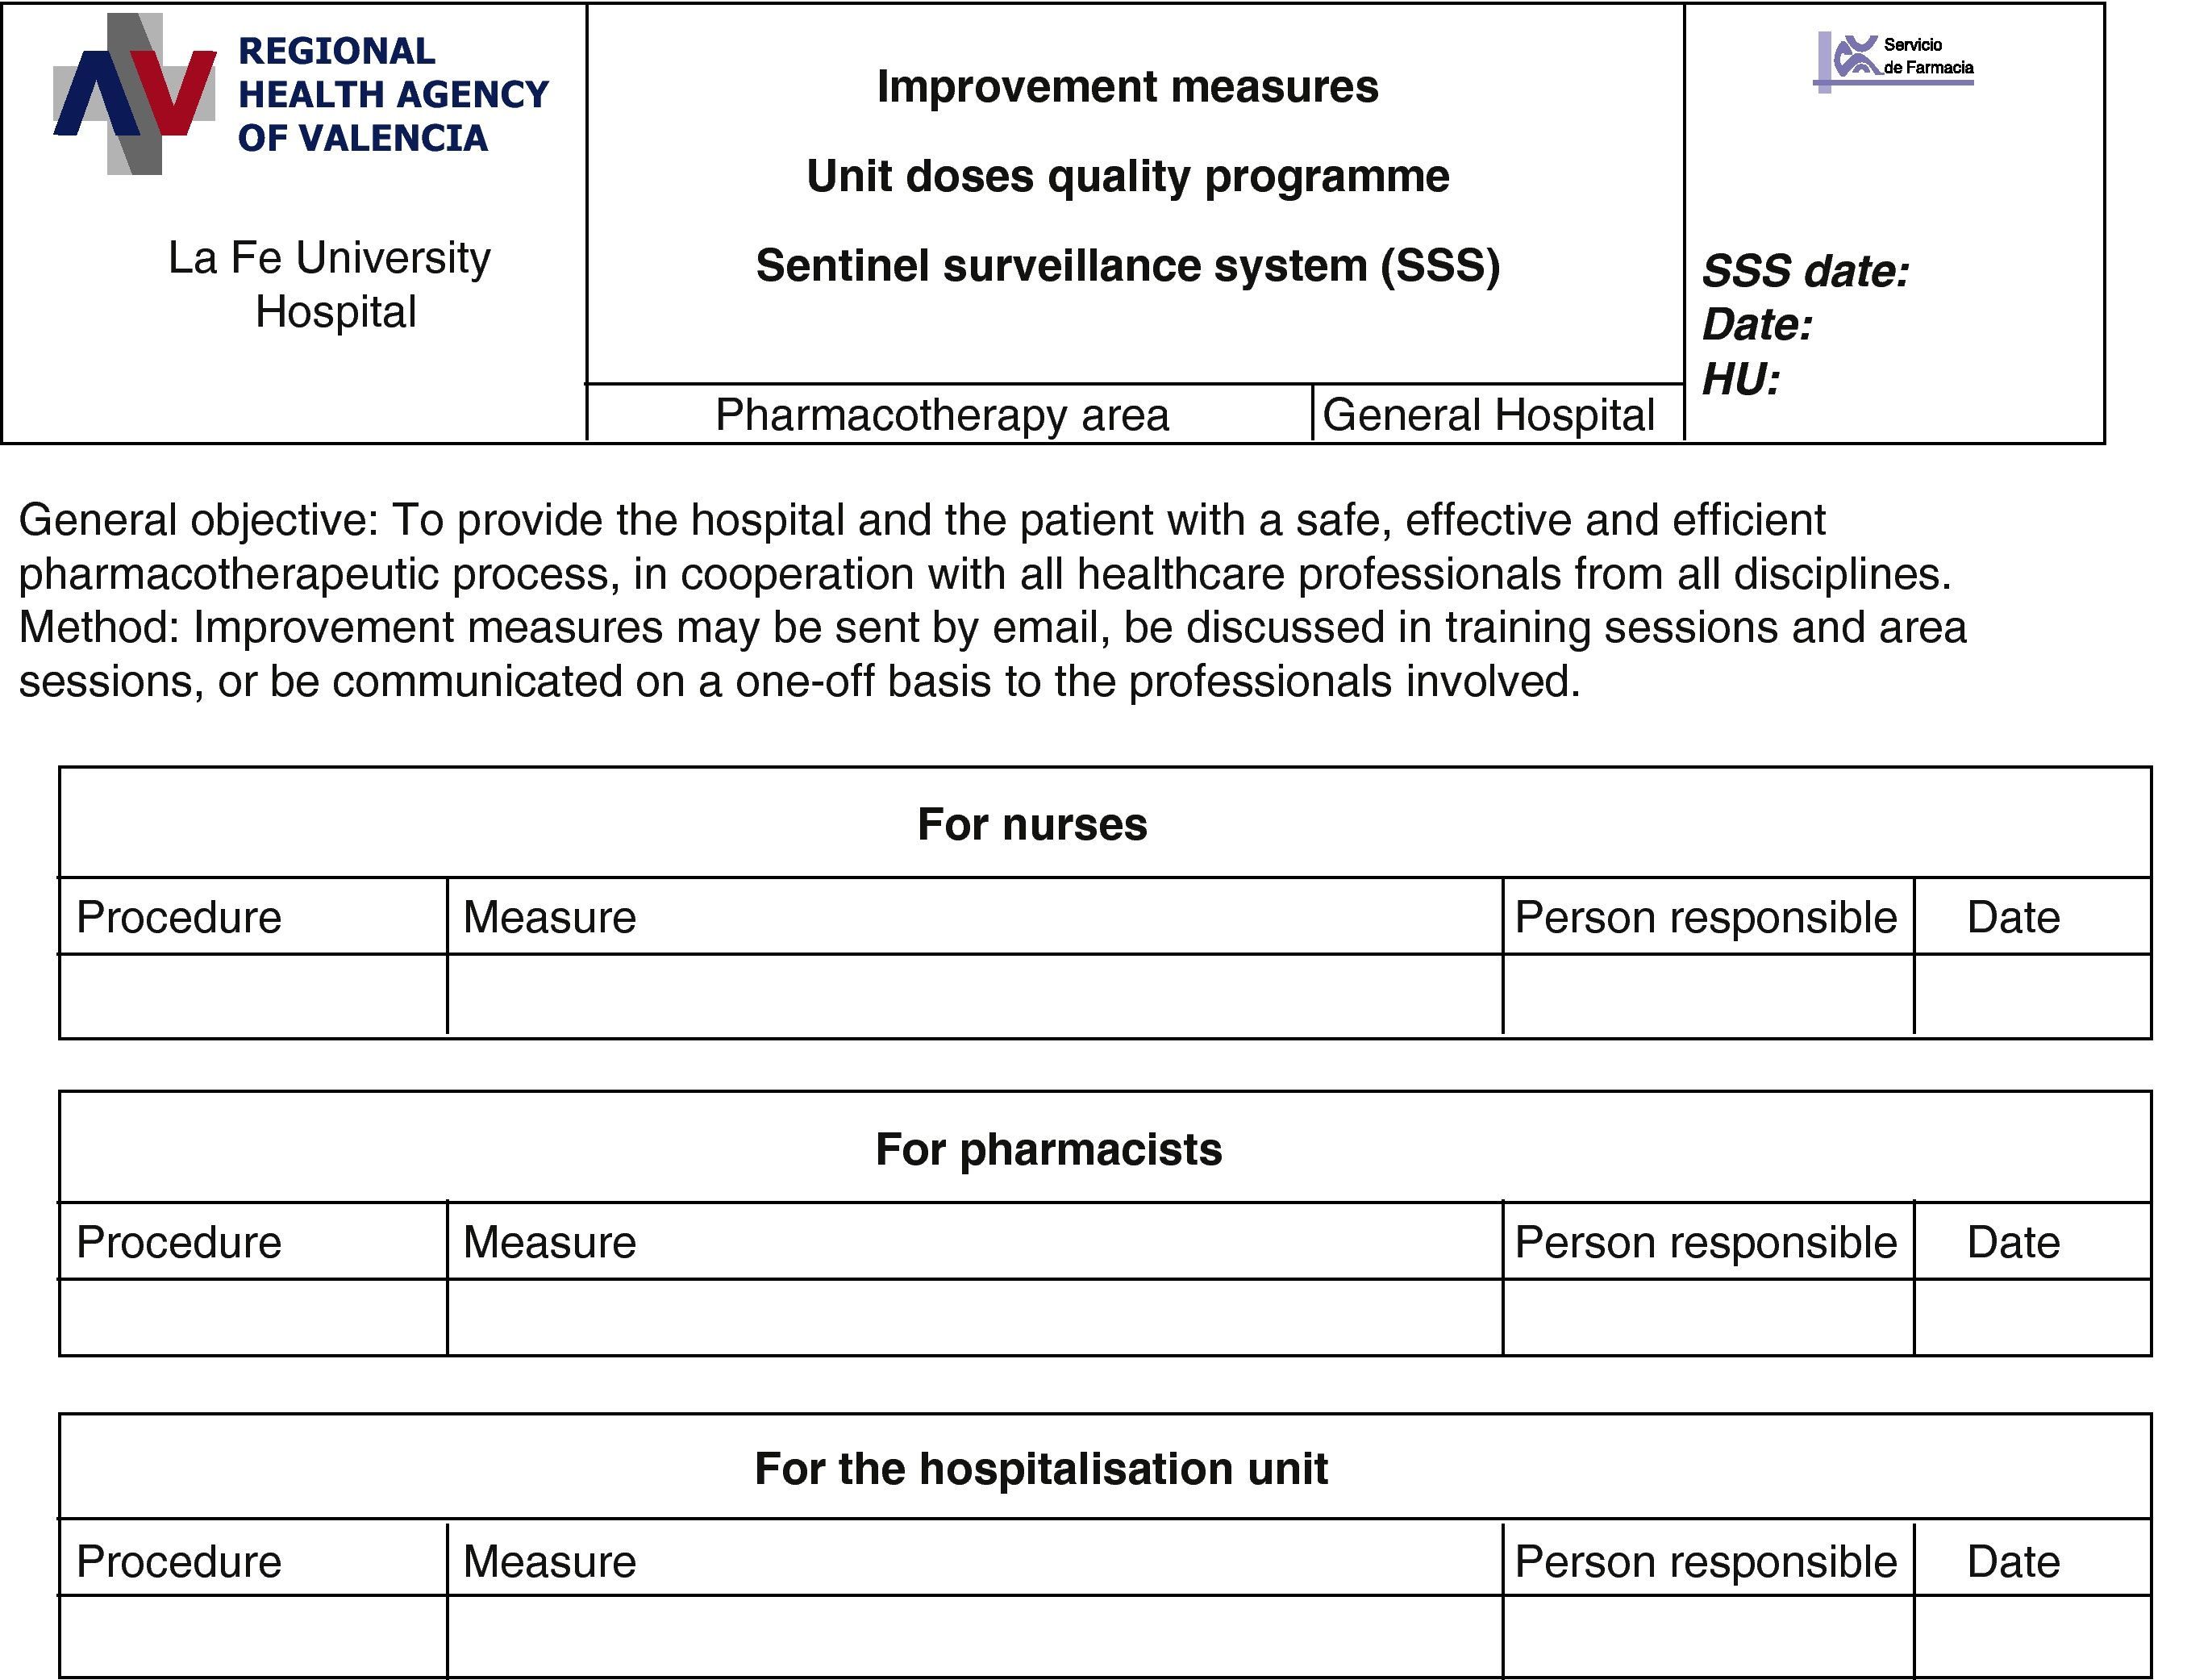
SSS record sheet in the PD (SSS-PD) (Fig. 2).
Medication was checked using a standardised method: one of them reads the bed number, the patient's name and surnames, and the other checks that the correct box is present. The nurse reads the name of each drug (active ingredient or brand name) and the auxiliary nurse names pharmaceutical form, dose and the units for each drug. If they match, the medication line is indicated and the auxiliary nurse puts the drug back in its box. If it does not match, it is highlighted, and the variation required is written down. The drug name, number and type of incorrect dose, cause of the error, and patient details are written on the SSS-PD sheet. The missing medication is replaced, and the double-checked SSS medication cart is sent to the HU.
The nurses on the afternoon and night shifts record the MC and MR on the SSS-PD after checking the prescription and categorise them depending on the type of incidence, origin, cause staff member involved and time. The SSS-PD recording process continues until 12.00h the following morning.
- 1.
- -
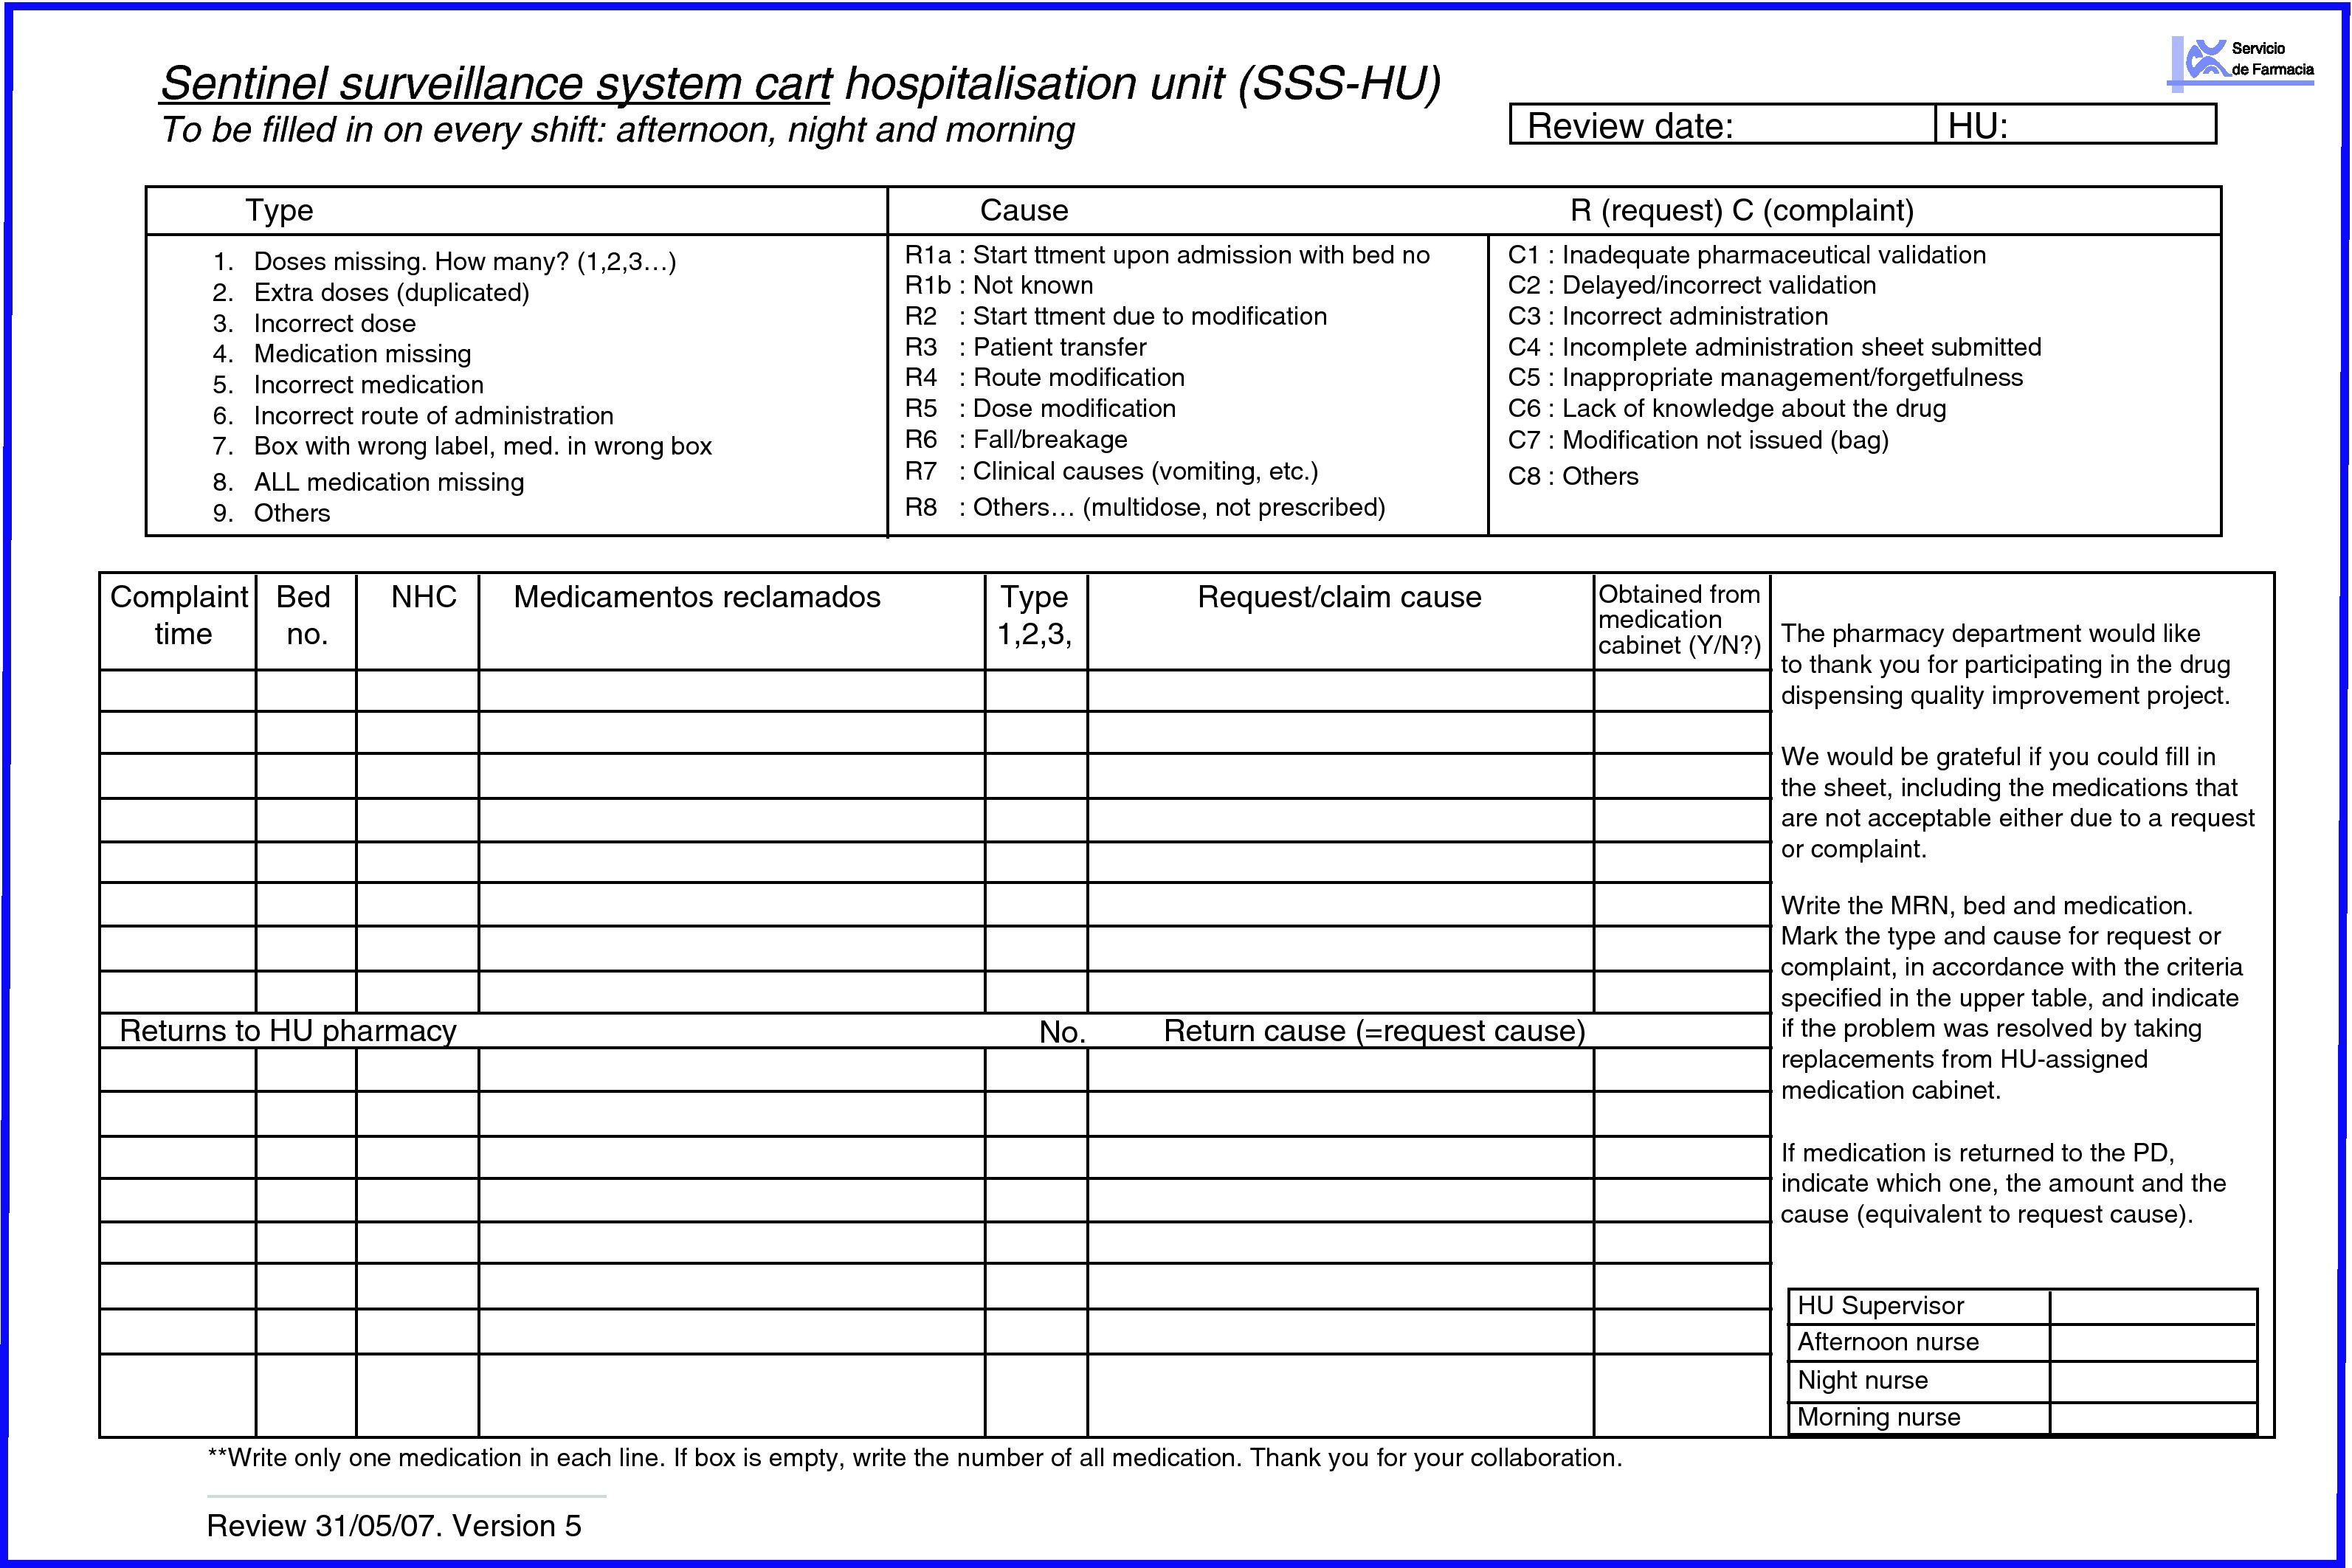
Hospitalisation unit; the area pharmacist asks the HU supervisor to tell the shift nurses to record on the SSS-HU sheet all the medication needed by each patient at a certain time, and any medication incidence, i.e. if there is extra or missing medication in the SSS boxes (SSS-HU) (Fig. 3). They recorded if the patient had been newly admitted or transferred, if treatment had been changed or the patient transferred to another ward, and if the drug had been obtained from the medication cabinet or the PD. The PD supervisor gave this record sheet to the HU and collected it again at the end of Day 2.
- -
Day 2: records in the pharmacy department and the hospitalisation unit, and returns recorded in the pharmacy department
The PD staff continued recording MC and MR until 13.00h.
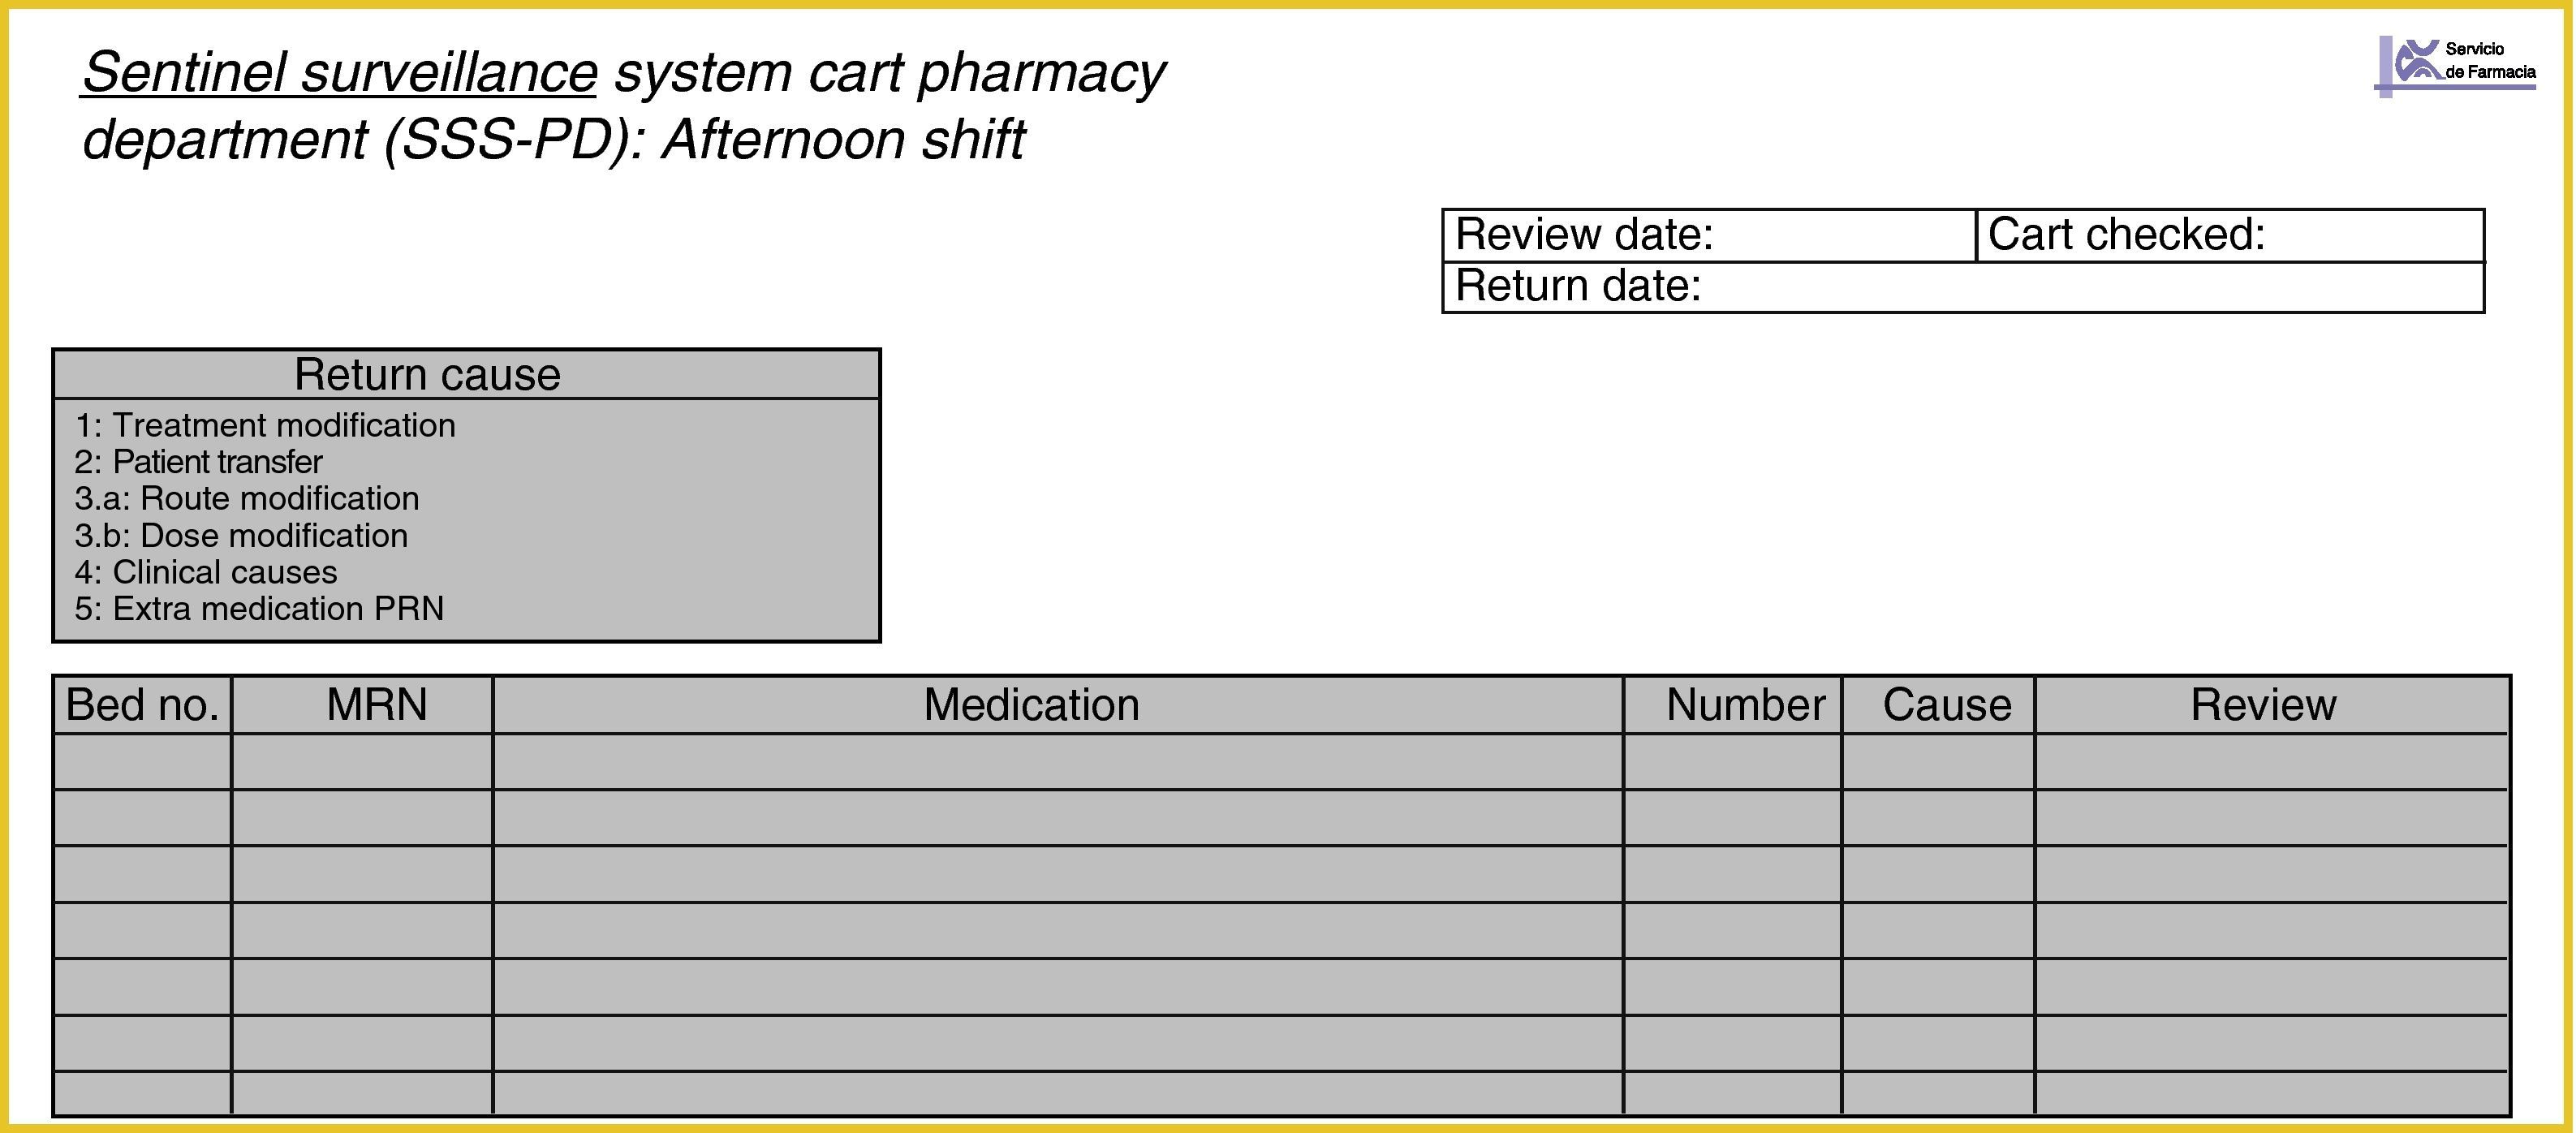
All of the medications returned after 24h were described on the returns sheet (Fig. 4), making note of the bed number. The returns could also be recorded on the SSS-HU with the aim of comparing the number of matches.
Day 3: analysis and measures taken by the unit dose quality control group
Review of the matches and discrepancies between SSS-PD and SSS-HU. The UD quality control group, formed by the head pharmacotherapy pharmacist, the UDDDS pharmacist, the area pharmacist, the pharmacy supervisor, the nurse and the technician who checked the SSS, analysed and assessed the information and the consistency between the causes described and the reasons why they have occurred. The reasons for return were categorised, based on the information from the confirmed and printed lists. In accordance with the analysis (Fig. 5), the group decided on ways to improve the process, making the PD nursing staff, pharmacist or HU staff responsible for carrying out the measures in each case. The following day, the improvement measures were to be included by the head of the relevant care level.


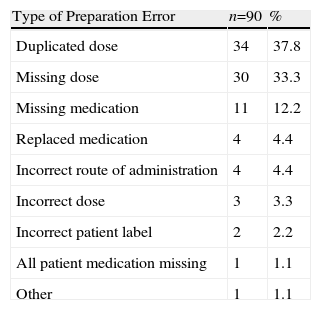
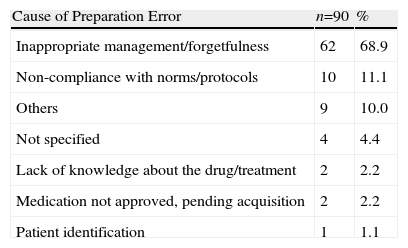
Thirty-four SSS medication carts were assessed, including 5130 medication lines and 9952 dispensed doses, corresponding to 753 patients. Ninety erroneous lines (1.8%) and 142 mistaken doses (1.4%) were identified in the preparation phase. The most frequent error was dose duplication (38%), and its main cause was inappropriate management and forgetfulness (69%), (Tables 1 and 2). Fifty MR (6.6% of patients) were made, mainly being due to new treatment at admission (52%); 41 MC (0.8% of all medication lines) were mainly caused due to forgetfulness and/or lack of concentration (24%). Thirty-seven MR (4.9% of patients) were due to changes upon admission or new treatment (43.2%) and 32 due to matching errors (0.6% of medication lines). Forty (33.3%) incidences were simultaneously recorded (MC and MR) by the PD and HU. The main reason why the incidences found in HU did not match was a lack of communication, medication being taken from the medication cabinet as an immediate solution for 29 (42%) cases. Furthermore, 433 (4.3%) doses dispensed were not administered and were returned to the PD.
Description and Percentage Distribution for Error Type.
| Type of Preparation Error | n=90 | % |
| Duplicated dose | 34 | 37.8 |
| Missing dose | 30 | 33.3 |
| Missing medication | 11 | 12.2 |
| Replaced medication | 4 | 4.4 |
| Incorrect route of administration | 4 | 4.4 |
| Incorrect dose | 3 | 3.3 |
| Incorrect patient label | 2 | 2.2 |
| All patient medication missing | 1 | 1.1 |
| Other | 1 | 1.1 |
Description and Percentage Distribution for Error Causes.
| Cause of Preparation Error | n=90 | % |
| Inappropriate management/forgetfulness | 62 | 68.9 |
| Non-compliance with norms/protocols | 10 | 11.1 |
| Others | 9 | 10.0 |
| Not specified | 4 | 4.4 |
| Lack of knowledge about the drug/treatment | 2 | 2.2 |
| Medication not approved, pending acquisition | 2 | 2.2 |
| Patient identification | 1 | 1.1 |
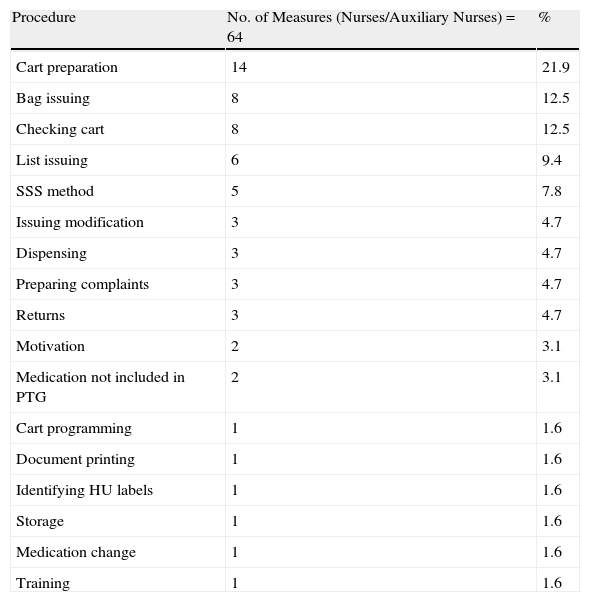
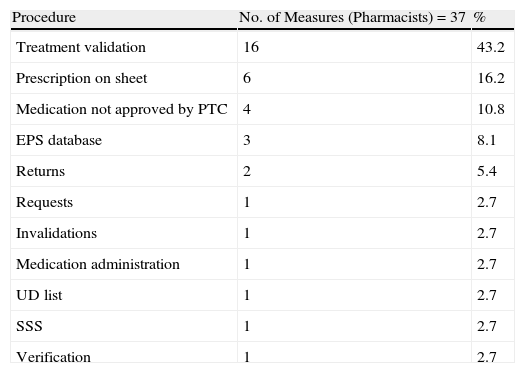
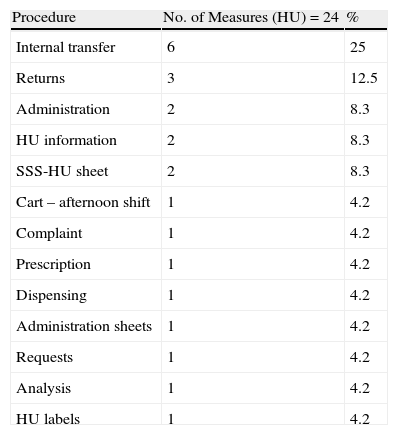
For every cart that was assessed, a meeting was held, i.e. 34 meetings to analyse the incidences and propose ways to improve the process. Each meeting was attended by 23 auxiliary nurses, 11 nurses and 6 area pharmacists. The 3 groups (PD nurses/auxiliary nurses, pharmacists, and HU) involved in the process were proposed improvement measures and 64, 37, and 24 improvement measures were reported and resolved, respectively. The frequency and distribution of the proposed measures are shown in Tables 3–5.
Improvement Measures for Nurses and Auxiliary Nurses.
| Procedure | No. of Measures (Nurses/Auxiliary Nurses)=64 | % |
| Cart preparation | 14 | 21.9 |
| Bag issuing | 8 | 12.5 |
| Checking cart | 8 | 12.5 |
| List issuing | 6 | 9.4 |
| SSS method | 5 | 7.8 |
| Issuing modification | 3 | 4.7 |
| Dispensing | 3 | 4.7 |
| Preparing complaints | 3 | 4.7 |
| Returns | 3 | 4.7 |
| Motivation | 2 | 3.1 |
| Medication not included in PTG | 2 | 3.1 |
| Cart programming | 1 | 1.6 |
| Document printing | 1 | 1.6 |
| Identifying HU labels | 1 | 1.6 |
| Storage | 1 | 1.6 |
| Medication change | 1 | 1.6 |
| Training | 1 | 1.6 |
PTG: pharmacotherapeutic guide.
Improvement Measures for Pharmacists.
| Procedure | No. of Measures (Pharmacists)=37 | % |
| Treatment validation | 16 | 43.2 |
| Prescription on sheet | 6 | 16.2 |
| Medication not approved by PTC | 4 | 10.8 |
| EPS database | 3 | 8.1 |
| Returns | 2 | 5.4 |
| Requests | 1 | 2.7 |
| Invalidations | 1 | 2.7 |
| Medication administration | 1 | 2.7 |
| UD list | 1 | 2.7 |
| SSS | 1 | 2.7 |
| Verification | 1 | 2.7 |
PTC: Pharmacy and Therapeutics Commission; EPS: electronic prescribing system.
Improvement Measures for the Hospitalisation Unit.
| Procedure | No. of Measures (HU)=24 | % |
| Internal transfer | 6 | 25 |
| Returns | 3 | 12.5 |
| Administration | 2 | 8.3 |
| HU information | 2 | 8.3 |
| SSS-HU sheet | 2 | 8.3 |
| Cart – afternoon shift | 1 | 4.2 |
| Complaint | 1 | 4.2 |
| Prescription | 1 | 4.2 |
| Dispensing | 1 | 4.2 |
| Administration sheets | 1 | 4.2 |
| Requests | 1 | 4.2 |
| Analysis | 1 | 4.2 |
| HU labels | 1 | 4.2 |
Of the 64 improvement measures directed at the nurses/auxiliary nurses, 14 (21%) were due to the need to check dosage, the correct active ingredient, and pharmaceutical form in the preparation process; 8 (12.5%) were due to the check before the cart left the PD, medication not being included in the hospital guide, and medication which was included at the last minute given that it had to be refrigerated or given final treatment checks. Of the 34 improvement measures directed at the pharmacists, 16 (43.2%) were for checking procedures, the most common being therapeutic equivalents, complying with medication times, and adapting the doses prescribed to the most ideal presentation. Of the 24 measures proposed to the HU, a quarter was to resolve drug-related problems in the internal patient transfer process or transfer from another HU.
DiscussionThis study has allowed us to reflect weekly on the tasks carried out daily by the healthcare professionals involved and the way the circuit is organised. We have determined the quality of our circuit in distributing medication and analysed the cause of the errors detected. During the UD quality control group meetings that were held every Day 3 (i.e. immediately after data were collected), information from the different sources was contrasted and we found out the causes of the incidences, how they occurred, and how those responsible were involved. Once we had analysed and categorised the reasons for complaints and requests, the improvement measures were established and proposed to the relevant group, with norms to resolve the problem.
The variables analysed in other studies were different, depending on the author and the criteria.1–6 The error rate obtained for the medication lines for prescription, validation and preparation in our study was 1.8%, comparable to that described by Font (1.6%) for prescription and validation.6,13 Other authors analyse the percentage of errors in treatment prescriptions, including medication lines and care and patient control, obtaining a rate of 2.13% for manual prescription in the dispensing phase and 0.96% for electronic prescription.14 A similar value of 1.3% with the electronic prescription was later reported,15 although the results differ depending on the dispensing system used.16 In our study, 142 (1.4%) dosing errors were detected, somewhat higher than the percentage cited by Font in 2006, whose study was a direct observation conducted during day shifts. Our study using the SSS method, however, allowed us 24-h traceability monitoring and did not use direct observers, but volunteers. However, it was finally far from the 0.2% standard indicated by some authors and the Joint Commission (USA).17,18
The human factor has been the cause of most of the errors. Maybe complete automated preparation would be ideal, but it would still have its limitations, given that the electronic prescription system allows, in theory, continual dispensing, and in practice urgent treatment changes still have to be performed manually. Other authors19 studied 1223 patients and identified that the human factor was the most common cause of medication error (46.49%), which is comparable to 69% for inappropriate management or forgetfulness obtained using the SSS method, and 53% of the Font et al. study. In Delgado et al.’s study it was 70% for electronic and 49% for manual.
In our programme, the UD cart was given to the HU once prepared and checked; meaning that in principle the MC rate should be 0. However, during the following 24h, there were MC, obtaining an error rate of 0.8% and an accumulated error rate of 1.8% if we include the incidences detected in the SSS check before the cart is being sent to the HU.
Among the study limitations we noticed that although we have counted the drugs returned, we have not analysed why they were returned, given that on many occasions the information recorded was considered insufficient, most of which was from the PD records when the SSS was returned. HU staff would have been able to provide additional information on administration and cause of the incidences during these meetings. As such HU staff shall be included in this programme in the future, since their participation is of utmost importance for solutions to be proposed.
One of our aims was to indicate our concern to assess the quality of our services in the hospitalisation rooms and promote responsibility among the staff members involved in performing daily tasks. The number of incidences simultaneously recorded (MC and MR) by the PD and HU staff was 33.3%. This could indicate that the HU professionals were sufficiently involved in the SSS programme, especially if we compare this figure with other studies based merely on voluntary participation.6 There are authors that propose training as an alternative and support to improvement initiatives that can be effective.20 According to our experience, training sessions regarding the SSS method have been an incentive for PD staff to identify the causes for complaints and better understand the dispensing system, creating a culture of safety as described by several authors and organisations.21,22
To conclude, the SSS method has shown that it is effective at identifying UD dispending errors by means of quality control established at the start, during, and end of the process, allowing more professionals to be involved.
Furthermore, mid-term assessment is needed to evaluate whether it is successful at reducing the number of errors.
FundingThis paper has received funding from the Dirección General de Calidad y Atención al Paciente (General Directorate of Quality and Patient Care) from the health regional agency of Valencia, award for research projects on healthcare quality and information systems presented in the call for grant applications from the Dirección General de Calidad y Atención al Paciente on 2 June 2009 (DOCV 6067, 29 July 2009).
Conflict of InterestThe authors affirm that they have no conflicts of interest.
We would like to thank all nurses/auxiliary nurses from the hospitalisation units and pharmacy department, pharmacy students undergoing their work experience placements, and pharmacists for the invaluable participation in the sentinel cart programme.
Please cite this article as: Pérez-Cebrián M, et al. Monitorización de errores de medicación en dispensación individualizada mediante el método del carro centinela. Farm Hosp. 2011;35(4):180–188.
Declaration of preliminary publication: some of this paper's results were presented as a poster in the 13th Congress of European Association of Hospital Pharmacists, held in Barcelona in September 2008, the 52 Congreso de la Sociedad Española de Farmacia Hospitalaria, held in Tenerife in September 2007, and as an oral presentation in the 53 Congreso de la Sociedad Española de Farmacia Hospitalaria, held in Valencia in October 2008.
articles


Farmacia Hospitalaria follows the Recommendations for the Conduct, Reporting, Editing and Publication of Scholarly Work in Medical Journals