
This article proposes a multi-currency cross-hedging strategy that minimizes the exchange risk. The use of derivatives in small and medium-sized enterprises (SMEs) is not common but, despite its complexity, can be interesting for those with international activities. In particular, the reduction in the exchange risk borne through the use of natural multi-currency cross-hedging is measured, considering Conditional Value-at-Risk (CVaR) and Value-at-Risk (VaR) for measuring market risk instead of the variance. CVaR is minimized using linear programmes, while a multiobjective genetic algorithm is designed for minimizing VaR, considering two scenarios for each currency. The results obtained show that the optimal hedge strategy that minimizes VaR is different from the minimum CVaR hedge strategy. A very interesting point is that, just by investing in other currencies, a significant risk reduction in VaR and CVaR can be obtained.
Over the last few decades, changes in exchange rates have been a major risk for companies around the world. This is particularly true for firms with foreign currency-based activities, such as imports and exports, and corporate cash flows. Thus firm value is dependent on exchange rates, rendering the management of foreign exchange rate risk an important corporate objective and activity. It is accepted that a firm exhibits exchange rate exposure if its value is affected by changes in exchange rates (Adler and Dumas, 1984). The main hedging motives are the minimization of the impact of foreign exchange rate fluctuations on the variability of the firm's operational cash flow and the reduction of the probability of financial distress and bankruptcy (Hagelin, 2003; Solomon & Joseph, 2000). This and other similar problems have been widely analyzed in the related literature. It is not only corporations that exhibit exchange rate exposure. Individuals can also be affected; for example, when they apply for a multi-currency mortgage.
Both corporations and individuals wish to protect themselves and reduce the risk in an effective way. While in many cases it would clearly be more effective to hedge a long currency position using currency futures, there are situations where currency cross-hedging may be appropriate. A medium size company that operates in two or three countries with different currency simultaneously can reduce its income risk by engaging in a hedging activity of assets correlated with the foreign rate. The use of derivatives in small and medium-sized enterprises (SMEs) is not very common (Pennings and Garcia, 2004) and becomes more complicated because of their nature. Given this complexity, multi-currency cross-hedging can be more appropriate.
In general, cross-hedging is a hedging strategy where future contracts on different deliverable instruments are used. Corporations and individuals that have exposure to two or more currencies simultaneously can use cross-hedging. An efficient approach to hedging this risk exposure is to first exploit the natural cross-hedge that arises from the non-zero correlation between the different currency exposures, and then to use derivatives to hedge the residual risk.
There are different ways to measure the risk to hedge. The classical measurement of risk is the variance, but nowadays researchers and practitioners tend to focus on Value-at-Risk (VaR) and Conditional Value-at-Risk (CVaR) as market risk measures. The VaR of a portfolio is the lowest amount which the loss will not exceed with probability 1−α. CVaR is the conditional expectation of losses above the VaR.
VaR became very popular due to the fact that Basel Committee assumed VaR as a risk measurement and that the regulatory capital for a loan is correlated to its marginal contribution to VaR. However, the use and acceptance of CVaR have increased because, in contrast to VaR, it meets expected properties. It informs us about how much we could lose if the portfolio return falls beyond VaR. Moreover, it is a convex risk measurement which makes it easy to use to set optimal strategies in optimization problems. Alfaro-Cid, Baixauli-Soler, and Fernández-Blanco (2011), Baixauli-Soler, Alfaro-Cid, and Fernández-Blanco (2010) and Baixauli-Soler, Alfaro-Cid, and Fernández-Blanco (2011) used several risk measures and different approaches to solve classical portfolio optimization problems, and, among other conclusions, they showed that using the variance as risk measure provides the same results than using CVaR. Therefore, using both simultaneously in multiobjective problems is not recommended.
In this context, the main aim of this paper is to establish the reduction in the exchange risk borne through the use of natural multi-currency cross-hedging considering VaR and CVaR as measures of market risk. For this, the mid exchange rates for 10 developed market currencies against the euro from January 1999 to December 2009 were used.
The approach presented in this paper is useful for implementing a multi-currency hedge strategy and it contributes to the literature in several ways. Firstly, it combines the use of VaR and CVaR as measures of risk with the use of multi-currency cross-hedging as instrument of hedging. The majority of papers in the literature use variance and derivatives, mainly current futures, for these purposes. Secondly, the approach of minimum hedge ratio and the mean-risk hedge are used. Thirdly, a multiobjective genetic algorithm is proposed to determine a mean-VaR hedge ratio.
The paper is organized as follows. The second section explains the determination of the hedge ratio and considers different measures of risk. The third section sets out the methodology to compute the mean-CVaR and mean-VaR hedge ratios. The fourth section describes the multiobjective genetic algorithm used to obtain mean-VaR hedge ratio. The fifth section presents the data and empirical results. Finally, the last section summarizes the main findings of the research.
Hedging the foreign exchange riskThe hedge decision requires us to establish both the optimal hedge ratio and the risk measure that needs to be reduced.
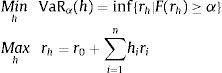
Optimal hedge ratioSuppose that there is a set of two currencies with returns r0 and r1. Cross-hedging implies that a short (long) position in a currency is used to hedge a long (short) position in the other, assuming that both currencies are positively correlated. Cross-hedging could exploit the correlation with more than one currency in order to reduce the hedge portfolio risk. In the case of n currencies the hedge portfolio return can be expressed as,
where r0 represents a long or short position in a currency, ri represents a long o short position in a currency i in order to hedge and rh represents the hedge portfolio return. One of the most important issues in hedging refers to the determination of the optimal hedge ratios, hi. The optimal hedge ratio depends critically on the particular objective function to be optimized and the measure of risk considered. Depending on the objective function the problem to solve is single-objective, since the risk of the hedge portfolio return is minimized, or multiobjective, because the risk and the expected return of the hedge portfolio are minimized/maximized simultaneously.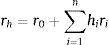
The most widely used optimal hedge ratio is the so-called minimum-variance (MV) hedge ratio. This is a single objective problem where the risk, measured with the variance, is minimized. This MV hedge ratio is derived by minimizing the variance of the hedged portfolio and it is quite simple to understand and estimate. Nevertheless, the MV hedge ratio ignores the expected return of the hedged portfolio and so, in general, the MV hedge ratio is not consistent with the mean-variance framework. To make this hedge ratio consistent with the mean-variance framework, it is necessary to include the expected return on the hedged portfolio in the objective function explicitly (Chen, Lee, & Shrestha, 2008). Under return-risk hedge ratios, expected return and risk of the hedged portfolio are considered. Companies determine the expected returns and risk, and as a consequence, the optimal hedging is obtained. When variance is used to measure risk, this approach is called mean-variance hedge ratio.
Measures of risk to hedgeThe different measures of portfolio risk can be characterized in several ways. The most important characteristics refer to the coherence of the proposed measure and to its ability to deal with the asymmetry of the returns function distribution.
Following Artzner, Delbaen, Erber, and Heath (1999), a risk measurement can be viewed as a single number ρ(r) assigned to the distribution of the portfolio return r. It is said that a risk measurement is coherent if it satisfies four properties: monotonicity, translation invariance, homogeneity and subadditivity. Standard deviation and CVaR satisfy the four properties while VaR satisfies three of them but it does not satisfy subadditivity under certain conditions. An optimization problem that includes non-coherent measures is usually ill-posed, in the sense of Hamard (Alexander, Coleman, & Li, 2006), which means that it does not have a single and exact solution.
Risk measures can be also classified in symmetric and asymmetric measures. Symmetric measures are those that do not take into consideration the asymmetry of the return function distribution, such as variance or standard deviation. Their use is only appropriate when those functions are normally distributed or, at least, symmetric. Asymmetric risk measures are those that take into consideration the skewness and kurtosis of the return function distribution (Harris & Shen, 2006). Among them, VaR and CVaR.
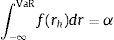
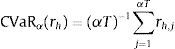
Some of the advantages of VaR are that it takes into account the asymmetric risk, a temporal period and a confidence level. VaR can be defined as the maximum expected loss within an investment horizon of n days with an error probability of α%. By definition, VaR is a quantile of the probability distribution of the portfolio value. Let f(rh) be the probability distribution function of the future portfolio return and α the significant level (usually 1% or 5%), VaR is implicitly defined in the following equation,
VaR can be computed by using an analytic method or Delta Normal, a Montecarlo method or a historical simulation method. The analytic method assumes that returns are normally distributed and that VaR is proportional to the variance. In the Montecarlo method, simulations are carried out to generate returns assuming that the return distribution function is known and not necessarily symmetric. Finally, the historical simulation method does not make any assumption regarding the return distribution function. It is based on the idea that past behaviour is a good predictor of future behaviour. In this work VaR si computed by using a historical simulation method. The portfolios are built following Eq. (1), using the historical return series. The same probability of occurrence (1/T) is assigned to every day and, ordering the returns rh in decreasing order, VaR is chosen as rh* in the position αT.
Following, Alfaro-Cid et al. (2011) and Baixauli-Soler et al. (2011), we use a multiobjective genetic algorithm to obtain the optimal hedge ratios when VaR is considered as objective function to minimize. CVaR is a risk measure that has many of the advantages of VaR and quite a few less disadvantages. CVaR takes into account asymmetric risk, a temporal period and a confidence level. Rockafellar and Uryasev (2000) propose CVaR as a coherent risk measure, it deals with the kurtosis and skewness of the return distribution function and exact solutions may be found for an optimization problem. CVaR is defined as the average of all losses exceeding the VaR and it is computed as the expected value of r conditional on exceeding the VaR,
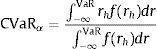
CVaR is closely linked to VaR. We compute CVaR by using a historical simulation method, as in VaR case. That is, we obtain CVaR from the entire distribution of historical returns, as the sample mean of rh,j lower than VaR.
It can be demonstrated that CVaR is consistent with the minimum variance approximation. See, for example, Baixauli-Soler et al. (2010). Under the historical simulation the CVaR and VaR hedge ratios may be different. Given that risk minimization turns the optimization problem in a well-posed problem if CVaR is used, or ill-posed problem if VaR is used, we use a linear programming or a multiobjective genetic algorithm to obtain optimal hedge ratios depending on whether CVaR or VaR is used to measure risk.
MethodologyMean risk hedge ratio problemsThe mean-VaR hedge ratio for cross-hedging a long position with long or short positions in other currencies can be obtained by solving the following multiobjective problem:
As it is known, portfolio optimization problems attempt to obtain the smallest risk value for a given return, or the highest return for a certain risk level. Logically, using VaR as a risk measure, the optimization problem is a typical ill-posed problem, in the sense of Hamard (Alexander et al., 2006), because VaR is difficult to optimize for discrete distributions since is non-convex and has multiple local extrema.
In contrast to VaR, Rockafellar and Uryasev (2000, 2002) demonstrate that, in the case of discrete random variables with T possible outcomes, it is possible to linearize CVaR by introducing a vector of auxiliary variables. CVaR is replaced by a linear function in the objective function. Then, the mean-CVaR hedge ratio for cross-hedging a long or short position with long or short positions in other currencies can be obtained solving the following linear problem.
s.t.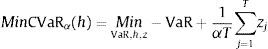
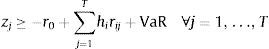
Consequently, in our research we have run multiobjective genetic algorithms to minimize VaR (problem (4)) and linear programmes to minimize CVaR (problem (5)). In particular, we have considered two scenarios for each currency: (i) to hedge a loan in a foreign currency with loans or deposit accounts in the rest of the currencies; (ii) to hedge a deposit in a foreign currency with loans or deposit accounts in the rest of the currencies.
Multiobjective genetic algorithmThe GA implementation is based on ECJ (http://cs.gmu.edu/∼eclab/projects/ecj), a research evolutionary computation system in Java developed at George Mason University's Evolutionary Computation Laboratory (ECLab). In this work the SPEA2 package of ECJ was used for the multiobjective aspect of the optimization (Zizler et al., 2001), since it has shown better performance than other multiobjective techniques in various benchmark problems. A detailed description of the algorithm used can be found as well in Baixauli-Soler et al. (2010).
The two objectives to maximize are set to the expected return and to the inverse of the VaR. Multiobjective GA requires to fix some parameters before running the algorithm. In this case, the GA implementation uses tournament selection with a group size of 7, all individuals undergo crossover in each generation and 5% of them suffer mutation. The population size used was 1000 individuals that evolved along 50 generations. The archive size was set to 100.
Every possible solution under evaluation (called individual) is represented as a vector of n integers (h1GA,h2GA,…,hnGA), where n is the number of currencies available to hedge.
The evaluation of individuals follows this flow. First, portfolio returns are calculated as
rh,j=r0,j−∑i=1nhiGAri,j, ∀j, where hiGA, is the weight assigned to currency i, n is the number of currencies available in the hedge portfolio and rij is the return of currency i at time j.
Once the historical series of portfolio returns is calculated, it is sorted in descending order. The 0.01-quantile is fixed to the element occupying the position 0.01T in the sorted series.
The expected return can be computed as E(rh)=(1/T)∑j=1Trj where T is the number of observations per currency.
Finally, VaR is calculated as the expected return minus the 0.01-quantile of the historic return series.
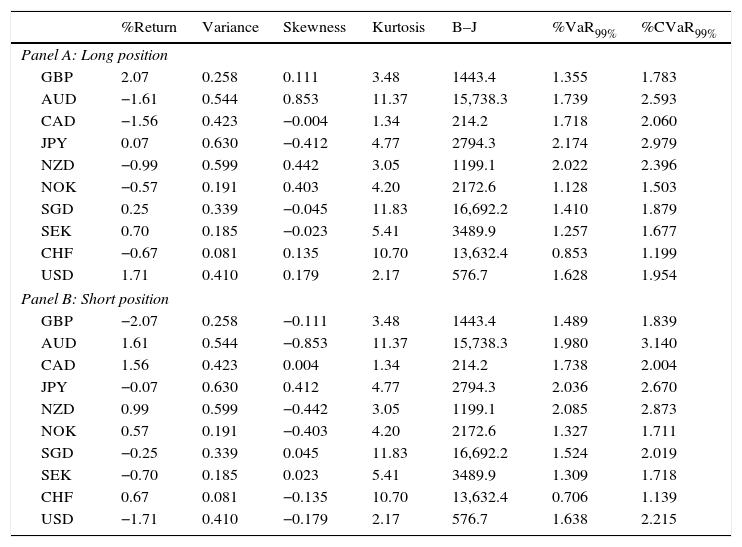
Data and empirical resultsThe data set has been obtained from the Bloomberg Database. The mid exchange rates for 10 developed market currencies (GBP, AUD, CAD, JPY, NZD, NOK, SGD, SEK, CHF and USD) are measured against the EUR for the period of 01/01/1999 to 31/12/2009; that is, a total of 2870 observations per currency. Table 1 reports summary statistics for the 10 currency series for the whole period. A long position and a short position are considered in each currency because the distribution is a non-symmetric distribution. The variance of the returns covers between 0.081 for CHF and 0.630 for JPY. The skewness coefficient is placed from −0.41 for JPY and 0.85 for AUD. The excess kurtosis coefficient ranges from 1.34 for CAD to 11.83 for SGD. Jarque–Bera test indicates that normality hypothesis cannot be accepted for all currencies. VaR and CVaR at a 99% level of confidence have been computed following the historical simulation method. It can be seen that VaR and CVaR values for long and short positions differ since the shape of the upper and lower tail are different.
Summary statistics.
| %Return | Variance | Skewness | Kurtosis | B–J | %VaR99% | %CVaR99% | |
|---|---|---|---|---|---|---|---|
| Panel A: Long position | |||||||
| GBP | 2.07 | 0.258 | 0.111 | 3.48 | 1443.4 | 1.355 | 1.783 |
| AUD | −1.61 | 0.544 | 0.853 | 11.37 | 15,738.3 | 1.739 | 2.593 |
| CAD | −1.56 | 0.423 | −0.004 | 1.34 | 214.2 | 1.718 | 2.060 |
| JPY | 0.07 | 0.630 | −0.412 | 4.77 | 2794.3 | 2.174 | 2.979 |
| NZD | −0.99 | 0.599 | 0.442 | 3.05 | 1199.1 | 2.022 | 2.396 |
| NOK | −0.57 | 0.191 | 0.403 | 4.20 | 2172.6 | 1.128 | 1.503 |
| SGD | 0.25 | 0.339 | −0.045 | 11.83 | 16,692.2 | 1.410 | 1.879 |
| SEK | 0.70 | 0.185 | −0.023 | 5.41 | 3489.9 | 1.257 | 1.677 |
| CHF | −0.67 | 0.081 | 0.135 | 10.70 | 13,632.4 | 0.853 | 1.199 |
| USD | 1.71 | 0.410 | 0.179 | 2.17 | 576.7 | 1.628 | 1.954 |
| Panel B: Short position | |||||||
| GBP | −2.07 | 0.258 | −0.111 | 3.48 | 1443.4 | 1.489 | 1.839 |
| AUD | 1.61 | 0.544 | −0.853 | 11.37 | 15,738.3 | 1.980 | 3.140 |
| CAD | 1.56 | 0.423 | 0.004 | 1.34 | 214.2 | 1.738 | 2.004 |
| JPY | −0.07 | 0.630 | 0.412 | 4.77 | 2794.3 | 2.036 | 2.670 |
| NZD | 0.99 | 0.599 | −0.442 | 3.05 | 1199.1 | 2.085 | 2.873 |
| NOK | 0.57 | 0.191 | −0.403 | 4.20 | 2172.6 | 1.327 | 1.711 |
| SGD | −0.25 | 0.339 | 0.045 | 11.83 | 16,692.2 | 1.524 | 2.019 |
| SEK | −0.70 | 0.185 | 0.023 | 5.41 | 3489.9 | 1.309 | 1.718 |
| CHF | 0.67 | 0.081 | −0.135 | 10.70 | 13,632.4 | 0.706 | 1.139 |
| USD | −1.71 | 0.410 | −0.179 | 2.17 | 576.7 | 1.638 | 2.215 |
Return (average annual return in percentage), Kurtosis (excess kurtosis coefficient), B–J (Bera–Jarque statistic), and VaR99% and CVaR99% are the 99% 1-day VaR and CVaR computed with daily returns. Sample period: 01/01/1999 to 31/12/2009. We use Standard ISO currency abbreviations: GBP is the British pound, AUD is the Australian dollar, CAD is the Canadian dollar, JPY is the Japanese yen, NZD is the New Zealand dollar, NOK is the Norwegian krone, SGD is the Singapore dollar, SEK is the Swedish krona, CHF is the Swiss franc, and USD is the U.S. dollar.
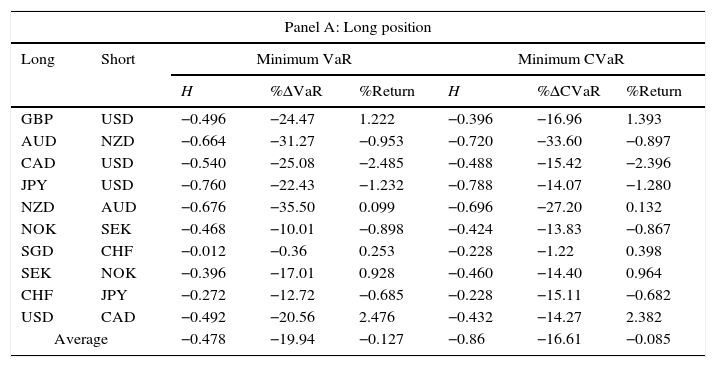
Table 2 contains the hedging effectiveness of the minimum VaR and the minimum CVaR hedging strategy for the two-currency hedge portfolio. Panel A reports the minimum VaR hedge ratio and the minimum CVaR hedge ratio with their corresponding reduction in VaR and CVaR relative to the unhedged long position in each currency. Panel B reports the same information for a short position in each currency. The R-square coefficient has been computed for all two-currency portfolios and select the largest that allows us to obtain the maximum reduction in risk.
Hedging effectiveness of minimum VaR and minimum CVaR: Two currency hedge portfolio.
| Panel A: Long position | |||||||
|---|---|---|---|---|---|---|---|
| Long | Short | Minimum VaR | Minimum CVaR | ||||
| H | %ΔVaR | %Return | H | %ΔCVaR | %Return | ||
| GBP | USD | −0.496 | −24.47 | 1.222 | −0.396 | −16.96 | 1.393 |
| AUD | NZD | −0.664 | −31.27 | −0.953 | −0.720 | −33.60 | −0.897 |
| CAD | USD | −0.540 | −25.08 | −2.485 | −0.488 | −15.42 | −2.396 |
| JPY | USD | −0.760 | −22.43 | −1.232 | −0.788 | −14.07 | −1.280 |
| NZD | AUD | −0.676 | −35.50 | 0.099 | −0.696 | −27.20 | 0.132 |
| NOK | SEK | −0.468 | −10.01 | −0.898 | −0.424 | −13.83 | −0.867 |
| SGD | CHF | −0.012 | −0.36 | 0.253 | −0.228 | −1.22 | 0.398 |
| SEK | NOK | −0.396 | −17.01 | 0.928 | −0.460 | −14.40 | 0.964 |
| CHF | JPY | −0.272 | −12.72 | −0.685 | −0.228 | −15.11 | −0.682 |
| USD | CAD | −0.492 | −20.56 | 2.476 | −0.432 | −14.27 | 2.382 |
| Average | −0.478 | −19.94 | −0.127 | −0.86 | −16.61 | −0.085 | |
| Panel B: Short position | |||||||
|---|---|---|---|---|---|---|---|
| Short | Long | Minimum VaR | Minimum CVaR | ||||
| H | %ΔVaR | %Return | H | %ΔCVaR | %Return | ||
| GBP | USD | 0.456 | −6.73 | −1.290 | 0.352 | −2.91 | −1.468 |
| AUD | NZD | 0.736 | −35.98 | 0.882 | 0.808 | −41.46 | 0.811 |
| CAD | USD | 0.440 | −22.68 | 2.314 | 0.401 | −12.71 | 2.246 |
| JPY | USD | 0.928 | −19.29 | 1.519 | 0.800 | −26.10 | 1.300 |
| NZD | AUD | 0.768 | −29.74 | −0.248 | 0.776 | −36.51 | −0.260 |
| NOK | SEK | 0.464 | −16.24 | 0.895 | 0.560 | −12.76 | 0.963 |
| SGD | CHF | −0.600 | −3.73 | 0.155 | −0.136 | −1.56 | −0.155 |
| SEK | NOK | 0.552 | −18.75 | −1.017 | 0.624 | −19.34 | −1.058 |
| CHF | JPY | 0.040 | −5.67 | 0.670 | 0.201 | −12.54 | 0.681 |
| USD | CAD | 0.512 | −21.89 | −2.507 | 0.512 | −12.50 | −2.507 |
| Average | 0.430 | −18.07 | 0.137 | 0.489 | −17.84 | 0.055 | |
Panel A reports the minimum-VaR hedge ratio and minimum-CVaR hedge ratio relative to a long position in a currency. Panel B reports the minimum-VaR hedge ratio and minimum-CVaR hedge ratio relative to a short position in a currency.
Panel A shows that two-currency minimum VaR hedging enables us to obtain a considerable reduction in portfolio VaR for nine of the currencies. This reduction goes from 10.01% for NOK/SEK to 35.50% for NZD/AUD. For SGD/CHF, the reduction is only 0.36%, which is very close to zero and due to the very low correlation of SGD with each of the other nine currencies (maximum value 0.049 with CHF). On average, the reduction in VaR is 19.94% and the hedge ratio is placed from −0.012 for SGD/CHF to −0.760 for JPY/USD. In relation to minimum CVaR hedged portfolios, there is reduction for the ten currencies which ranges from 1.22% for SGD/CHF to 33.60% for AUD/NZD. On average, the reduction in CVaR is 16.61%. The hedge ratio is placed from −0.228 for SGD/CHF and CHF/JPY to −0.788 for JPY/USD. In both minimum VaR and CVaR hedge portfolios a negative return is obtained for five of the ten hedged portfolios.
Panel B shows that, when a short position in the currency is hedged with a long position, the minimum VaR hedge portfolio exhibits a VaR reduction for ten hedged portfolios which ranges from 3.73% for SGD/CHF to 35.98% for AUD/NZD. On average the VaR reduction is 18.07%. The hedge ratio is placed from −0.600 for SGD/CHF to 0.928 for JPY/USD. In relation to minimum CVaR hedge portfolios, there is a CVaR reduction for the ten currencies, which ranges from 1.56% for SGD/CHF to 41.46% for AUD/NZD. On average, the reduction in CVaR is 17.84%. The hedge ratio is placed from −0.136 for SGD/CHF to 0.808 for JPY/USD. A negative hedge ratio of −0.136 implies that a short position in SGD is hedged with a short position in CHF, given the negative correlation between the currencies. In both minimum VaR and CVaR hedge portfolios a negative return is obtained for four out of the ten hedged portfolios.
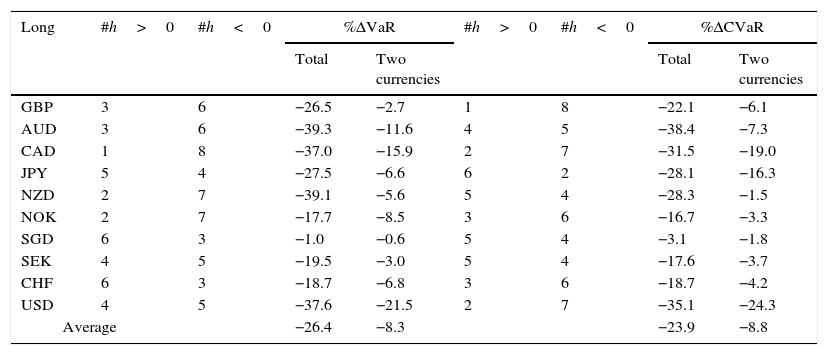
Table 3 shows the risk reduction with minimum VaR and CVaR ten-currency hedging for a given return with regards to two hedge portfolio and total, that is, with regards to VaR and CVaR of each unhedged position in each currency. In particular, the given return is selected to be the minimum VaR and CVaR two-currency efficient portfolio. In the long scenario, the total reduction in VaR and CVaR ranges from 1% for SGD to 39.3% for AUD and from 3% for SGD to 38.4% for AUD with an average reduction of 26.4% and 23.9%. With regards to reductions in comparison to the two currency hedge portfolios, the most important additional reductions in VaR are for CAD (15.9%) and USD (21.5%), and in CVaR, for CAD (19%) and USD (24.3%). In the short scenario, the most important reductions in VaR are for AUD (42.3%) and USD (37.1%), and in CVaR, for AUD (47.8%) and NZD (38.9%). In comparing with the two-currency hedge portfolio, the most considerable VaR and CVaR reduction occur for USD (19.4% and 23.9%). The average reductions are 8.3% (VaR for long), 8.8% (CVaR for long) and 10% (VaR for short) 9.7% (CVaR for short). The number of different currencies added to the hedging portfolio is nine, except in one portfolio (CVaR-JPY long) where eight currencies are added.
Minimum CVaR for a return given ten currecy hedging.
| Long | #h>0 | #h<0 | %ΔVaR | #h>0 | #h<0 | %ΔCVaR | ||
|---|---|---|---|---|---|---|---|---|
| Total | Two currencies | Total | Two currencies | |||||
| GBP | 3 | 6 | −26.5 | −2.7 | 1 | 8 | −22.1 | −6.1 |
| AUD | 3 | 6 | −39.3 | −11.6 | 4 | 5 | −38.4 | −7.3 |
| CAD | 1 | 8 | −37.0 | −15.9 | 2 | 7 | −31.5 | −19.0 |
| JPY | 5 | 4 | −27.5 | −6.6 | 6 | 2 | −28.1 | −16.3 |
| NZD | 2 | 7 | −39.1 | −5.6 | 5 | 4 | −28.3 | −1.5 |
| NOK | 2 | 7 | −17.7 | −8.5 | 3 | 6 | −16.7 | −3.3 |
| SGD | 6 | 3 | −1.0 | −0.6 | 5 | 4 | −3.1 | −1.8 |
| SEK | 4 | 5 | −19.5 | −3.0 | 5 | 4 | −17.6 | −3.7 |
| CHF | 6 | 3 | −18.7 | −6.8 | 3 | 6 | −18.7 | −4.2 |
| USD | 4 | 5 | −37.6 | −21.5 | 2 | 7 | −35.1 | −24.3 |
| Average | −26.4 | −8.3 | −23.9 | −8.8 | ||||
| Short | #h>0 | #h<0 | %ΔVaR | #h>0 | #h<0 | %ΔCVaR | ||
|---|---|---|---|---|---|---|---|---|
| Total | Two currencies | Total | Two currencies | |||||
| GBP | 5 | 4 | −22.5 | −16.9 | 9 | 0 | −13.7 | −11.2 |
| AUD | 4 | 5 | −42.3 | −9.8 | 6 | 3 | −47.8 | −10.8 |
| CAD | 8 | 1 | −35.9 | −17.1 | 6 | 3 | −31.2 | −21.2 |
| JPY | 4 | 5 | −26.3 | −8.7 | 4 | 5 | −29.8 | −5.0 |
| NZD | 5 | 4 | −35.0 | −7.5 | 7 | 2 | −38.9 | −3.9 |
| NOK | 5 | 4 | −21.6 | −6.4 | 9 | 0 | −19.3 | −7.6 |
| SGD | 4 | 5 | −7.2 | −3.6 | 7 | 2 | −3.6 | −2.1 |
| SEK | 6 | 3 | −25.7 | −8.6 | 6 | 3 | −25.3 | −7.3 |
| CHF | 5 | 4 | −7.7 | −2.1 | 3 | 6 | −16.5 | −4.5 |
| USD | 5 | 4 | −37.1 | −19.4 | 3 | 6 | −33.4 | −23.9 |
| Average | −26.1 | −10.0 | −26.0 | −9.7 | ||||
#h>0: total number of currencies in the hedging portfolio with a long position; #h<0: total number of currencies in the hedging portfolio with a short position; Total: risk reduction for minimum VaR and CVaR ten currency hedging with regard to initial VaR and CVaR of each currency; Two currencies: risk reduction for minimum VaR and CVaR ten-currency hedging with regard to VaR and CVaR of the two-currency hedge efficient portfolio minimum CVaR.
Fig. 1 shows graphs corresponding to the minimum VaR and CVaR ten currency hedging for different levels of return for long AUD hedge portfolios. Also, the initial unhedged AUD position and the minimum VaR and CVaR for the two-currency hedge portfolio are plotted in each graph.

Graphically it can be observed significant reductions in VaR and CVaR for a long position on AUD with two-currency hedging portfolio. When a ten-currency hedging portfolio is considered, the additional reductions in VaR and CVaR are small and can disappear if constraints related to long (loans) and short (deposit accounts) positions in some currencies are considered. Hence, optimal hedge ratio under the objective of minimizing risk does not depend on the number of added currencies. By contrast, optimal hedge ratio consistent on mean-risk framework is very sensitive to the number of added currencies. This implies that when an expected return is fixed a ten-currency hedging portfolio is significantly more efficient in VaR and CVaR than two-currency hedging portfolio. The AUD long position results are quite similar to the rest of currencies.
ConclusionsMovements in exchange rates are a major risk for companies with foreign currency-based activities. Different approaches, such as hedging via forwards, currency swaps, futures options and many other complex financial instruments, have been employed in order to effectively manage risk. Multi-currency cross hedging is relevant because it greatly expands the opportunity set of risk reducing alternatives.
VaR and CVaR have been used for measuring currency risk exposure because they are suitable for asymmetric return distributions. This choice is consistent with the asymmetric return distribution functions exhibited in our data set.
Our results show that the optimal hedge strategy that minimizes VaR is different from the minimum CVaR hedge strategy. The approach described in this paper could help to hedgers to obtain the optimal minimum VaR hedge strategy through a multiobjective genetic algorithm. Portfolio diversification has the potential to substitute the hedged portfolios with derivatives, which can help small and medium-sized enterprises (SMEs).
Also, we have dealt with the question of which degree of risk reduction in VaR and CVaR offers multi-currency cross-hedging. A two-currency hedge strategy can reduce VaR up to 35.98% and on average around 19% and CVaR up to 41.46% and on average around 17%. Without considering any constraint, an increase in the number of currencies to hedge from two currencies to ten implies an additional increase in risk reduction on average around 9% in both VaR and CVaR.
Furthermore, if a mean-risk framework is considered, an optimal mean-risk hedge ratio accounting for the trade-off between return and risk differs from the minimum risk hedge ratio and it is significantly more efficient as the number of currencies to hedge increases in both VaR and CVaR.
Overall, given our findings, in a multi-currency hedge strategy is not critical to consider several currencies to obtain a significant VaR and CVaR reduction in contrast with a mean-risk framework.
Financial support from Spanish government was provided by project ECO 2008-02846.