metricas
Enfermedades Infecciosas y Microbiología Clínica (English Edition) Unsuccessful tuberculosis-treatment in HIV-positive patients and associated fact...
Journal Information
Visits
767
Vol. 43. Issue 10.
Pages 629-724 (December 2025)
Original article
Full text access

Unsuccessful tuberculosis-treatment in HIV-positive patients and associated factors

Tratamiento no exitoso de tuberculosis en pacientes VIH positivos y factores asociados
Visits
767
Guillermo Boscha,b, Joan-Pau Milletb,c,d,
Corresponding author
jmillet@aspb.cat

Corresponding author.
, Àngels Orcaub,c, Isabel Moreiraa,b, Carles Pericasb,c,e, Lluïsa Fornsb,c, Isabel Marcosb,c, Raquel Prietob,c, Anna Hernandezb,c, Lídia Arranzb,c, Cristina Riusb,c,d
a Hospital del Mar, Barcelona, Spain
b Agència de Salut Pública de Barcelona, Barcelona, Spain
c Institut d’Investigació Biomèdica Sant Pau (IIB Sant Pau), Barcelona, Spain
d Centro de Investigación Biomédica en Red de Epidemiología y Salud Pública (CIBERESP), Madrid, Spain
e Departament de Medicina, Universitat de Barcelona, Barcelona, Spain
This item has received
Article information
Abstract
Full Text
Bibliography
Download PDF
Statistics
Figures (1)
fig0005
Tables (2)
Table 1. Sociodemographic and clinical differences between TB patients with and without HIV co-infection in Barcelona, Spain (2000–2021). Unweighted frequencies and percentages.
Tables
Table 2. Differences in treatment success among PLHVI according to base characteristics in Barcelona, Spain (2000–2021).
Tables
Abstract
Background

TB is one of the most deathly infections worldwide, affecting disproportionally people living with HIV (PLHIV). Furthermore, HIV co-infection is related to worse outcomes for TB patients, including lower treatment success.

Methods

Using surveillance records of all TB cases notified in Barcelona city from 2001 to 2021, we analyzed TB treatment success according to HIV status. Additionally, we explored potential social and health related and factors associated to unsuccessful treatment in PLHIV, using multiple regression analyses.
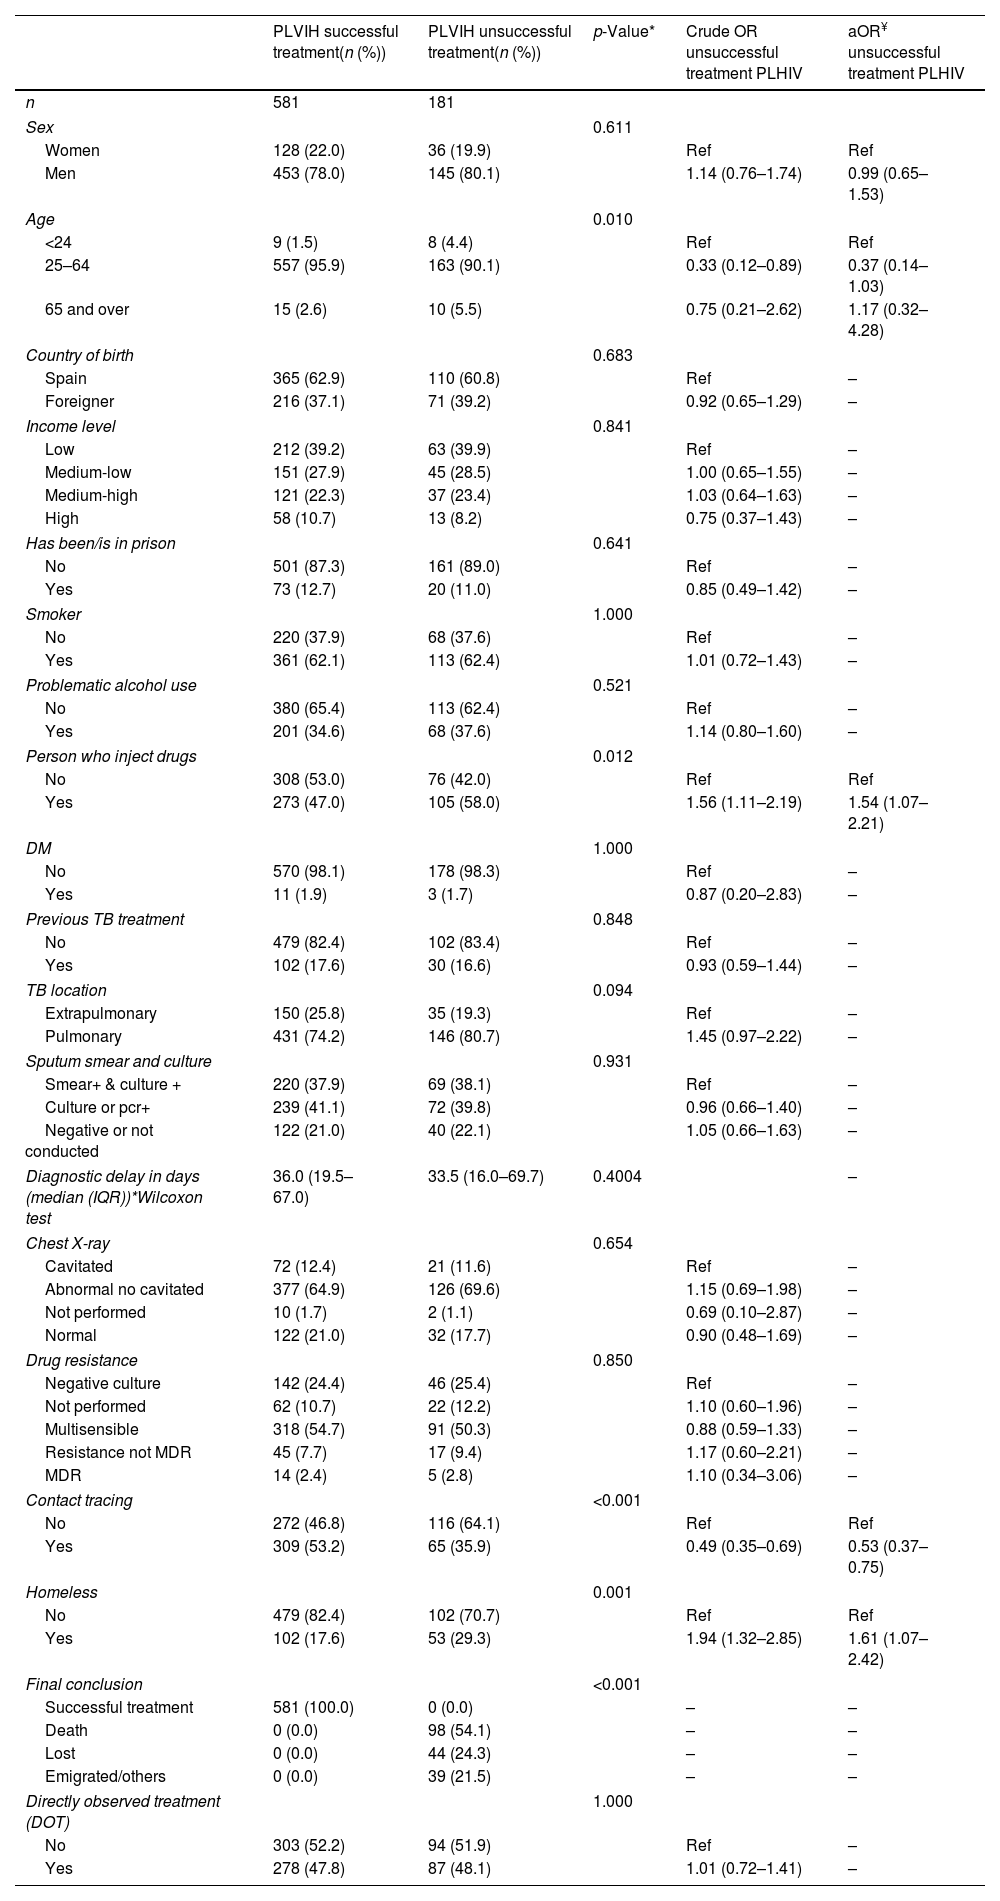
Results

Out of the 8406 new TB cases diagnosed during the study period, 9% were co-infected with HIV. According to our regression models, PLHIV were more frequently men, users of injected drugs (aOR=45.81; 95% CI (33.10–64.26)), had previously been treated for TB (aOR=1.77; 95% CI (1.30–2.40)) and had a lower rate of contact tracing (aOR=0.51; 95% CI (0.40–0.64)). Among PLHIV, unsuccessful treatment was related to the use of injected drugs and homelessness, but it was lower for those who had undergone contact tracing.

Conclusion

PLHIV have higher odds of unsuccessful TB treatment, especially those who are homeless and use injected drugs. Contact tracing improved treatment success, calling for further efforts and resources to correctly follow-up on these patients, with the goal of increasing treatment success.

Keywords:
Tuberculosis
HIV
Co-infection
Therapeutics
Epidemiology
Resumen
Introducción

La tuberculosis (TB) es una de las infecciones más mortales en todo el mundo, afectando de manera desproporcionada a las personas que viven con VIH (PVVIH). Además, la coinfección por VIH está relacionada con peores resultados para los pacientes con TB, incluyendo una menor tasa de éxito en el tratamiento.

Métodos

Utilizando registros de vigilancia de todos los casos de TB notificados en la ciudad de Barcelona desde 2001 hasta 2021, analizamos el éxito del tratamiento de TB según el estado de VIH. Adicionalmente, exploramos factores sociales y relacionados con la salud asociados al tratamiento no exitoso en PVVIH, utilizando análisis de regresión múltiple.

Resultados

De los 8,406 nuevos casos de TB diagnosticados durante el periodo del estudio, el 9% estaban coinfectados con VIH. Según nuestros modelos de regresión, las PVVIH eran más frecuentemente hombres, usuarios de drogas inyectadas (aOR=45.81; 95% IC (33.10-64.26)), habían sido tratados previamente por TB (aOR=1.77; 95% CI (1.30-2.40)) y tenían una tasa de rastreo de contactos más baja (aOR=0.51; 95% CI (0.40-0.64)). Entre las PVVIH, el tratamiento no exitoso estaba relacionado con el uso de drogas inyectadas y la falta de hogar, pero era menor para aquellos que habían sido objeto de rastreo de contactos.

Conclusión

Las PVVIH tienen mayores probabilidades de un tratamiento no exitoso de TB, especialmente aquellos que son personas sin hogar y que usan drogas inyectadas. El rastreo de contactos mejoró el éxito del tratamiento, lo que requiere más esfuerzos y recursos para dar un seguimiento adecuado a estos pacientes, con el objetivo de aumentar el éxito en el tratamiento.

Palabras clave:
Tuberculosis
VIH
Coinfección
Terapéutica
Epidemiología
Full Text
Introduction

Tuberculosis (TB) was the second leading cause of death from a single agent worldwide in 2022, only after COVID-19, and caused almost twice as many deaths as HIV/AIDS.1 In the European Region an estimated 230000 people fell ill with TB in 2021, which accounts for 25 cases per 100000 people.2

People living with HIV (PLHIV) are a high-risk group for developing TB, which is one of the AIDS-defining illnesses.3 PLHIV are 16 times more likely to fall ill with TB disease than people without HIV.4 Worldwide, 6.3% of all TB cases notified in 2022 were HIV-positive, a proportion that has been steadily declining for several years, according to the WHO.1 Nevertheless, in the European Region this percentage raised to a 13% in 2021, in line with previous years.2

Despite limited treatment efficacy and availability, successful TB treatment and antiretroviral treatment in people with TB/HIV co-infection have averted an estimated of 6.4 million deaths worldwide between 2010 and 2022, and more than 200000 deaths only in the WHO European Region.1 Still, TB is the leading cause of death among people living with HIV. In 2022, about 167000 people died of HIV-associated TB worldwide, 20000 only in the European Region.2 Therefore, prevention and TB control activities are the most important measures needed to reduce morbidity and mortality among PLHIV.4

Several studies in both general and institutionalized populations have identified HIV status to be one of the main factors for TB treatment failure.5,6 However, there is still a lack of knowledge on potential associated factors of treatment failure among HIV-positive TB patients. Moreover, the profile of this specific population might have changed through time due to the several reasons, including: harm reduction strategies,7,8 better prepared health systems with advances in treatment and prevention9,10 and improved surveillance, together with notable demographic changes.11

In the city of Barcelona (Catalonia, Spain), the TB program of the Agència de Salut Pública de Barcelona (ASPB) is in charge of surveillance and control of the disease since 1987 and keeps extensive electronic records on comorbidities and treatment outcomes since 2001.

In order to explore the epidemiological trends and changes in HIV-positive TB cases characteristics in Barcelona city, we conducted a study covering all cases registered during the span of 22 years.

MethodsStudy design and population

We performed a population based observational study using the cohort of incident TB cases registered in the city of Barcelona, Spain, from January 1st 2000 to December 31st 2021. We included all cases notified to the TB Prevention and Control Program who started TB treatment during this period. National and international guidelines of TB case definition were used.12

Data sources

We obtained all data from the electronic TB records of the ASPB. These records include sociodemographic and health related information for all TB cases declared in the city of Barcelona and are regularly updated with incident cases. These records are used for epidemiological surveillance and control. Information is registered for patient follow-up and contact tracing until end of treatment of the case and contacts. Cases are then considered “closed”, as well as if they either die or are lost to follow-up before finishing successful treatment. Individual-level data is retrieved from the epidemiologic survey, which is filled by a nurse of the Epidemiology Unit with information provided by the patient, healthcare professionals and clinical records. TB records were cross-referenced with the ASPB official HIV records to ensure all PLHIV that fit the inclusion criteria were considered.

Income level is indirectly obtained from an aggregate disposable household income index, according to the neighborhood of residence and categorized into quartiles (low, medium-low, medium-high and high income level). The index was yearly updated up to 2019. For the following years, neighborhoods were assigned to their 2019 quartiles.

Outcomes and relevant variables

The main outcome of our study was unsuccessful TB treatment, guided by the opposite “Treatment success”, defined by the WHO's as “The sum of cured and treatment completed”.13 Therefore, we included death, lost to follow-up, failure or transfer as motives of unsuccessful treatment.

We considered several sociodemographic co-variables that were closely related to the epidemiology of TB and HIV, such as age (0–24; 25–64; 65 or older), sex (women-men), prison background (no-yes), homelessness (no-yes), income level and country of birth. As for clinical variables, we studied health-related habits (tobacco, alcohol use, use of injected drugs), diabetes, type of TB, chest X-ray, resistances to TB treatment, previous TB treatment, directly observed therapy, days of diagnostic delay in TB, contact tracing and final clinical result.

Statistical analyses

We estimated unweighted frequencies and percentages for all the considered variables for patients with and without HIV co-infection. Differences between these two groups were tested using χ2 and Wilcoxon test for median of days of diagnostic delay.

To identify associated factors that could explain unsuccessful TB treatment, we performed a logistic regression model for patients with HIV co-infection, to estimate adjusted odds ratios (aOR) of unsuccessful treatment for each variable considered. The level of statistical significance was set to α=0.05. Only variables that showed statistical significance in the bivariate models and were of epidemiological interest for the adjustment were considered for the multivariate analyses (age, sex, person who injects drugs, contact tracing and homelessness).

The statistical analysis was carried out using the RStudio software version 4.2.2.

Ethical considerations

To guarantee confidentiality of the data and records, we adhered to the regulations established by the Organic Law on the Protection of Personal Data 03/18 of December 5 in Spain, the European data protection law 2018/1725 and to the ethical principles for human research defined by the Helsinki Declaration of 1964, revised and updated by the World Medical Organization (Edinburgh 2000). Data were collected for public health surveillance purposes and this study is the result of this routine epidemiological surveillance, using aggregated data, therefore the study did not require ethical approval nor is it possible to obtain it.

Results

Out of the 8406 new TB cases diagnosed during these 22 years, our study focused on those patients who had HIV co-infection. Fig. 1 shows the evolution of HIV prevalence among new TB cases from 2000 to 2021 in Barcelona city. Though irregular, a significant decrease in HIV-positive TB incidence was observed during this time, changing from a 14.8% of co-infection in 2000 to 5.2% in 2021.

Fig. 1.

Evolution of TB cases according to HIV status in Barcelona.

Table 1 shows the univariate and bivariate analysis of differences in sociodemographic and clinical characteristics of patients with TB with and without HIV co-infection. Statistically significant differences between groups were found in all sociodemographic variables, except for income level. PLHIV and TB co-infection were more frequently men, aged between 25 and 64 years old, had 10 times more frequently prison background, doubled tobacco and alcohol consumption and were almost 80 times more frequently injected drug users. As for clinical variables, we found statistically significant differences in all of them. PLHIV doubled the percentage of unsuccessful TB treatment, had more frequently taken TB treatment in the past and higher rates of directly observed treatment (DOT).

Table 1.

Sociodemographic and clinical differences between TB patients with and without HIV co-infection in Barcelona, Spain (2000–2021). Unweighted frequencies and percentages.

n (%)  No HIV co-infection(n=7644)  PLHIV(n=762)  p-Value*  Crude OR of having HIV  aOR of having HIV 
Sex      <0.001     
Women  2945 (38.5)  194 (21.5)    Ref  Ref 
Men  4699 (61.5)  598 (78.5)    2.29 (1.92–2.74)  1.75 (1.37–2.24) 
Age      <0.001     
<24  1316 (17.2)  17 (2.2)    Ref  Ref 
25–64  4790 (62.7)  720 (94.5)    11.64 (7.41–19.66)  8.22 (4.73–15.62) 
65 and over  1536 (20.1)  25 (3.3)    1.26 (0.68–2.38)  1.06 (0.52–2.28) 
Country of birth      <0.001     
Foreign country  3574 (46.8)  287 (37.7)    Ref  Ref 
Spain  4070 (53.2)  475 (62.3)    1.45 (1.25–1.70)  1.47 (1.16–1.87) 
Income level      0.499     
Low  3103 (41.6)  275 (39.3)    Ref  Ref 
Medium-low  2083 (27.9)  196 (28.0)    1.06 (0.88–1.28)  1.24 (0.96–1.61) 
Medium-high  1613 (21.6)  158 (22.6)    1.11 (0.90–1.35)  1.86 (1.42–2.43) 
High  657 (8.8)  71 (10.1)    1.22 (0.92–1.60)  2.53 (1.76–3.58) 
Has been/is in prison      <0.001     
No  7540 (98.6)  669 (87.7)    Ref  Ref 
Yes  104 (1.4)  93 (12.3)    10.00 (7.47–13.37)  1.13 (0.64–1.99) 
Smoker      <0.001     
No  5065 (65.3)  288 (38.8)    Ref  Ref 
Yes  2579 (33.7)  474 (62.2)    3.23 (2.77–3.77)  1.08 (0.84–1.38) 
Problematic alcohol use      <0.001     
No  6460 (84.5)  493 (64.7)    Ref  Ref 
Yes  1184 (15.5)  269 (35.3)    2.98 (2.53–3.49)  1.04 (0.79–1.37) 
Persons who inject drugs      <0.001     
No  7548 (98.7)  384 (50.4)    Ref  Ref 
Yes  96 (1.3)  378 (49.6)    77.40 (60.75–99.48)  45.81 (33.10–64.26) 
Diabetes mellitus      <0.001     
No  7099 (92.9)  748 (98.2)    Ref  Ref 
Yes  545 (7.1)  14 (1.8)    0.24 (0.14–0.40)  0.17 (0.08–0.34) 
Pervious TB treatment      <0.001     
No  7139 (93.4)  630 (82.7)    Ref  Ref 
Yes  505 (6.6)  132 (17.3)    2.96 (2.40–3.64)  1.77 (1.30–2.40) 
Sputum smear and culture      0.029     
Smear positive (+), cell culture (+)  2588 (33.9)  289 (37.9)    Ref  Ref 
Cell culture or PCR (+)  3154 (41.3)  311 (40.8)    0.88 (0.75–1.05)  0.92 (0.72–1.19) 
Negative or not done  1902 (24.9)  162 (21.3)    0.76 (0.62–0.93)  1.06 (0.55–2.13) 
TB location      0.014     
Extrapulmonary TB  2212 (28.9)  185 (24.3)    Ref  Ref 
Pulmonary  5432 (71.1)  577 (75.7)    1.27 (1.07–1.51)  1.26 (0.93–1.72) 
Diagnostic delay in days (median (IQR))  47 (21–99)  35 (18–68)  <0.001     
Chest X-ray      <0.001     
Cavitating  1642 (21.5)  93 (12.2)    Ref  Ref 
Abnormal, not cavitating  4458 (58.3)  503 (66.0)    1.99 (1.59–2.52)  3.07 (2.24–4.27) 
Not done  135 (1.8)  12 (1.6)    1.57 (0.80–2.83)  2.47 (1.03–5.40) 
Normal  1409 (18.4)  154 (20.2)    1.93 (1.48–2.53)  3.59 (2.31–5.63) 
Drug resistance      <0.001     
Negative culture  2146 (28.1)  188 (24.7)    Ref  Ref 
No antibiogram done  601 (7.9)  84 (11.0)    1.60 (1.21–2.09)  1.47 (0.75–3.03) 
Drug-susceptible  4257 (55.7)  409 (53.7)    1.10 (0.92–1.32)  1.18 (0.65–2.31) 
Non-MDR resistance  552 (7.2)  62 (8.1)    1.28 (0.94–1.72)  1.69 (0.85–3.51) 
MDR  88 (1.2)  19 (2.5)    2.46 (1.43–4.05)  1.76 (0.66–4.62) 
Contact tracing      <0.001     
No  2313 (30.3)  388 (50.9)    Ref  Ref 
Yes  5331 (69.7)  374 (49.1)    0.42 (0.36–0.49)  0.51 (0.40–0.64) 
Homeless      <0.001     
No  7154 (93.6)  607 (79.7)    Ref  Ref 
Yes  490 (6.4)  155 (20.3)    3.73 (3.05–4.54)  0.93 (0.64–1.33) 
Unsuccessful TB treatment      <0.001     
No  6716 (87.9)  581 (76.2)    Ref  – 
Yes  928 (12.1)  181 (23.8)    2.25 (1.88–2.70)  – 
Final conclusion      <0.001     
Cured  6716 (87.9)  581 (76.2)    Ref  Ref 
Dead  503 (6.6)  98 (12.9)    2.25 (1.78–2.83)  2.67 (1.81–3.89) 
Lost  210 (2.7)  44 (5.8)    2.42 (1.71–3.36)  1.79 (1.11–2.82) 
Emigrated/others  215 (2.8)  39 (5.1)    2.10 (1.46–2.95)  1.47 (0.84–2.46) 
Directly observed treatment (DOT)      <0.001     
No  6127 (80.2)  397 (52.1)    Ref  Ref 
Yes  1517 (19.8)  365 (47.9)    3.71 (3.19–4.33)  2.20 (1.71–2.81) 
*

p-Values for differences between these two groups were tested using χ2 and Wilcoxon test for median of days of diagnostic delay.

Odds ratios (OR) were obtained with logistic regression.

In the multivariate model adjusted by all the considered variables, the OR of unsuccessful TB treatment in PLHIV was 2.25 times (95% CI: 1.88–2.70) the odds of that of a person without HIV infection. According to our adjusted model, PLHIV had higher odds of being using injected drugs (aOR=45.81; 95% CI (33.10–64.26)), had previously been treated for TB (aOR=1.77; 95% CI (1.30–2.40)) and lower odds of having contact tracing done (aOR=0.51; 95% CI (0.40–0.64)) and having diabetes (aOR=0.17; 95% CI (0.08–0.34)).

Table 2 shows the optimized multivariate model for the subsample of PLHIV. Among them, those who used injected drugs had higher rates of unsuccessful treatment, OR=1.56 (95% CI: 1.11–2.19), as well as those who were homeless OR=1.61 (95% CI: 1.07–2.42). On the other hand, cases for which contact tracing was conducted, had lower rates of unsuccessful treatment (OR: 0.53; 95% CI: 0.37–0.75).

Table 2.

Differences in treatment success among PLHVI according to base characteristics in Barcelona, Spain (2000–2021).

  PLVIH successful treatment(n (%))  PLVIH unsuccessful treatment(n (%))  p-Value*  Crude OR unsuccessful treatment PLHIV  aOR¥ unsuccessful treatment PLHIV 
n  581  181       
Sex      0.611     
Women  128 (22.0)  36 (19.9)    Ref  Ref 
Men  453 (78.0)  145 (80.1)    1.14 (0.76–1.74)  0.99 (0.65–1.53) 
Age      0.010     
<24  9 (1.5)  8 (4.4)    Ref  Ref 
25–64  557 (95.9)  163 (90.1)    0.33 (0.12–0.89)  0.37 (0.14–1.03) 
65 and over  15 (2.6)  10 (5.5)    0.75 (0.21–2.62)  1.17 (0.32–4.28) 
Country of birth      0.683     
Spain  365 (62.9)  110 (60.8)    Ref  – 
Foreigner  216 (37.1)  71 (39.2)    0.92 (0.65–1.29)  – 
Income level      0.841     
Low  212 (39.2)  63 (39.9)    Ref  – 
Medium-low  151 (27.9)  45 (28.5)    1.00 (0.65–1.55)  – 
Medium-high  121 (22.3)  37 (23.4)    1.03 (0.64–1.63)  – 
High  58 (10.7)  13 (8.2)    0.75 (0.37–1.43)  – 
Has been/is in prison      0.641     
No  501 (87.3)  161 (89.0)    Ref  – 
Yes  73 (12.7)  20 (11.0)    0.85 (0.49–1.42)  – 
Smoker      1.000     
No  220 (37.9)  68 (37.6)    Ref  – 
Yes  361 (62.1)  113 (62.4)    1.01 (0.72–1.43)  – 
Problematic alcohol use      0.521     
No  380 (65.4)  113 (62.4)    Ref  – 
Yes  201 (34.6)  68 (37.6)    1.14 (0.80–1.60)  – 
Person who inject drugs      0.012     
No  308 (53.0)  76 (42.0)    Ref  Ref 
Yes  273 (47.0)  105 (58.0)    1.56 (1.11–2.19)  1.54 (1.07–2.21) 
DM      1.000     
No  570 (98.1)  178 (98.3)    Ref  – 
Yes  11 (1.9)  3 (1.7)    0.87 (0.20–2.83)  – 
Previous TB treatment      0.848     
No  479 (82.4)  102 (83.4)    Ref  – 
Yes  102 (17.6)  30 (16.6)    0.93 (0.59–1.44)  – 
TB location      0.094     
Extrapulmonary  150 (25.8)  35 (19.3)    Ref  – 
Pulmonary  431 (74.2)  146 (80.7)    1.45 (0.97–2.22)  – 
Sputum smear and culture      0.931     
Smear+ & culture +  220 (37.9)  69 (38.1)    Ref  – 
Culture or pcr+  239 (41.1)  72 (39.8)    0.96 (0.66–1.40)  – 
Negative or not conducted  122 (21.0)  40 (22.1)    1.05 (0.66–1.63)  – 
Diagnostic delay in days (median (IQR))*Wilcoxon test  36.0 (19.5–67.0)  33.5 (16.0–69.7)  0.4004    – 
Chest X-ray      0.654     
Cavitated  72 (12.4)  21 (11.6)    Ref  – 
Abnormal no cavitated  377 (64.9)  126 (69.6)    1.15 (0.69–1.98)  – 
Not performed  10 (1.7)  2 (1.1)    0.69 (0.10–2.87)  – 
Normal  122 (21.0)  32 (17.7)    0.90 (0.48–1.69)  – 
Drug resistance      0.850     
Negative culture  142 (24.4)  46 (25.4)    Ref  – 
Not performed  62 (10.7)  22 (12.2)    1.10 (0.60–1.96)  – 
Multisensible  318 (54.7)  91 (50.3)    0.88 (0.59–1.33)  – 
Resistance not MDR  45 (7.7)  17 (9.4)    1.17 (0.60–2.21)  – 
MDR  14 (2.4)  5 (2.8)    1.10 (0.34–3.06)  – 
Contact tracing      <0.001     
No  272 (46.8)  116 (64.1)    Ref  Ref 
Yes  309 (53.2)  65 (35.9)    0.49 (0.35–0.69)  0.53 (0.37–0.75) 
Homeless      0.001     
No  479 (82.4)  102 (70.7)    Ref  Ref 
Yes  102 (17.6)  53 (29.3)    1.94 (1.32–2.85)  1.61 (1.07–2.42) 
Final conclusion      <0.001     
Successful treatment  581 (100.0)  0 (0.0)    –  – 
Death  0 (0.0)  98 (54.1)    –  – 
Lost  0 (0.0)  44 (24.3)    –  – 
Emigrated/others  0 (0.0)  39 (21.5)    –  – 
Directly observed treatment (DOT)      1.000     
No  303 (52.2)  94 (51.9)    Ref  – 
Yes  278 (47.8)  87 (48.1)    1.01 (0.72–1.41)  – 
*

p-Values for differences between these two groups were tested using χ2 and Wilcoxon test for median of days of diagnostic delay.

¥

Adjusted odds ratios (aOR) of unsuccessful treatment were obtained with logistic regressions. The level of statistical significance was set to α=0.05. Only variables that showed statistical significance in the bivariate models and were of epidemiological interest for the adjustment were considered for the multivariate analyses (age, sex, person who injects drugs, contact tracing and homelessness).

Discussion

Overall, the characteristics of PLHIV and TB co-infection population in Barcelona are very similar to the ones reported by WHO.1 Men are usually more affected by TB mainly because of a higher exposure to settings that favor transmission as well as their engagement in hazardous careers.14

In our population, HIV prevalence in newly diagnosed TB cases decreased almost 10 percentage points during the study period. This is consistent with available evidence, which has shown a global decrease on HIV and TB co-infection, mainly due to changes in the clinical management and treatment of PLHIV such as immediate ART treatment.15 Global strategies addressing HIV and TB simultaneously have also played a role in co-infection reduction.16

As opposed to the trend registered for the European Region, where HIV-positive TB diagnoses have increased since the year 2000,2 HIV-positive TB incident cases in Barcelona in 2021 followed a decreasing trend and were slightly lower to the incidence found globally (6.7%).1

Out of all TB cases diagnosed, we identified several factors related to a higher association with having HIV co-infection. PLHIV were more often men, between the age of 25–64 and Spanish-born. Similar results regarding gender where recently found in Brazil,17 but they found no significant differences among age groups, which may indicate different epidemiological patterns of TB and HIV between both populations. PLHIV were also more frequently injected drug users. Moreover, injected drug users have previously been identified as a risk group for HIV and TB co-infection in other European settings such as Bucharest, Romania, where the epidemiological situation is similar than observed in Barcelona in the nineties.18 On the other hand, PLHIV were less likely to be diabetic. Although HIV is known to increase the risk of developing diabetes,9 it is mostly due to the iatrogenic effects of HAART therapy.19 PLHIV in our population may be underdiagnosed in comparison with the rest of tuberculosis patients. We hypothesized that PLHIV in our population do not access the healthcare system due to their social conditions, hindering the diagnosis of chronic metabolic diseases like diabetes. Diabetes could also be considered as a side effect of the treatment, hindering its correct characterization.

When comparing TB management, PLHIV had more often been previously treated for TB, and had more often treatment under DOT. Contact tracing, was significantly lower for these patients, as well as treatment success. All these characteristics show how HIV co-infection patients tend to have more complex clinical management and require special attention during treatment follow-up and epidemiologic surveillance, hence the higher likeness of DOT.

Treatment success rates among TB patients, both HIV+ and HIV− were found to be similar to those reported globally, and even slightly higher among HIV− individuals in Barcelona.6 Still, overall treatment success was under the 90% WHO goal for 2025.20

The higher TB unsuccessful treatment among PLHIV could be explained by the fact that the mortality rate is higher among HIV-positive patients,6,21–26 probably due to AIDS as TB in these patients tends to be more aggressive,27 and lost and emigrated cases almost double the rates of those without HIV, hindering treatment completion. As for TB treatment drug resistance, we did not find any statistically significant differences for treatment failure according to resistances in PLHIV, contrary to what previous studies have shown.28

In our population of PLHIV, cases with contact tracing performed were significantly less likely to have unsuccessful treatment. Our hypothesis is that the collaborative effort to provide contacts’ personal data could be extensive to a higher willingness to follow treatment instructions. Similar results to ours were found recently in Uganda.29 On the other hand, higher willingness and resources to perform contact tracing by healthcare professionals could indirectly imply more exhaustive treatment follow-up. Contrarily, homelessness and use of injected drugs were directly associated with unsuccessful treatment among PLHIV, highlighting how socioeconomic and housing instability can hinder treatment success. A recent review linked lower treatment adherence to barriers for access to healthcare, including stigma and dehumanization of homeless people.30 Directly observed treatment programs and collaboration with care centers for substance abuse could be helpful in reducing these barriers and increase adherence.

Our study had some limitations. We could not obtain data on HIV transmission route. We are aware that the transmission route and other HIV-related variables, like CD4 count at diagnosis and initiation of HAART therapy, could shed new light towards factors related to TB treatment success or not. The observational transversal study design did not allow exploring causality or changes over time. Nevertheless, our exhaustive data records and sample size allowed us to assess factors associated to HIV and treatment success among all TB cases in the city for over 20 years, giving our results high robustness that may be transferable to similar settings. Moreover, from an epidemiological surveillance and control framework, our research aims to identify easily collectable sociodemographic characteristics that can inform us on the probability of unsuccessful treatment, making the best use of the available resources (DOT, inpatient treatment).

Finally, it should be taken into consideration that the last 2 years of our analyses (2020–2021) were affected by the COVID-19 pandemic. Although this had a great impact in late notification of cases, by the end of 2020, TB cases reported matched those expected according to historic tendencies in the city, and although it is possible that treatment success rates changed during this period, cases from these years only represent 5.7% of our population, so it could hardly affect our general results.

Conclusions

Despite the decrease of proportion of TB/HIV co-infection in our setting, TB treatment success is still lower for PLHIV. This could be related to higher mortality and loss of follow-up among these patients. PLHIV were more likely to successfully complete TB treatment when they had contact tracing. On the other hand, injected drugs use and being homeless were associated to lower treatment success among this population. Further efforts and resources are needed to improve treatment success in PLHIV with TB, including an interdisciplinary approach beyond healthcare systems and intensive follow-up.

CRediT authorship contribution statement

All authors made significant contributions to the study and reviewed and approved the final version of the paper. No other person made a substantial contribution to the paper. JPM, GB, IM and AO contributed to study concept and design. GB and IM composed the statistical dataset and performed the analyses. GB, IM, JPM, AO and CP contributed to the interpretation of the data and results.

Funding

This research did not receive any specific grant from funding agencies in the public commercial, or not-for-profit sectors.

Conflict of interest

The authors declare no conflicts of interest.

References
[1]
Global tuberculosis report 2023.
World Health Organization, (2023),
[2]
European Centre for Disease Prevention and Control, WHO Regional Office for Europe.
Tuberculosis surveillance and monitoring in Europe 2023–2021 data.
European Centre for Disease Prevention and Control and Copenhagen: WHO Regional Office for Europe, (2023),
[3]
W.L. Roper, M.A. Hamburg, D.K. King Holmes, W. Deborah Holtzman, G.K. John Iglehart, D.G. Maki, et al.
Revised surveillance case definitions for HIV infection among adults, adolescents, and children aged <18 months and for HIV infection and aids among children aged 18 months to <13 years – United States, 2008.
MMWR Recomm Rep, 57 (2008), pp. 1-8
[4]
Tuberculosis. World Health Organization [Internet]. Available from: https://www.who.int/en/news-room/fact-sheets/detail/tuberculosis [cited 18 March 2024].
[5]
C.L. Edge, E.J. King, K. Dolan, M. McKee.
Prisoners co-infected with tuberculosis and HIV: a systematic review.
J Int AIDS Soc, 19 (2016),
[6]
N.M. Chaves Torres, J.J. Quijano Rodríguez, P.S. Porras Andrade, M.B. Arriaga, E.M. Netto.
Factors predictive of the success of tuberculosis treatment: a systematic review with meta-analysis.
[7]
A. Wodak, L. McLeod.
The role of harm reduction in controlling HIV among injecting drug users.
[8]
O. Parés-Badell, G. Barbaglia, N. Robinowitz, X. Majó, M. Torrens, A. Espelt, et al.
Integration of harm reduction and treatment into care centres for substance use: the Barcelona model.
Int J Drug Policy, 76 (2020), pp. 102614
[9]
L. González Fernández, E.C. Casas, S. Singh, G.J. Churchyard, G. Brigden, E. Gotuzzo, et al.
New opportunities in tuberculosis prevention: implications for people living with HIV.
J Int AIDS Soc, 23 (2020), pp. e25438
[10]
Q. Yang, J. Han, J. Shen, X. Peng, L. Zhou, X. Yin.
Diagnosis and treatment of tuberculosis in adults with HIV.
Medicine, 101 (2022), pp. E30405
[11]
J.M. Reyes-Urueña, C.N.J. Campbell, N. Vives, A. Esteve, J. Ambrosioni, C. Tural, et al.
Estimating the HIV undiagnosed population in Catalonia, Spain: descriptive and comparative data analysis to identify differences in MSM stratified by migrant and Spanish-born population.
[12]
Tuberculosis (TB) (Mycobacterium tuberculosis) 2009 Case Definition|CDC [Internet]. Available from: https://ndc.services.cdc.gov/case-definitions/tuberculosis-2009/ [cited 21 June 2024].
[13]
Tuberculosis treatment success rate. World Health Organization [Internet]. Available from: https://www.who.int/data/gho/indicator-metadata-registry/imr-details/4462 [cited 2 April 2024].
[14]
S. Nhamoyebonde, A. Leslie.
Biological differences between the sexes and susceptibility to tuberculosis.
J Infect Dis, 209 (2014), pp. S100-S106
[15]
A. Sullivan, R.R. Nathavitharana.
Addressing TB-related mortality in adults living with HIV: a review of the challenges and potential solutions.
Ther Adv Infect Dis, 9 (2022),
[16]
Y. Hamada, H. Getahun, B.T. Tadesse, N. Ford.
HIV-associated tuberculosis.
Int J STD AIDS, 32 (2021), pp. 780-790
[17]
L.F. Siqueira Santos, P.H. Vilarino Carneiro, M.A.A. de Oliveira Serra, L.H. dos Santos, H.L.P. de Andrade, L.M. Pascoal, et al.
Tuberculosis/HIV co-infection in Northeastern Brazil: prevalence trends, spatial distribution, and associated factors.
J Infect Dev Ctries, 16 (2022), pp. 1490-1499
[18]
M. Ţigǎu, A.M. Zaharie.
Peculiarities of persons who inject drugs among patients with HIV-tuberculosis coinfection registered in 4th District TB Unit Bucharest during 2009–2018.
Pneumologia, 70 (2021), pp. 10-16
[19]
S. Kalra, B. Kalra, N. Agrawal, A. Unnikrishnan.
Understanding diabetes in patients with HIV/AIDS.
Diabetol Metab Syndr, 3 (2011), pp. 2
[20]
World Health Organization.
Implementing the end TB strategy: the essentials, 2022 update.
World Health Education [Internet], (2022),
[21]
E.A. Tanue, D.S. Nsagha, T.N. Njamen, N.J. Clement Assob.
Tuberculosis treatment outcome and its associated factors among people living with HIV and AIDS in Fako Division of Cameroon.
[22]
S. Mahtab, D. Coetzee.
Influence of HIV and other risk factors on tuberculosis.
S Afr Med J, 107 (2017), pp. 428-434
[23]
M. Belayneh, K. Giday, H. Lemma.
Treatment outcome of human immunodeficiency virus and tuberculosis co-infected patients in public hospitals of eastern and southern zone of Tigray region, Ethiopia.
Braz J Infect Dis, 19 (2015), pp. 47-51
[24]
N.N. Ambadekar, S.P. Zodpey, R.N. Soni, S.P. Lanjewar.
Treatment outcome and its attributes in TB-HIV co-infected patients registered under Revised National TB Control Program: a retrospective cohort analysis.
Public Health, 129 (2015), pp. 783-789
[25]
A.A. Agbor, J.J.R. Bigna, S.C. Billong, M.C. Tejiokem, G.L. Ekali, C.S. Plottel, et al.
Factors associated with death during tuberculosis treatment of patients co-infected with HIV at the Yaoundé Central Hospital, Cameroon: an 8-year hospital-based retrospective cohort study (2006–2013).
[26]
E.P. Budgell, D. Evans, K. Schnippel, P. Ive, L. Long, S. Rosen.
Outcomes of treatment of drug-susceptible tuberculosis at public sector primary healthcare clinics in Johannesburg, South Africa: a retrospective cohort study.
S Afr Med J, 106 (2016), pp. 1002-1009
[27]
C. Kwan, J.D. Ernst.
HIV and tuberculosis: a deadly human syndemic.
Clin Microbiol Rev, 24 (2011), pp. 351-376
[28]
M.J. Van Der Werf, C. Ködmön, P. Zucs, V. Hollo, A.J. Amato-Gauci, A. Pharris.
Tuberculosis and HIV coinfection in Europe: looking at one reality from two angles.
[29]
J. Baruch Baluku, R.A. Kabamooli, N. Kajumba, M. Nabwana, D. Kateete, S. Kiguli, et al.
Contact tracing is associated with treatment success of index tuberculosis cases in Uganda.
Int J Infect Dis, 109 (2021), pp. 129-136
[30]
J.R. Gioseffi, R. Batista, S.M. Brignol.
Tuberculose, vulnerabilidades e HIV em pessoas em situação de rua: revisão sistemática.
Rev Saude Publica, 56 (2022), pp. 43
Copyright © 2025. Sociedad Española de Enfermedades Infecciosas y Microbiología Clínica
Article options
Tools