


We present the largest study conducted in Galicia on the prevalence and distribution of HCV genotypes/subtypes.
MethodsRetrospective study collecting the total number of patients chronically infected by HCV between 2000.01.01 to 2015.12.31 in 3 of the main health areas: Santiago, Pontevedra and Vigo.
ResultsWe collected a total of 4469 patients. The median age was 50 years (IQR 57–45), 72.3% were men, 0.4% were coinfected with another genotype, 20.6% were coinfected with HIV and 35.2% with HBV. The main route of transmission was parenteral (83.1%), followed by unknown (15.3%), sexual (1.4%) and vertical (0.2%). The distribution of genotypes was: 62.9% HCV-1 (29.2% HCV-1a and 31.9% HCV-1b), 3.4% HCV-2, 21.0% HCV-3, 12.6% HCV-4 and 0.1% HCV-5.
ConclusionThe distribution of genotypes in Galicia shows significant differences with respect to that observed in Spain. This distribution varies with age, gender, coinfection with HIV and/or HBV, and within geographical areas.
Presentamos el mayor estudio realizado en Galicia sobre prevalencia y distribución de genotipos/subtipos del VHC.
MétodosEstudio retrospectivo recopilando al total de pacientes crónicamente infectados por VHC entre el 1 de enero del 2000 y el 31 de diciembre del 2015 en 3 de las principales áreas sanitarias: Santiago, Pontevedra y Vigo. Recogimos datos sobre prevalencia y distribución de genotipos/subtipos, vías de transmisión, género, edad y coinfección con VIH/VHB.
ResultadosReclutamos a 4.469 pacientes, con una mediana de edad 50 años (RIC 57-45), el 72,3% hombres, el 0,4% coinfectado con otro genotipo, el 20,6% coinfectado con VIH y un 35,2% con VHB. Transmisión parenteral (83,1%), desconocida (15,3%), sexual (1,4%) y vertical (0,2%). Distribución de genotipos: 62,9% VHC-1 (29,2% VHC-1a y 31,9% VHC-1b), 3,4% VHC-2, 21,0% VHC-3, 12,6% VHC-4 y 0,1% VHC-5.
ConclusiónLa distribución de genotipos muestra diferencias significativas respecto a la observada en España. Dicha distribución varía con la edad, el género, la coinfección con VIH o VHB, y dentro de áreas geográficas.
HCV can be classified by phylogenetic methods into seven main genotypes and a large variety of subtypes, which show different geographic distribution patterns.1,2 The epidemic of HCV infection is constantly evolving and the epidemiological parameters identified in Galicia over a decade ago are no longer of use.3,4
MethodsDesign and characteristicsThis was a retrospective multicentre study compiling the total number of patients chronically infected by HCV diagnosed between 1 January 2000 and 31 December 2015 in the Santiago, Pontevedra and Vigo health board areas (HBA). Epidemiological and clinical data were obtained, maintaining confidentiality and anonymity according to the indications and requirements of the respective Independent Ethics Committees. Demographic, clinical and virological data were collected: genotype/subtype, gender, age, locality, route of transmission and co-infection with HBV or HIV. To determine the prevalence of the phylogenetic variants of genotype 1a, as well as the presence of the Q80K polymorphism, 73 patients with this genotype were randomly selected and the NS35 region was sequenced, analysing it later in geno2phenoHCV.
Statistical analysisThe chi-square test (χ2) was used to study the effect of each HCV genotype/subtype on the different qualitative variables. For the quantitative variables, the Kolmogorov–Smirnov test was used to determine whether or not the distribution was normal, after which, Student's t-test or the Mann–Whitney U test, respectively, were applied. In all cases, a p value <0.05 was considered statistically significant. All the analyses were performed using SPSS v20.0 (IBM Corp. Armonk Released 2012. IBM SPSS Statistics for Windows, Version 20.0. Armonk, NY: IBM Corp.).
ResultsThe results correspond to the period 2000–2015 and belong to 4469 unselected patients chronically infected with HCV.
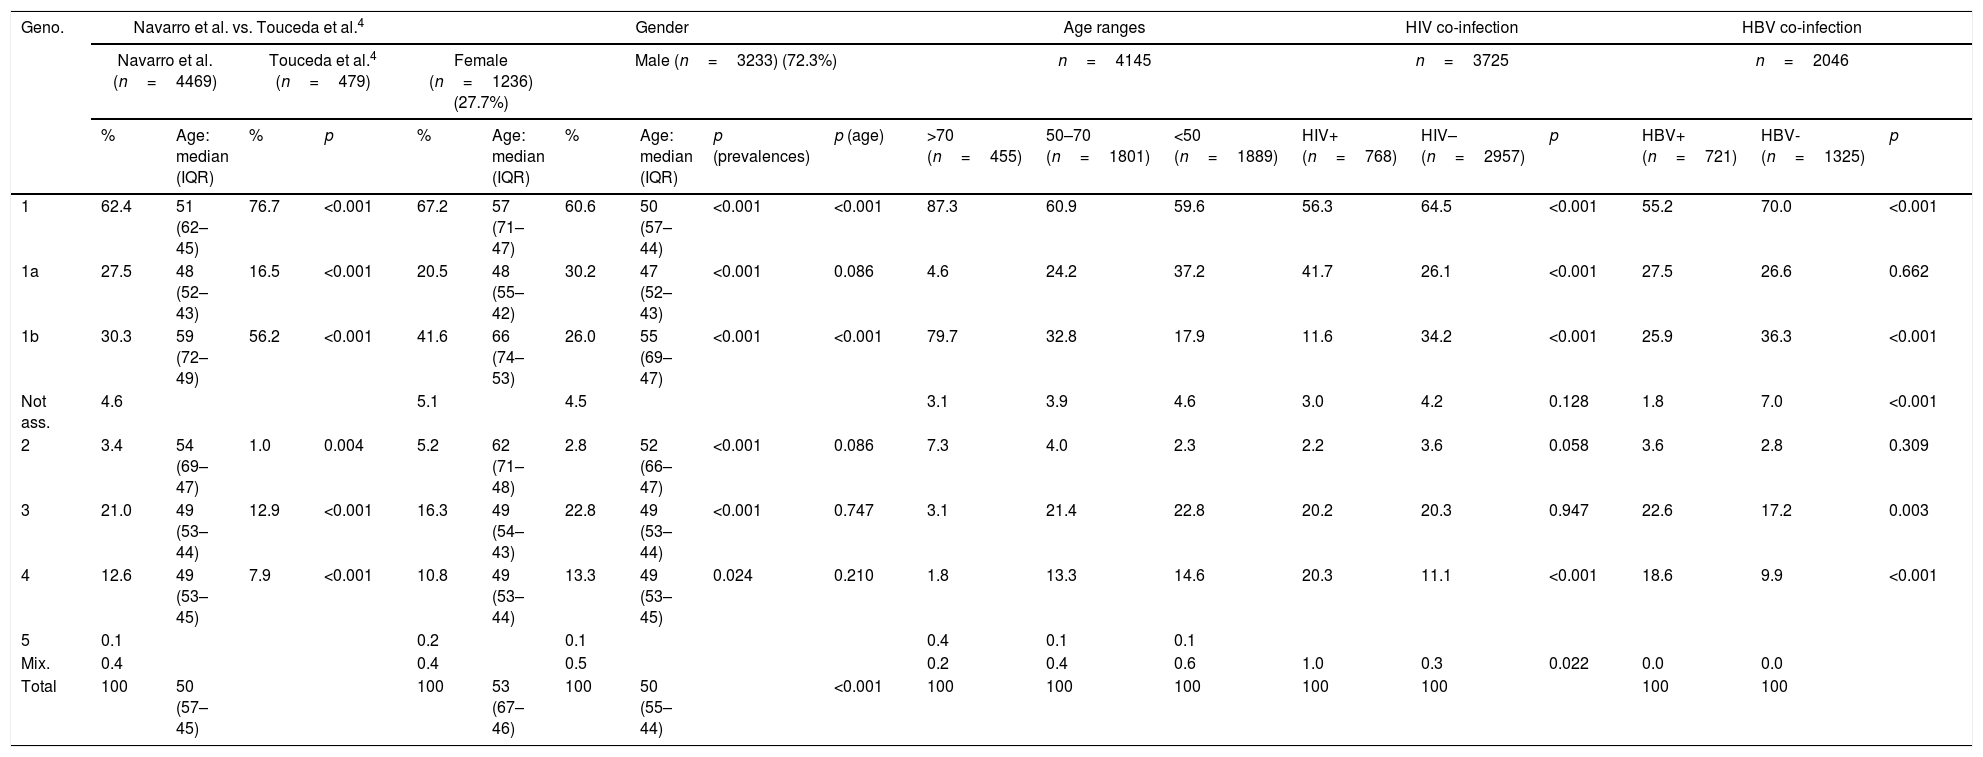
Table 1 shows the distribution of genotypes/subtypes in the total population of our study, as well as their comparison with the work of Touceda et al.4 the distribution in terms of gender, age and groups of co-infection with HBV or HIV is also shown.
Distribution of genotypes in the total population, in different subgroups and comparison with the study conducted by Touceda et al.4
| Geno. | Navarro et al. vs. Touceda et al.4 | Gender | Age ranges | HIV co-infection | HBV co-infection | ||||||||||||||
|---|---|---|---|---|---|---|---|---|---|---|---|---|---|---|---|---|---|---|---|
| Navarro et al. (n=4469) | Touceda et al.4 (n=479) | Female (n=1236) (27.7%) | Male (n=3233) (72.3%) | n=4145 | n=3725 | n=2046 | |||||||||||||
| % | Age: median (IQR) | % | p | % | Age: median (IQR) | % | Age: median (IQR) | p (prevalences) | p (age) | >70 (n=455) | 50–70 (n=1801) | <50 (n=1889) | HIV+ (n=768) | HIV– (n=2957) | p | HBV+ (n=721) | HBV- (n=1325) | p | |
| 1 | 62.4 | 51 (62–45) | 76.7 | <0.001 | 67.2 | 57 (71–47) | 60.6 | 50 (57–44) | <0.001 | <0.001 | 87.3 | 60.9 | 59.6 | 56.3 | 64.5 | <0.001 | 55.2 | 70.0 | <0.001 |
| 1a | 27.5 | 48 (52–43) | 16.5 | <0.001 | 20.5 | 48 (55–42) | 30.2 | 47 (52–43) | <0.001 | 0.086 | 4.6 | 24.2 | 37.2 | 41.7 | 26.1 | <0.001 | 27.5 | 26.6 | 0.662 |
| 1b | 30.3 | 59 (72–49) | 56.2 | <0.001 | 41.6 | 66 (74–53) | 26.0 | 55 (69–47) | <0.001 | <0.001 | 79.7 | 32.8 | 17.9 | 11.6 | 34.2 | <0.001 | 25.9 | 36.3 | <0.001 |
| Not ass. | 4.6 | 5.1 | 4.5 | 3.1 | 3.9 | 4.6 | 3.0 | 4.2 | 0.128 | 1.8 | 7.0 | <0.001 | |||||||
| 2 | 3.4 | 54 (69–47) | 1.0 | 0.004 | 5.2 | 62 (71–48) | 2.8 | 52 (66–47) | <0.001 | 0.086 | 7.3 | 4.0 | 2.3 | 2.2 | 3.6 | 0.058 | 3.6 | 2.8 | 0.309 |
| 3 | 21.0 | 49 (53–44) | 12.9 | <0.001 | 16.3 | 49 (54–43) | 22.8 | 49 (53–44) | <0.001 | 0.747 | 3.1 | 21.4 | 22.8 | 20.2 | 20.3 | 0.947 | 22.6 | 17.2 | 0.003 |
| 4 | 12.6 | 49 (53–45) | 7.9 | <0.001 | 10.8 | 49 (53–44) | 13.3 | 49 (53–45) | 0.024 | 0.210 | 1.8 | 13.3 | 14.6 | 20.3 | 11.1 | <0.001 | 18.6 | 9.9 | <0.001 |
| 5 | 0.1 | 0.2 | 0.1 | 0.4 | 0.1 | 0.1 | |||||||||||||
| Mix. | 0.4 | 0.4 | 0.5 | 0.2 | 0.4 | 0.6 | 1.0 | 0.3 | 0.022 | 0.0 | 0.0 | ||||||||
| Total | 100 | 50 (57–45) | 100 | 53 (67–46) | 100 | 50 (55–44) | <0.001 | 100 | 100 | 100 | 100 | 100 | 100 | 100 | |||||
Genotype distribution in percentage.
Geno.: genotypes; HBV: hepatitis B virus; HIV: human immunodeficiency virus; IQR: interquartile range; Mix.: mixed infections; Not ass.: genotype 1 not subtyped; p: p-value.
Within 1a, clade II was the most prevalent (69.9%), but no cases of the Q80K polymorphism were detected. In contrast, the Q80K polymorphism was found in 18.2% of clade I.
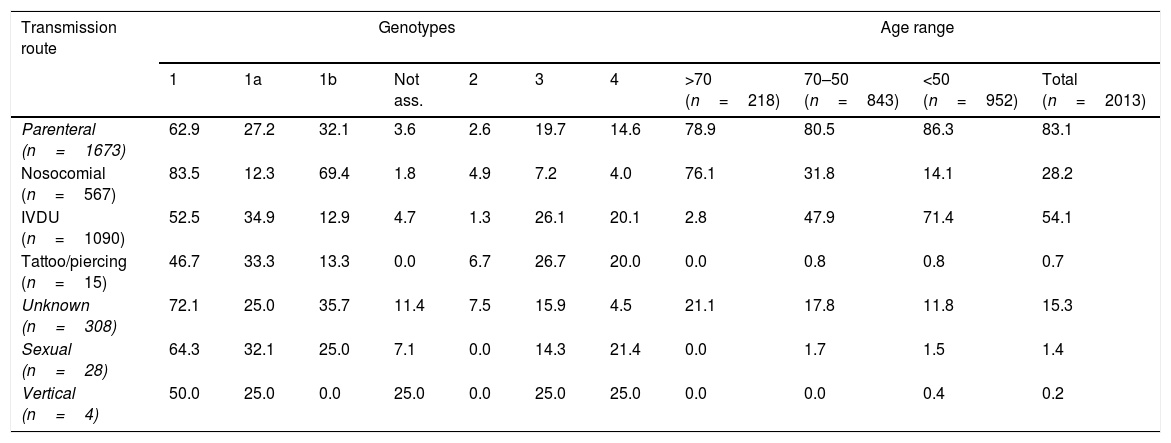
Table 2 shows the main transmission routes and their association with the different genotypes/subtypes, and their distribution in the different age ranges.
Distribution of the main HCV genotypes in each transmission route and age range.
| Transmission route | Genotypes | Age range | |||||||||
|---|---|---|---|---|---|---|---|---|---|---|---|
| 1 | 1a | 1b | Not ass. | 2 | 3 | 4 | >70 (n=218) | 70–50 (n=843) | <50 (n=952) | Total (n=2013) | |
| Parenteral (n=1673) | 62.9 | 27.2 | 32.1 | 3.6 | 2.6 | 19.7 | 14.6 | 78.9 | 80.5 | 86.3 | 83.1 |
| Nosocomial (n=567) | 83.5 | 12.3 | 69.4 | 1.8 | 4.9 | 7.2 | 4.0 | 76.1 | 31.8 | 14.1 | 28.2 |
| IVDU (n=1090) | 52.5 | 34.9 | 12.9 | 4.7 | 1.3 | 26.1 | 20.1 | 2.8 | 47.9 | 71.4 | 54.1 |
| Tattoo/piercing (n=15) | 46.7 | 33.3 | 13.3 | 0.0 | 6.7 | 26.7 | 20.0 | 0.0 | 0.8 | 0.8 | 0.7 |
| Unknown (n=308) | 72.1 | 25.0 | 35.7 | 11.4 | 7.5 | 15.9 | 4.5 | 21.1 | 17.8 | 11.8 | 15.3 |
| Sexual (n=28) | 64.3 | 32.1 | 25.0 | 7.1 | 0.0 | 14.3 | 21.4 | 0.0 | 1.7 | 1.5 | 1.4 |
| Vertical (n=4) | 50.0 | 25.0 | 0.0 | 25.0 | 0.0 | 25.0 | 25.0 | 0.0 | 0.0 | 0.4 | 0.2 |
Genotype distribution in percentage.
IVDU: intravenous drug user; Not ass.: genotype 1 not subtyped.
We found different distribution patterns for the HCV genotypes among the different HBAs. Genotype 1 is the most prevalent overall, while 1b and 4 are more common in Santiago, 1a and 2 in Vigo and 3 in Pontevedra, where it is the second most common.
The most frequently used genotyping method was Siemens reverse hybridisation (LiPA) (94.7%) followed by Roche linear arrays (5.2%) and sequencing (0.2%).
DiscussionGenotype distribution is known to be associated with gender, age and transmission routes in particular: 1b and 2 are linked to blood transfusions and unsafe medical procedures, while 1a, 3 and 4 are mainly associated with IVDU.6,7
The distribution found is similar to that observed in recent studies carried out in Spain.8 However, there are some variations resulting from the constant evolving of the epidemiological patterns of HCV, and this makes it important to study the epidemiology of this virus at a local/regional level. Patients infected by genotype 1 (62.4%), mainly 1b (30.3%), form the largest group, although it is significantly less common than in the rest of Spain.8 In contrast, the genotypes associated with IVDU are significantly more prevalent: 1a (27.6%), 3 (21.0%) and 4 (12.6%). This confirms that in Galicia, as in Spain and other European countries, genotypes 1 and 3 are the most commonly detected among the general population.8,9
Regarding the distribution of clades within genotype 1a, at 69.9%, ii is the most prevalent, lower than the 76.4% reported in the rest of Spain.10 With respect to the Q80K polymorphism, which in Spain has been observed in 42.0% of clade I and in 1.8% of clade II,10 we only detected it in 18.2% of clade i. The lower prevalence of clade i and the Q80K polymorphism in our region leads us to consider that the therapies affected by this polymorphism may be a good treatment option for a majority of patients infected by genotype 1a in our region.
In terms of gender, different patterns of genotype distribution are found according to the predominant transmission route in each group. Genotypes 1, 1b and 2 are more prevalent among females, whereas 1a, 3 and 4 are strongly associated with IVDU and predominantly in males. In terms of patient age, as has also been described in other studies8, the prevalence trend of 1 (1b and 1a), 3 and 4 is age-dependent, directly proportional in 1 and 1b, and inversely proportional in the rest. In line with these findings, we found differences in the median age of the patients infected with the different genotypes, where 1a and 1b showed the lowest and highest median age for males and females, respectively. The same differences were more marked when we compared males and females with 1b and 2. However, these differences were not found in 4 and, surprisingly, unlike in Spain,8 were also not found in 1a and 3.
Our data on the distribution of genotypes by age groups show that 1b is the most prevalent (79.7%) in individuals born before 1945, while 1a, 3 and 4 increase significantly in people born after 1945. This coincides with what was already known from other studies carried out in Europe and Spain.6–8
Regarding transmission routes, unlike similar studies in Spain8,11 and Galicia,3,4 where the main route of transmission was unknown, in our study it was parenteral (83.1%). As expected, 1b and 2 are associated with nosocomial and unknown transmission. In parenteral transmission, 1b and 1a were the most commonly identified. Unlike other studies conducted in Western Europe, in which genotype 3 is most common in both the general population and in infection associated with IVDU,9 our IVDU patients were infected mainly by 1a. According to these results, it also seems quite likely that the introduction of genotype 4 in Galicia, as in Europe and the USA, was related to IVDU and occurred from the 1980s onwards,12 a decade after 1a and 3.13 This would explain the greater association of genotype 4 with females, unlike 1a and 3, as its arrival (linked to IVDU) coincided with greater incorporation of females into this risk factor.14
Co-infections with HBV or HIV showed that the patterns and prevalences are similar, except for genotype 1, where 1a predominates over 1b in individuals co-infected with HIV and, unlike Spain as a whole, also in those co-infected with HBV.8 In individuals co-infected with HIV, the second most prevalent genotype is 4, this being the genotype most significantly associated with HIV co-infection. The distribution of genotypes in patients co-infected with HIV was similar to that in IVDU and we confirmed that patients co-infected with HIV are mainly predominant among IVDU15 there was also a significantly higher prevalence of co-infection with different HCV genotypes among these individuals. Surprisingly, unlike in Spain as a whole,8,11 we did not find an association between genotype 3 and HIV co-infection, although there was a higher prevalence of 4 in those co-infected with HBV.8
This study analysed the geographical distribution of HCV genotypes in three of Galicia's main HBAs. As in other countries in our region, the genotype distribution found in the different zones has ranges of variation, which we believe depend mainly on age and the predominant transmission routes in each HBA.
Apart from the limitations inherent to retrospective studies, other limitations of our study are those related to the genotyping methods used, specifically for the correct determination of subtypes within genotype 1.
The data presented in this paper represent the most complete study to date estimating the relative contribution of each genotype to the epidemic of this virus in Galicia. It also underlines the importance of keeping up-to-date information on the epidemiological characteristics of HCV at a local/regional level.
Conflicts of interestThe authors declare that they have no conflicts of interest.
Please cite this article as: Navarro-de la Cruz D, Pérez-Castro S, Trigo-Daporta M, Aguilera-Guirao A. Prevalencia y distribución de los genotipos del virus de la hepatitis C en Galicia durante el periodo 2000–2015. Enferm Infecc Microbiol Clin. 2019;37:256–259.
