


To evaluate the changes in the susceptibility of Pseudomonas aeruginosa over time (2000–2017) against antimicrobials used in an intensive care unit of a Spanish tertiary hospital, and to compare them with the antimicrobial activity considering theoretical pharmacokinetic/pharmacodynamic (PK/PD) criteria. The influence of the method for handling duplicate isolates to quantify susceptibility rates was also evaluated.
MethodsThe susceptibility was studied considering the Clinical and Laboratory Standards Institute (CLSI) breakpoints. Monte Carlo simulations were conducted to calculate the cumulative fraction of response (CFR). Linear regression analysis was applied to determine the trends in susceptibility and in the CFR.
ResultsA significant decrease in the susceptibility to gentamicin and imipenem was observed, and more recently the highest percentages of susceptible strains were found for amikacin, cephalosporins and piperacillin/tazobactam (>80%). The probability of success of an empiric treatment or CFR for most of the evaluated antimicrobials was lower than 70% during the last two-year period. Only meropenem provided high probabilities (>90%) to achieve the PK/PD target. Cephalosporins provided moderate probabilities (>80%) although for ceftazidime, the highest dose (2g/8h) was required. Moreover, a significant decrease in the CFR trend for ciprofloxacin, imipenem and levofloxacin was observed.
ConclusionsBoth susceptibility rates and CFR values have to be considered together to optimize the antimicrobial dose regimen for clinical making-decisions. They are complementary tools and, they should be used jointly in surveillance programmes. In fact, susceptibility data are not always useful to detect changes in the CFR. No relevant differences were observed among the methods for handling repeated isolates.
Evaluar los cambios en la sensibilidad de Pseudomonas aeruginosa (2000-2017) a los antimicrobianos utilizados en una unidad de cuidados intensivos en España, y compararlos con la actividad antimicrobiana considerando criterios farmacocinéticos/farmacodinámicos (PK/PD) teóricos. También se comparan los diferentes métodos para el manejo de aislados duplicados utilizados para cuantificar la sensibilidad.
MétodosLa sensibilidad se determinó siguiendo los puntos de corte del Clinical and Laboratory Standards Institute (CLSI). Se realizaron simulaciones de Monte Carlo para calcular la fracción de respuesta acumulada (CFR). Se analizó la tendencia en la sensibilidad microbiana y la CFR a lo largo del tiempo mediante regresión lineal.
ResultadosEn el análisis de tendencias se observó un descenso significativo en la sensibilidad a gentamicina e imipenem, y una disminución significativa de la CFR para ciprofloxacino, imipenem y levofloxacino. En los últimos años, amikacina, cefalosporinas y piperacilina/tazobactam presentaron los mayores valores de sensibilidad (>80%). La CFR para la mayoría de los antimicrobianos fue inferior al 70% durante el último periodo estudiado. Solo meropenem proporcionó altas probabilidades (>90%) de alcanzar el objetivo PK/PD. Las cefalosporinas proporcionaron probabilidades moderadas (>80%), siendo necesarias dosis elevadas de ceftazidima (2g/8h).
ConclusionesLos datos de sensibilidad antimicrobiana y los valores de CFR deben considerarse herramientas complementarias y, por tanto, evaluarse conjuntamente tanto en actividades de vigilancia como en la evaluación de la eficacia terapéutica de los regímenes de dosificación. De hecho, los datos de sensibilidad no siempre son útiles para detectar cambios en la CFR. Finalmente, no se observaron diferencias relevantes entre los métodos para el manejo de aislados duplicados empleados.
The Intensive Care Over Nations audit reported that more than one-third of patients developed an infection during their intensive care unit (ICU) stay.1 According to the Extended Prevalence of Infection in Intensive Care (EPIC) II study, 51% of patients in ICUs were considered to be infected, with the group of Gram-negative organisms being the most predominant.2Pseudomonas aeruginosa is one of the Gram-negative pathogens of major clinical and epidemiological importance, notably in ICU patients.3 Antimicrobial treatment of critically ill patients is often complicated because of the development of antimicrobial resistance, even if the microorganisms responsible for the infection are susceptible at the start of treatment. Specifically, the management of infections caused by P. aeruginosa is a challenge because this bacteria has a great ability to become resistant, create biofilms and demonstrate a high level of intrinsic resistance.4 Invasive infections with P. aeruginosa are associated with significant morbidity and mortality. In fact, mortality among individuals with severe P. aeruginosa infections reaches up to 70%.5 This pathogen is also associated with the highest attributable mortality in nosocomial pneumonia (15%, rising to 35% in case of multidrug resistance).6
As a result of the declining effectiveness of existing antibiotics and the steady decrease in new antibiotic development, the optimization of the existing treatments is necessary. Efforts to control resistance include, among others, infection prevention and control practices, prudent use of antimicrobials, and surveillance programmes. Guidelines and recommendations must incorporate the ecology of the hospital setting and the severity of patient illness to provide a personalized approach to antimicrobial treatment in the future.7 In this regard, regular epidemiologic surveillance programmes have an important role to guide the clinician towards appropriate empiric treatments.
Antimicrobial stewardship programmes aim to provide assistance for optimal choice of drug, dosage and duration of treatment in order to reduce costs, adverse events and development of resistance. Pharmacokinetic/pharmacodynamic (PK/PD) analysis and Monte Carlo simulations have played roles for selecting appropriate antibiotic dosages with the goal of increasing treatment efficacy and reducing the risk of selecting multidrug-resistant pathogens.8 Zelenitsky et al. evaluated the activity of antibiotics used to treat critically ill patients against P. aeruginosa over time. They concluded that the simple assessment of the susceptibility profile is useful but it is not enough to detect changes in the overall activities of antimicrobial agents,9 which shows the need of additional methods such as PK/PD analysis.
The main objective of the present study was to evaluate the changes in the susceptibility of antimicrobials used against P. aeruginosa over time in an ICU of a tertiary hospital in Spain from 2000 to 2017, and to compare them with the changes in the antimicrobial activity by applying a theoretical PK/PD analysis. A secondary objective was to evaluate these results when different methods for handling of duplicate isolates were considered to quantify susceptibility rates.
MethodsMicrobiological dataMicrobiological data were obtained by reviewing information about P. aeruginosa isolates collected at the ICU of the University Hospital of Araba (HUA), a Spanish tertiary hospital, between 1st January 2000 and 31st December 2017. The susceptibility (expressed as minimum inhibitory concentration, MIC) to amikacin, cefepime, ceftazidime, ciprofloxacin, gentamicin, levofloxacin, imipenem, meropenem, piperacillin/tazobactam and tobramycin was studied considering the Clinical and Laboratory Standards Institute (CLSI) breakpoints10 (Table 1).
| Antimicrobial agent | MIC interpretive criteria (mg/L) | Dosing regimen | Infusion time | PK/PD target | Pharmacokinetic parameters | ||||
|---|---|---|---|---|---|---|---|---|---|
| S | R | Vd (L) | Cl (L/h) | Ke (h−1) | fu | ||||
| Amikacin | ≤16 | ≥64 | 20mg/kg q24h | 0.5-h | Cmax/MIC>10 | 36.27±8.34 | 5.58±1.56 | ||
| Cefepime | ≤8 | ≥32 | 2g q8h | 0.5-h | %ƒT>MIC>70 | 21.8±5.10 | 7.62±1.98 | 0.85 | |
| Ceftazidime | ≤8 | ≥32 | 2g q/8-12h | 0.5-h | %ƒT>MIC >70 | 18.9±9 | 0.27±0.205 | ||
| Ciprofloxacin | ≤1 | ≥4 | 400mg q8-12h | 1-h | AUC/MIC>125 | 13.6±5.8 | |||
| Gentamicin | ≤4 | ≥16 | 7mg/kg q24h | 0.5-h | Cmax/MIC>10 | 19.6±1.14 | 4.32±1.28 | ||
| Imipenem | ≤2 | ≥8 | 1g q6h | 1-h | %ƒT>MIC>40 | 28.7±9.7 | 11.4±3.53 | 0.8 | |
| Levofloxacin | ≤2 | ≥8 | 500mg q12-24h | 1-h | AUC/MIC>125 | 8.04±2.1 | |||
| Meropenem | ≤2 | ≥8 | 2g q8h | 0.5-h | %ƒT>MIC>40 | 22.7±3.7 | 13.6±2.082 | 0.98 | |
| Piperacillin/tazobactam | ≤16 | ≥128 | 4/0.5 q6-8h | 0.5-h | %ƒT>MIC>50 | 19.4±7.76 | 13.8±4.77 | 0.75 | |
| Tobramycin | ≤4 | ≥16 | 7mg/kg q24h | 0.5-h | Cmax/MIC>10 | 17.5±5.25 | 0.249±0.01 | ||
S: susceptible; R: resistant; %ƒT>MIC: percentage of time that the antimicrobial free serum concentration remained above the MIC; AUC: area under the concentration-time curve; Cmax: maximum drug plasma concentration; MIC: minimum inhibitory concentration; Vd: volume of distribution, Cl: clearance; Ke: elimination rate constant; fu: unbound drug fraction.
According to the CLSI11 guideline, when the number of isolates per specie is less than 30, data on the organism from data collected over more than 12 consecutive months should be combined. In our case, susceptibilities were calculated in two-year periods. The percentage of susceptible strains in every period was estimated by using 5 different methods, following the methodology recommended by the CLSI: (1) including all isolates, that is, minimum processing strategy; (2) considering only the first isolate (CLSI criteria): only the first isolate per patient, per analysis period, irrespective of body site, antimicrobial susceptibility profile, or other phenotypical characteristics; (3) eliminating duplicates by variation in antimicrobial susceptibility (European Antimicrobial Resistance Surveillance System, EARSS criteria). All the isolates from a patient that had the same pattern of susceptibility to a group of antimicrobials were eliminated; (4 and 5) eliminating duplicates by time. We calculated the effect on susceptibility frequencies of eliminating isolates obtained from the same patient in an interval of time of less or equal to 7 (method 4) and 30 days (method 5).
The data were analyzed with the WHONET software, version 5.6.
Pharmacokinetic dataPharmacokinetic (PK) parameters were obtained from the literature12–21 (Table 1). Prospective studies performed in critically ill patients with infections providing the PK parameters and variability were selected.
Theoretical pharmacokinetic/pharmacodynamic (PK/PD) analysis and Monte Carlo simulationFor each antimicrobial, a 10,000 subject Monte Carlo simulation was conducted, with the Oracle® Crystal Ball software, using the PK data and the MIC distribution. Table 1 shows the magnitude of the PK/PD indices associated with the success of therapy for each antimicrobial22 and the evaluated dosing regimens. The probability that a specific value of the PK/PD index associated with the efficacy of an antimicrobial agent is achieved at a specific population of microorganisms is known as the cumulative fraction of response (CFR). It allowed us to calculate the probability of success for a treatment taking into account the bacterial population MIC distribution. The CFR values were calculated for two-year periods from 2000–2001 to 2016–2017 and considering MIC values using the five methods of eliminating duplicates described above.
CFR values greater than or equal to 90% were considered optimal, while values lower than 90% but higher than or equal to 80% were associated with moderate probabilities of success.
Statistical analysisA paired t-test was used to detect differences in the susceptibility rates calculated with the different methods for handling of duplicate isolates. Linear regression analysis was applied to determine the trends in P. aeruginosa antimicrobial susceptibility and in the CFR along the above-mentioned period. According to Friedrich et al.,23 an appropriate goodness of fit was considered when there was a coefficient of determination (r2) of at least 0.5 (corresponding to a correlation coefficient of ≥0.7). A p value <0.05 was considered statistically significant. Statistical analyses were performed with IBM® SPSS®, Statistics for Windows, Version 24 (IBM).
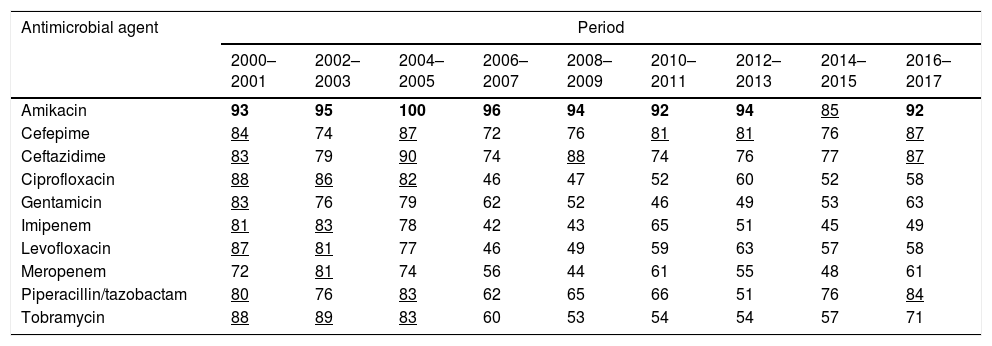
ResultsTable 2 shows the susceptibility of P. aeruginosa to the antimicrobials considering the first isolate. The last years evaluated (2016–2017), P. aeruginosa displayed high susceptibility to amikacin (92%), cephalosporins (87%) and piperacillin/tazobactam (84%). Susceptibility to the other antimicrobials was <72%. For the susceptibility rates calculated according to the other criteria for handling of duplicate isolates, please refer to the supporting information (supplementary Table 1). Susceptibility rates turned out to be significantly different depending on the used method. Generally, when all isolates were considered, the susceptibilities were the lowest; on the contrary, the highest values were obtained when only the first isolate was used (mean differences ranged from 1.32 to 6.51 percentage points; maximum difference, 19 percentage points).
Percentage of P. aeruginosa susceptible strains from 2000 to 2017 calculated considering the first isolate.
| Antimicrobial agent | Period | ||||||||
|---|---|---|---|---|---|---|---|---|---|
| 2000–2001 | 2002–2003 | 2004–2005 | 2006–2007 | 2008–2009 | 2010–2011 | 2012–2013 | 2014–2015 | 2016–2017 | |
| Amikacin | 93 | 95 | 100 | 96 | 94 | 92 | 94 | 85 | 92 |
| Cefepime | 84 | 74 | 87 | 72 | 76 | 81 | 81 | 76 | 87 |
| Ceftazidime | 83 | 79 | 90 | 74 | 88 | 74 | 76 | 77 | 87 |
| Ciprofloxacin | 88 | 86 | 82 | 46 | 47 | 52 | 60 | 52 | 58 |
| Gentamicin | 83 | 76 | 79 | 62 | 52 | 46 | 49 | 53 | 63 |
| Imipenem | 81 | 83 | 78 | 42 | 43 | 65 | 51 | 45 | 49 |
| Levofloxacin | 87 | 81 | 77 | 46 | 49 | 59 | 63 | 57 | 58 |
| Meropenem | 72 | 81 | 74 | 56 | 44 | 61 | 55 | 48 | 61 |
| Piperacillin/tazobactam | 80 | 76 | 83 | 62 | 65 | 66 | 51 | 76 | 84 |
| Tobramycin | 88 | 89 | 83 | 60 | 53 | 54 | 54 | 57 | 71 |
In bold: susceptibility ≥90%; underlined: susceptibility ≥80% and <90%.
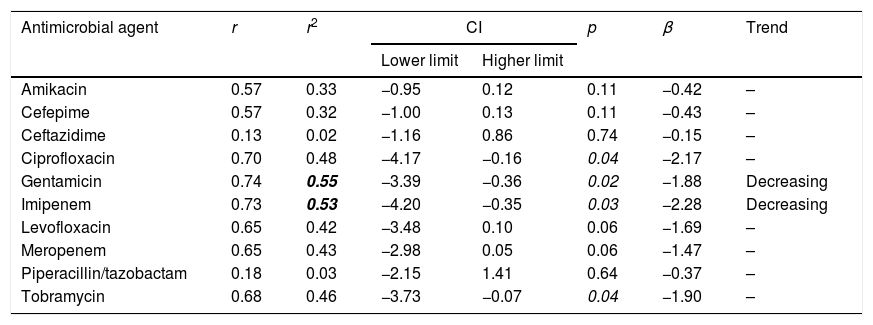
The trend analyses of antimicrobial susceptibility considering the first isolate are summarized in Table 3. The susceptibility rates to amikacin, cefepime, ceftazidime, ciprofloxacin, levofloxacin, meropenem, piperacillin/tazobactam and tobramycin were stable. In contrast, the susceptibility to gentamicin and imipenem decreased significantly over time. Supplementary Table 2 shows the results of the trend analysis with all the methods, which are similar in general, with a few exceptions.
Trends in susceptibility rates calculated considering the first isolate of P. aeruginosa from 2000 to 2017.
| Antimicrobial agent | r | r2 | CI | p | β | Trend | |
|---|---|---|---|---|---|---|---|
| Lower limit | Higher limit | ||||||
| Amikacin | 0.57 | 0.33 | −0.95 | 0.12 | 0.11 | −0.42 | – |
| Cefepime | 0.57 | 0.32 | −1.00 | 0.13 | 0.11 | −0.43 | – |
| Ceftazidime | 0.13 | 0.02 | −1.16 | 0.86 | 0.74 | −0.15 | – |
| Ciprofloxacin | 0.70 | 0.48 | −4.17 | −0.16 | 0.04 | −2.17 | – |
| Gentamicin | 0.74 | 0.55 | −3.39 | −0.36 | 0.02 | −1.88 | Decreasing |
| Imipenem | 0.73 | 0.53 | −4.20 | −0.35 | 0.03 | −2.28 | Decreasing |
| Levofloxacin | 0.65 | 0.42 | −3.48 | 0.10 | 0.06 | −1.69 | – |
| Meropenem | 0.65 | 0.43 | −2.98 | 0.05 | 0.06 | −1.47 | – |
| Piperacillin/tazobactam | 0.18 | 0.03 | −2.15 | 1.41 | 0.64 | −0.37 | – |
| Tobramycin | 0.68 | 0.46 | −3.73 | −0.07 | 0.04 | −1.90 | – |
r: correlation coefficient; r2: coefficient of determination; CI: confidence interval; β: slope.
In bold: r2≥0.49; in italic p<0.05.
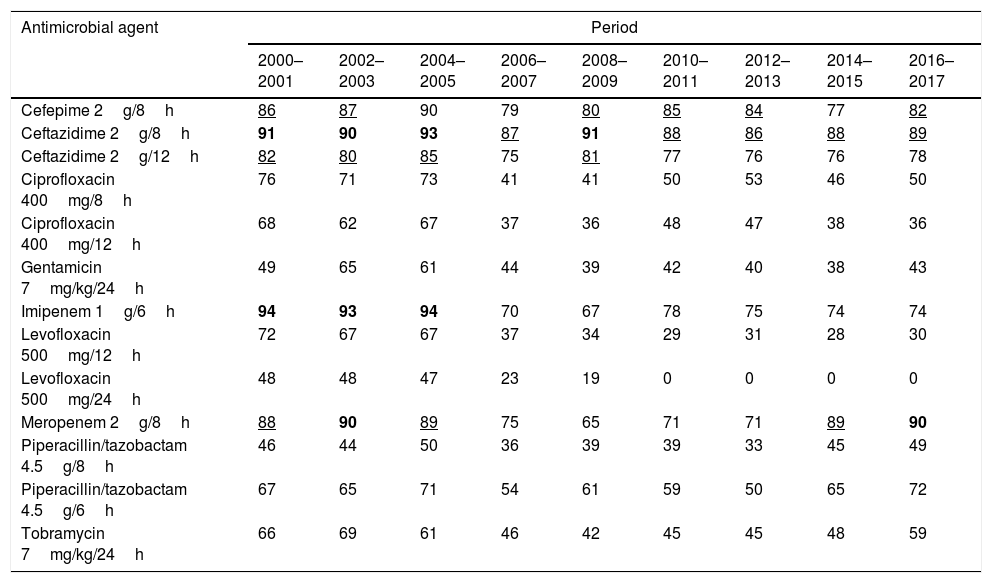
Table 4 features the probability to reach the PK/PD target (CFR values) over time calculated considering the first isolate. The results for amikacin have not been included because CFR could not be adequately calculated, since when antibiograms were done, amikacin concentrations ranged from 4mg/L to 32mg/L; therefore, a susceptibility profile for MICs<4mg/L was not available.
Antimicrobialś CFRs, for the recommended dosage regimens, calculated considering the first isolate.
| Antimicrobial agent | Period | ||||||||
|---|---|---|---|---|---|---|---|---|---|
| 2000–2001 | 2002–2003 | 2004–2005 | 2006–2007 | 2008–2009 | 2010–2011 | 2012–2013 | 2014–2015 | 2016–2017 | |
| Cefepime 2g/8h | 86 | 87 | 90 | 79 | 80 | 85 | 84 | 77 | 82 |
| Ceftazidime 2g/8h | 91 | 90 | 93 | 87 | 91 | 88 | 86 | 88 | 89 |
| Ceftazidime 2g/12h | 82 | 80 | 85 | 75 | 81 | 77 | 76 | 76 | 78 |
| Ciprofloxacin 400mg/8h | 76 | 71 | 73 | 41 | 41 | 50 | 53 | 46 | 50 |
| Ciprofloxacin 400mg/12h | 68 | 62 | 67 | 37 | 36 | 48 | 47 | 38 | 36 |
| Gentamicin 7mg/kg/24h | 49 | 65 | 61 | 44 | 39 | 42 | 40 | 38 | 43 |
| Imipenem 1g/6h | 94 | 93 | 94 | 70 | 67 | 78 | 75 | 74 | 74 |
| Levofloxacin 500mg/12h | 72 | 67 | 67 | 37 | 34 | 29 | 31 | 28 | 30 |
| Levofloxacin 500mg/24h | 48 | 48 | 47 | 23 | 19 | 0 | 0 | 0 | 0 |
| Meropenem 2g/8h | 88 | 90 | 89 | 75 | 65 | 71 | 71 | 89 | 90 |
| Piperacillin/tazobactam 4.5g/8h | 46 | 44 | 50 | 36 | 39 | 39 | 33 | 45 | 49 |
| Piperacillin/tazobactam 4.5g/6h | 67 | 65 | 71 | 54 | 61 | 59 | 50 | 65 | 72 |
| Tobramycin 7mg/kg/24h | 66 | 69 | 61 | 46 | 42 | 45 | 45 | 48 | 59 |
In bold CFR ≥ 90%; Underlined: CFR ≥ 80% and < 90%
During the last two-year period, the highest CFR values were obtained for meropenem (90%), ceftazidime 2g/12h (89%) and cefepime (82%). High CFR values were also obtained with imipenem until 2004–2005, but afterwards, they ranged from 67 to 78%. The CFRs for the other antimicrobials were <73%. The CFR values calculated on the basis of the five criteria are shown in supplementary Table 3. Statistically significant differences were observed in the CFR values depending on the method for handling of duplicate isolates, like for susceptibility rates (mean differences ranged from 0.63 to 4.60 percentage points; maximum difference, 15 percentage points).
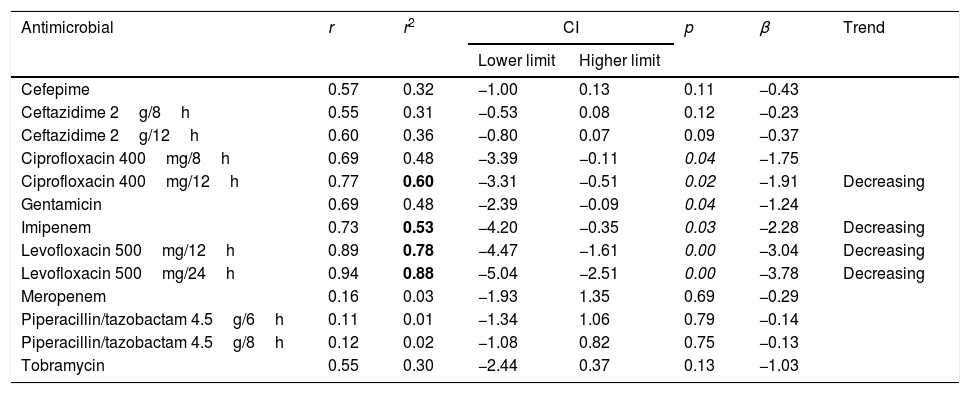
Table 5 presents the linear regression results for CFR values considering the first isolate. A statistically significant trend over time was observed for imipenem, with a decrease in CFR from 94% to 74% and for levofloxacin, although for this antimicrobial, the CFR values were always under 70%. There were no significant trends in overall CFR over time for cefepime, ceftazidime, gentamicin, meropenem and piperacillin/tazobactam. Supplementary Table 4 shows the results of the trend analysis for CFRs considering the five methods. In general, the same results were obtained with some exceptions.
Linear regression results for CFR considering the first isolate per patient.
| Antimicrobial | r | r2 | CI | p | β | Trend | |
|---|---|---|---|---|---|---|---|
| Lower limit | Higher limit | ||||||
| Cefepime | 0.57 | 0.32 | −1.00 | 0.13 | 0.11 | −0.43 | |
| Ceftazidime 2g/8h | 0.55 | 0.31 | −0.53 | 0.08 | 0.12 | −0.23 | |
| Ceftazidime 2g/12h | 0.60 | 0.36 | −0.80 | 0.07 | 0.09 | −0.37 | |
| Ciprofloxacin 400mg/8h | 0.69 | 0.48 | −3.39 | −0.11 | 0.04 | −1.75 | |
| Ciprofloxacin 400mg/12h | 0.77 | 0.60 | −3.31 | −0.51 | 0.02 | −1.91 | Decreasing |
| Gentamicin | 0.69 | 0.48 | −2.39 | −0.09 | 0.04 | −1.24 | |
| Imipenem | 0.73 | 0.53 | −4.20 | −0.35 | 0.03 | −2.28 | Decreasing |
| Levofloxacin 500mg/12h | 0.89 | 0.78 | −4.47 | −1.61 | 0.00 | −3.04 | Decreasing |
| Levofloxacin 500mg/24h | 0.94 | 0.88 | −5.04 | −2.51 | 0.00 | −3.78 | Decreasing |
| Meropenem | 0.16 | 0.03 | −1.93 | 1.35 | 0.69 | −0.29 | |
| Piperacillin/tazobactam 4.5g/6h | 0.11 | 0.01 | −1.34 | 1.06 | 0.79 | −0.14 | |
| Piperacillin/tazobactam 4.5g/8h | 0.12 | 0.02 | −1.08 | 0.82 | 0.75 | −0.13 | |
| Tobramycin | 0.55 | 0.30 | −2.44 | 0.37 | 0.13 | −1.03 | |
r: correlation coefficient; r2: coefficient of determination; CI: confidence interval; β: slope.
In bold r2≥0.49; in italic p<0.05.
Fig. 1 displays the comparison between the percentage of susceptible isolates and the CFR values when taking into consideration only the first isolate. There is a concordance in the susceptibility and CFR values for cephalosporins and ciprofloxacin. For carbapenems, the CFR values were higher than the susceptibility data. On the contrary, gentamicin, levofloxacin, piperacillin/tazobactam and tobramycin showed CFR values lower than the susceptibility data.
Discussion
This study examined the changes in the antimicrobial susceptibility rates of P. aeruginosa over time in the ICU, and compared them with the changes in the antimicrobial activity considering PK/PD criteria. In the last years tested (2016–2017), the most active antimicrobials were amikacin, cephalosporins and piperacillin/tazobactam. In the evaluated period, a significant decrease was observed in the susceptibility to gentamicin (from 83 to 63%) and imipenem (from 81 to 49%). These results are consistent with the increase of resistance worldwide. The data from large scale surveillance studies24 indicate an overall increasing resistance trend during the past few years, particularly evident for fluoroquinolones, aminoglycosides and anti-pseudomonal β-lactams.
The susceptibility percentages decreased until 2012 for ciprofloxacin (r2=0.586, p=0.045, β=−3.339), gentamicin (r2=0.894, p=0.001, β=−3.375), piperacillin/tazobactam (r2=0.730, p=0.014, β=−2.232) and tobramycin (r2=0.836, p=0.004, β=−3.607). The lowest susceptibility values were observed in the middle years, increasing later. In 2011 the Spanish “Zero-VAP” bundle was introduced, a proposal for the implementation of a simultaneous multimodal intervention in Spanish ICUs consisting of a bundle of ventilator-associated pneumonia (VAP) prevention measures.25 Moreover, in 2009 the nationwide Bacteremia Zero project was introduced, which reduced catheter-related bloodstream infection in Spanish ICUs.26 The recovery of the antimicrobial susceptibility in the last years evaluated could be related to these programmes, reinforcing the importance of these interventions for antimicrobial resistance control.
For a better evaluation of the adequacy of the antimicrobial treatments, it is important to consider not only the susceptibility of the bacteria, but also the probability to attain the targeted plasma concentrations. In this regard, the CFR values were <70% for most of the antimicrobials. In our study, meropenem showed high probabilities to achieve the PK/PD target and cephalosporins showed moderate probabilities, although for ceftazidime, the highest dose was required. Similar observations were reported by Zelenistky et al.9 who found that only the most aggressive regimens were able to attain the PK/PD target against P. aeruginosa.
For some antimicrobials, relevant differences between susceptibility rates and CFR values were detected (Fig. 1). The most remarkable cases appeared in ciprofloxacin, tobramycin and levofloxacin, for which no trend in susceptibility was detected, whereas CFR decreased over time. These differences could be explained by a shift in the MICs to higher values, but in the range of susceptibility. For instance, while the 64% of isolates had an MIC≤0.5mg/L for levofloxacin in 2000–2001, all the isolates showed MICs≥1mg/L in 2016–2017 (susceptibility breakpoint ≤2mg/L). Consequently, although a trend was not detected in the susceptibility, a significant decrease of more than 40 points was observed in CFR values.
For carbapenems, there is also a lack of concordance between susceptibility percentage and CFR values. Despite the relatively poor susceptibility observed in the last years, the recommended dose regimens provide effective plasma drug concentrations, and consequently high CFR values (90% for meropenem and 74% for imipenem).
These results demonstrate the importance of integrated PK/PD analyses to identify changes in the probability of treatment success that are not detected by simply assessing MIC values. Changes in susceptibility do not always translate into changes in the CFR and vice versa, hence the importance of carrying out a double analysis. Both parameters are complementary and both should be evaluated jointly in order to determine the usefulness of antimicrobial treatments. Considering only the susceptibility rates, we can classify as suitable a treatment that shows low probability of success according to PK/PD analysis. This is consistent with other studies in which treatment failures were related to discrepancies between the clinical and PK/PD breakpoints.22
Unfortunately, we could not calculate CFR values for amikacin, one of the most active antibiotics for P. aeruginosa, due to restrictions in the range of MIC concentrations tested in the hospital, where only a concentration range from 4mg/L to 32mg/L (susceptibility breakpoint MIC≤16mg/L) is evaluated. Although the concentration range used is adequate to categorize the strains as susceptible or resistant, it is not useful to estimate the CFR properly, whose value depends on the knowledge of the MIC values corresponding to a wide distribution and not only on the MIC values around the clinical breakpoints. In view of this situation, there should be a consensus regarding the MIC values that should be tested for each antimicrobial.
In order to properly evaluate the results obtained in this theoretical PK/PD analysis, some limitations must be considered. (i) PK information from all the patients from whom P. aeruginosa was isolated was not available. Therefore it was extracted from studies carried out in critically ill patients and available in the literature; (ii) the PK/PD analysis was carried out by using the mean PK parameters and their variability, without considering the possible influence of covariates on the PK behaviour of the drugs. Different results would be expected for subpopulations with significantly differences in pathophysiological conditions affecting the antimicrobials PK; (iii) the basis of the study includes information on antimicrobials administered following the recommended dose regimens for critically ill patients. However, it is important to bear in mind that the dosage regimens may be modified in the clinical practice.
Finally, we have studied the influence of the criteria for removing duplicate isolates on the detection of changes in antimicrobial susceptibility and on the probability of treatment success, observing significant differences. In this sense, the lowest susceptibility and CFR values were obtained generally when all isolates were considered, and the highest values were obtained by using only the first isolate. However, it has to be pointed out the trends of susceptibility and CFR values did not vary depending on the method, except for a few cases, for which a low degree of fit was observed (r2<0.5).23 Similarly, Kohlmann et al.27 reported that the inclusion of duplicate isolates in the laboratory reports on cumulative antimicrobial susceptibility testing may lead to higher rates of resistance, while the first isolate strategy tends to obtain a more optimistic view.
According to the CLSI,11 for the cumulative antibiogram report, only the first isolate of a species/patient/analysis period should be included irrespective of body site or antimicrobial susceptibility profile. However, in clinical practice, multiple isolates are frequently recovered from successive cultures from the same patient, and these isolates do not always contain identical strains. The usefulness of the different method for the handling of duplicate isolates has been discussed in different works.27–28 For purposes of infection control, detection of rare phenotypes, assessing resistance profiles among isolates encountered in a facility, and monitoring the development of resistant isolates in a patient over time, the inclusion of all isolates is valuable and recommendable. However, the inclusion of multiple isolates from a patient in analyses of cumulative susceptibility rates for a specific time period can significantly bias estimates in favour of the isolates recovered from patients who are cultured most frequently. The criterion of variation is useful to detect changes in susceptibility, but it is less objective and reproducible than the others. The criterion of time is objective and reproducible, but when the period of time for eliminating isolates increases, the percentage of susceptible strains also rises. The use of the first isolate, a criterion recommended by CLSI, may result in not considering different strains or strains that have acquired resistance during the treatment. Noguera et al.29 showed that the CLSI strategy has serious limitations, since it does not identify the presence of many isolates that may be acquired during a patient's evolution, due to the selection of bacterial microbiota associated with antibiotic pressure or other methods such as transmission by healthcare personnel or as a result of recurrent infection. More recently, Álvarez-Paredes et al.,30 also have questioned the suitability of the CLSI criterion. They found differences between the resistance rates of isolates when comparing data obtained applying different criteria for duplicate isolate removal. Our findings are particularly remarkable in this aspect since, not showing relevant differences among the methods and considering the simplicity of the first isolate, the method recommend by CLSI seems to be the most suitable for the determination of cumulative antimicrobial susceptibility and CFRs.
In conclusion, based on the obtained results, at the end of the period studied, meropenem provided high probabilities to achieve the PK/PD target, followed by cephalosporins, with moderate probabilities. This study shows that both susceptibility rates and CFR values have to be considered together to optimize the antimicrobial dose regimen for clinical making-decisions. They are complementary tools and, therefore, they should be used jointly in surveillance programmes. In fact, susceptibility data are not always useful to detect changes in the probability of treatment success. All the methods for handling repeated isolates evaluated turned out to be useful in clinical practice for both the determination of the cumulative antimicrobial susceptibility and the CFRs, since no relevant differences were observed among the methods.
Conflict of interestNothing to declare.
Patients’ data protectionNot applicable.
This work was supported by the UPV/EHU (PPG17/65, GIU17/032). A Valero thanks Universia Foundation for her grant.
The following are the supplementary data to this article:
