


With the aim of reducing the number of Post-Treatment Control Urine Cultures (UC) from Health Centers in our healthcare area, we conducted an Antimicrobial Stewardship Program (ASP) intervention throughout 2022. To do this, we set out to introduce effective methods to quantify, analyze, and subsequently try to reduce the number of inappropiate UC.
MethodsWe conducted a prospective and non-restrictive quasi-experimental intervention study with historical and parallel control group to evaluate the impact of the intervention. The UC evaluation was performed by analyzing all the medical records of repeated UC in a period of less than 31 days. UC were classified as: appropriate, inappropriate and doubtful. The study was conducted in 3 phases: phase 1) measurement of the baseline situation; phase 2) intervention in intervention group: simple educational presentations and implementation of a non-restrictive computerized rule, and phase 3) analysis of results in both groups and periods.
ResultsLooking at the %AUC, we observed that in the control group there was hardly any variation while in the intervention group (IG) these increased by 152.4 (p < 0.001). In addition, in the IG there was a decrease in total UCs of 55.4% (n = 418), representing an estimated savings of €7524. The acceptance of the CR in the IG was 9.6%.
ConclusionsThis ASP intervention is useful in decreasing the number of IUCs, especially the educational presentations. Achieving this can reduce direct and indirect patient harm and healthcare overload, in addition to improving the management of healthcare resources.
Con el objetivo de reducir el número de urocultivos de control postratamiento (UC) de nuestros centros de salud asociados, realizamos una intervención PROA durante el 2022. Para ello, nos propusimos introducir métodos eficientes para cuantificar, analizar y, posteriormente, intentar reducir el número de UC inapropiados.
MétodosLlevamos a cabo un estudio de intervención cuasiexperimental, prospectivo y no restrictivo, con un grupo de control histórico y paralelo, para evaluar el impacto de la intervención. La evaluación de los UC se realizó analizando las historias clínicas de los UC repetidos en menos de 31 días. Los UC se clasificaron como: apropiados, inapropiados y dudosos. El estudio se llevó a cabo en 3 fases: fase 1) medición de la situación basal; fase 2) intervención en el grupo de intervención: presentaciones educativas sencillas e implementación de una regla informática no restrictiva, y fase 3) análisis de los resultados en ambos grupos y períodos.
ResultadosEn cuanto al porcentaje de UC apropiados, observamos que en el grupo control apenas hubo variación, mientras que en el grupo intervención estos aumentaron un 152,4% (p < 0,001). Además, en el grupo intervención hubo una disminución en los UC totales del 55,4% (n = 418), suponiendo un ahorro estimado de 7.524€. La aceptación de la regla informática en el grupo intervención fue del 9,6%.
ConclusionesEsta intervención PROA es útil para disminuir el número de UCI, principalmente las presentaciones educativas. Lograr esto puede disminuir el daño directo e indirecto al paciente y la sobrecarga sanitaria, además de mejorar la gestión de los recursos sanitarios.
Antimicrobial resistance is a serious public health problem which limits treatment options. It is estimated that infections caused by resistant bacteria cause 700,000 deaths per year worldwide, 33,000 of which occur in the European Union and 3,000 in Spain. If the current situation is already worrying, the future of antimicrobial resistance predicted by experts is dramatic; it is estimated that by 2050, infections caused by multidrug-resistant microorganisms will overtake cancer as the leading cause of death and the economic impact will be similar to that of the 2008 financial crisis.1 Although resistance was initially considered to originate mostly in hospitals, it is now accepted that it is mainly generated in the community, as this is where about 93% of antibiotics are prescribed.2,3
To address the challenge posed by antimicrobial resistance at the community level in Spain, a proposal for primary care (PC) was developed in 2011 involving multi-speciality associations related to this area in both adults and children, and was endorsed by the Plan Nacional de Resistencia a los Antibióticos [National Antibiotic Resistance Plan].4 This document set out the general objectives of the Antimicrobial Stewardship Programmes (ASP), which are based on the creation of multidisciplinary teams to reduce antibiotic-related adverse effects (including resistance), improve clinical outcomes and ensure cost-effective therapy. Due to the marked differences between the hospital and PC settings, specific ASP teams have been established for each setting, with the core of the PC ASP team being a microbiologist, a pharmacist, a PC physician and a PC paediatrician.
Optimising the treatment of urinary tract infection (UTI) is an important area for the PC ASP due to its prevalence.5 Current recommendations for UTI management are based on empirical treatment according to local epidemiology. However, urine culture is necessary in cases of recurrent UTI or after treatment failure to isolate the aetiological agent and perform sensitivity testing. In addition, urine culture is indicated for the detection and treatment of asymptomatic bacteriuria in pregnant women or in patients who are to undergo urological procedures, so in these patients, follow-up or post-antibiotic therapy urine cultures (UC) are indicated to ensure microbiological eradication. Apart from these situations, the European Association of Urology Guidelines (2024), the Infectious Diseases Society of America and the Spanish Society of Infectious Diseases and Clinical Microbiology protocol for the microbiological diagnosis of UTI (2019) consider it inappropriate to perform UC in patients in whom urinary symptoms have resolved.6–8
We observed the collection of a considerable number of samples in the microbiology laboratory for UC analysis from PC centres. After a preliminary assessment, we found that a significant percentage of them were not indicated. These inappropriate UC (IUC) lead to an unnecessary increase in costs and workload and a probable negative impact on the local ecology if the patient is treated. Therefore, with the aim of reducing the number of IUC at the health centres in our health area, we carried out an ASP intervention over the course of 2022. We set out to introduce efficient methods to quantify, analyse and eventually reduce the number of IUC.
Material and methodsStructure of the interventionWe conducted a prospective, non-restrictive, quasi-experimental intervention study with a historical and parallel control group to assess the impact of the intervention. This ASP intervention consisted of measuring a series of parameters related to UC requests in several PC areas.
Our microbiology service supports three integrated health organisations (IHO), networks of health services which provide coordinated care across a continuum of services to a specific population. We included two of them in this study, which were adjacent to each other and were assigned as intervention group (IG) and control group (CG):
- •
IHO A (IG): includes 11 PC units comprising 29 health centres serving 172,000 patients.
- •
IHO B (CG): includes 11 PC units comprising 30 health centres serving 223,000 patients.
The study was carried out in three phases:
- •
Phase 1: measurement of the baseline situation in both groups. During the quarter January to March 2022, the percentage of appropriate UC (%AUC) was determined as an indicator of quality of care by reviewing medical records.
- •
Phase 2: Intervention in IHO A.
- o
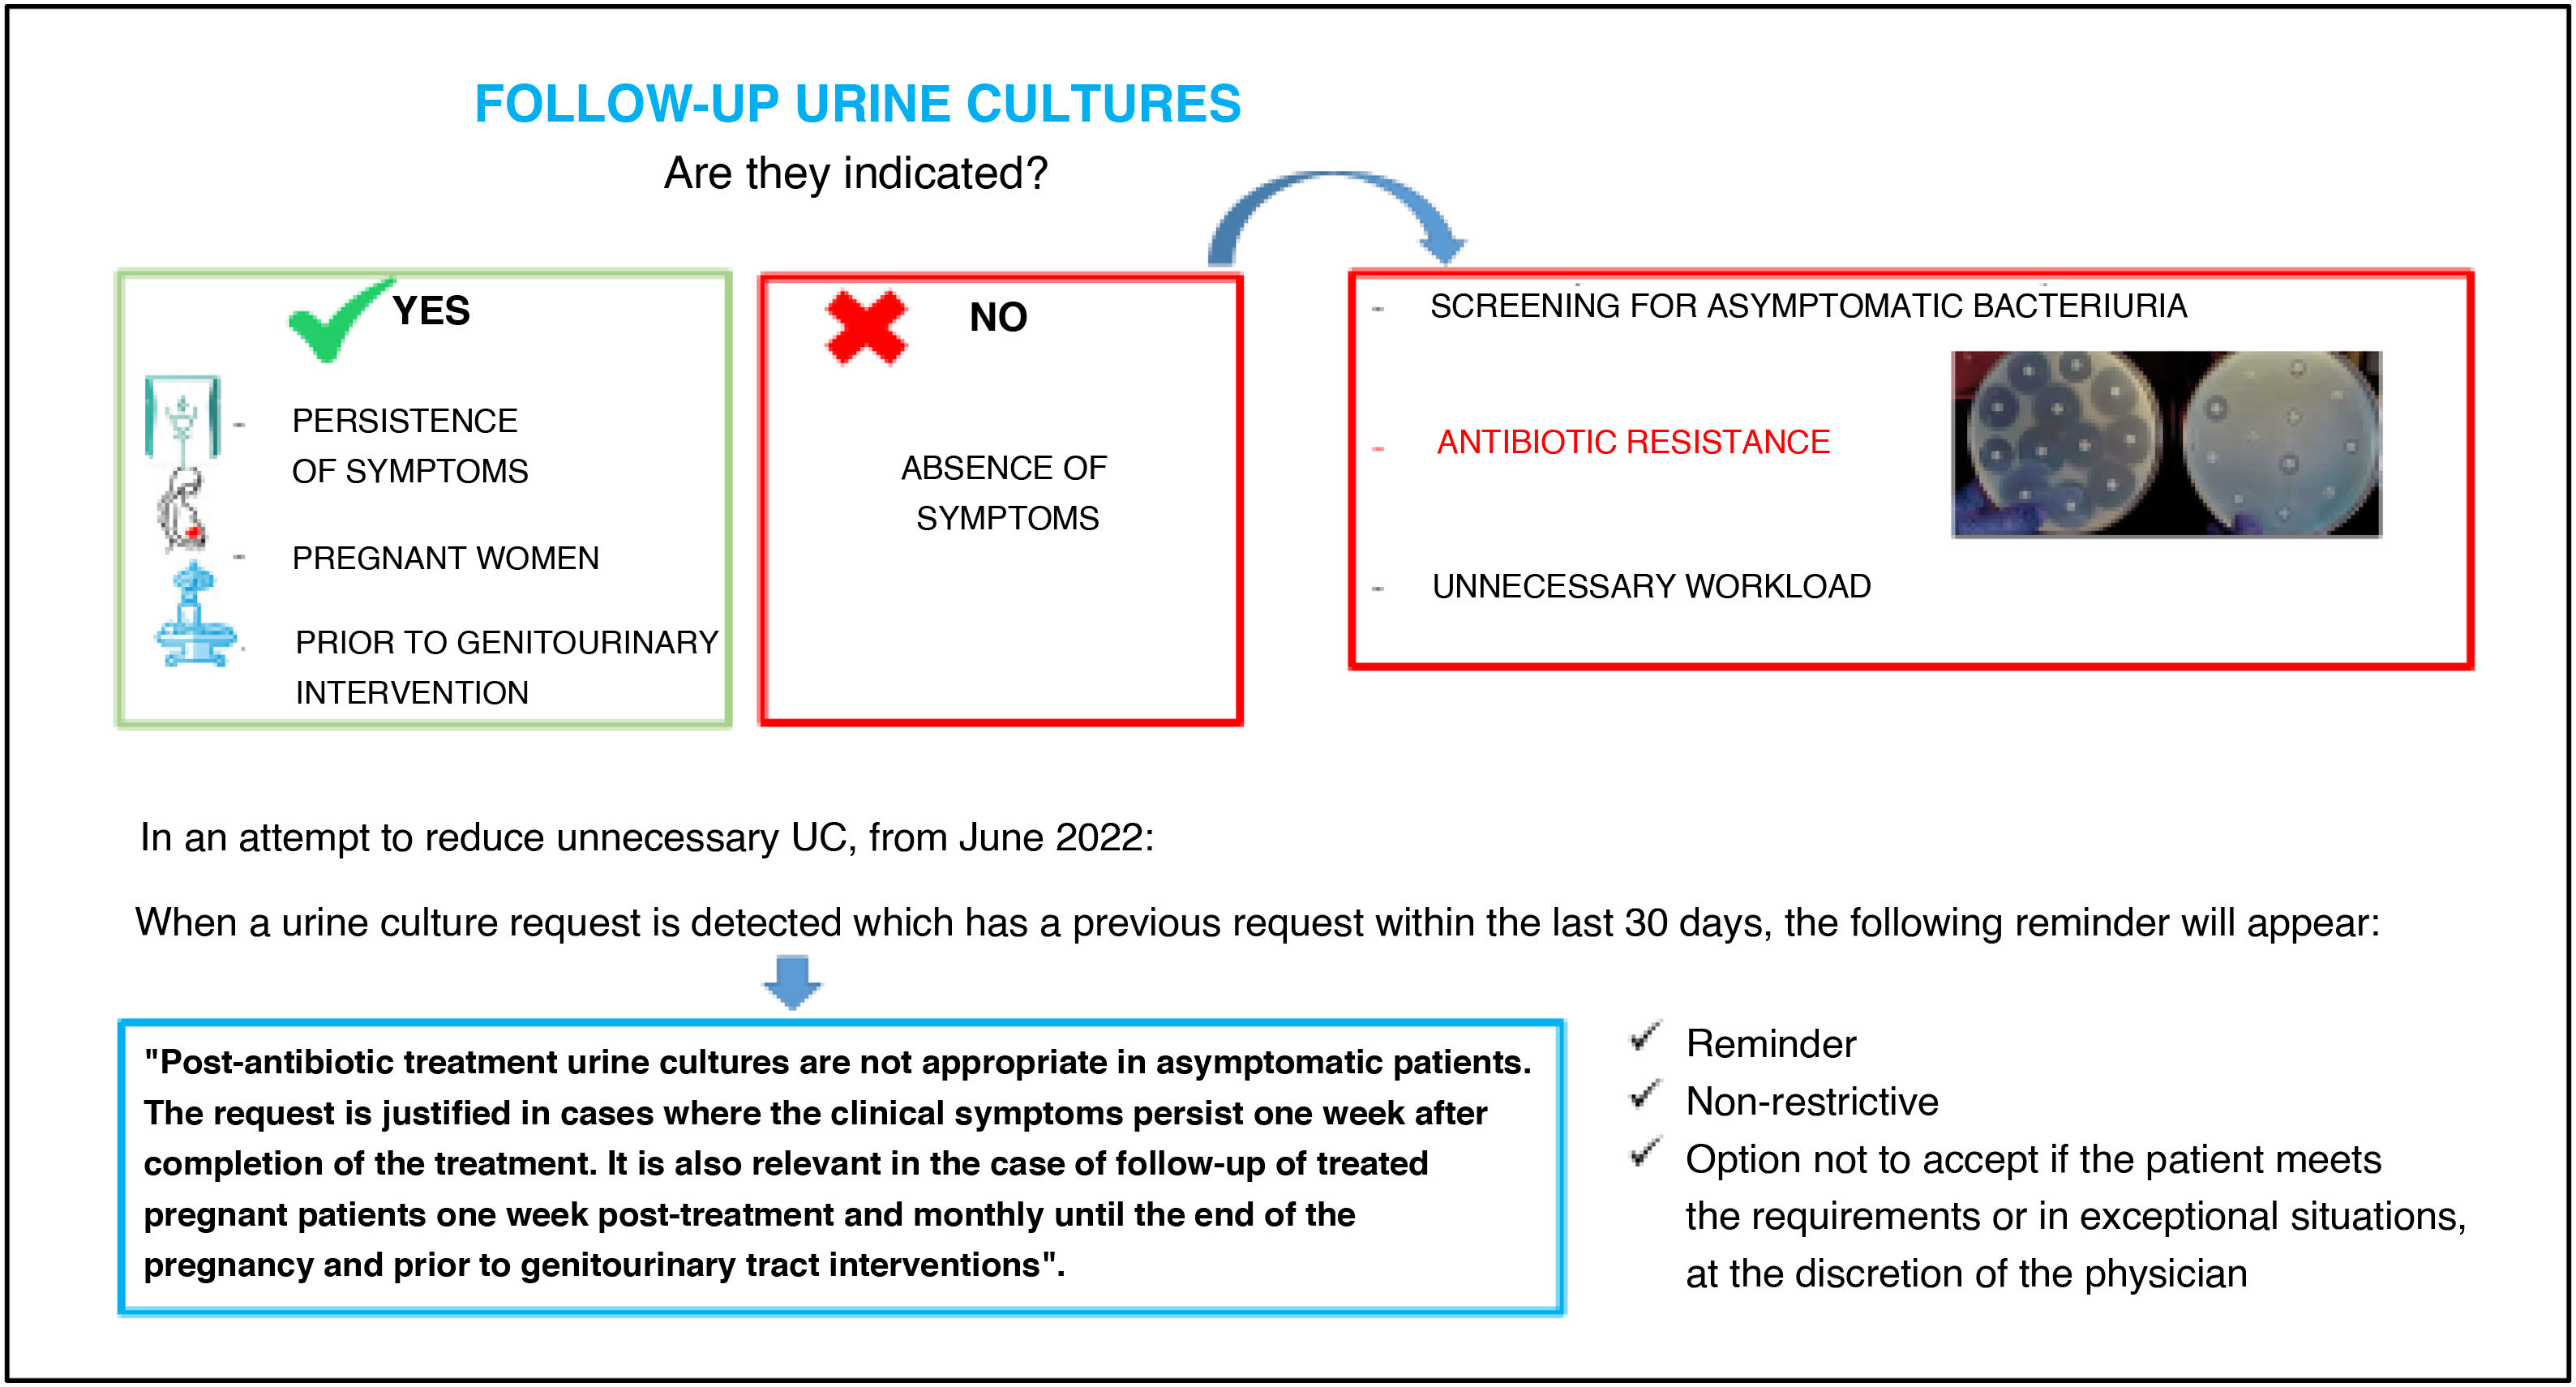
Delivery of simple educational presentations based on the available evidence on the appropriateness of UC (Fig. 1) to different PC units in May and June.
- o
Implementation of a non-restrictive computerised rule (CR) in the test request system, informing about the cases in which a repeat urine culture is indicated with the following message which was included in the training provided: "Post antibiotic treatment control urine cultures are not appropriate in asymptomatic patients. The request is justified in cases where the clinical symptoms persist one week after completion of the treatment. It is also relevant in the case of follow-up of treated pregnant patients one week post-treatment and monthly until the end of the pregnancy and prior to genitourinary tract interventions". The requesting clinician had the option to: a) accept it, in which case the request was cancelled; or b) reject it and continue with the request, once the requirements were deemed to have been met.
- •
Phase 3: analysis of the results in the October-December quarter in both IHO compared to the baseline quarter.
This was carried out using statistical tools in the Gestlab software (Clinisys™ Laboratory Platform Suite):
- •
UC extraction: data were extracted on the number of urine cultures repeated in a period of less than 31 days in both groups during the periods mentioned above. This period was selected to define a UC because outdated guidelines recommended performing it 1–2 weeks after the end of antibiotic treatment. Therefore, we considered that this time period allowed us to extract the vast majority of the requested UC.
- •
Assessment of UC: this was done by analysing all medical records of repeated UC within a period of less than 31 days. Following the definition of inappropriate request given previously,9 UC were classified as follows:
- o
Appropriate (AUC): when the requesting doctor indicated that the patient was a pregnant woman, was to undergo a urological intervention or had persistent symptoms that prompted the consultation.
- o
Inappropriate (IUC): those cases in which it was indicated that the request was made for reasons other than those set out in the previous point.
- o
Doubtful (DUC): when the medical records did not clearly indicate the reason for the repeat UC or the patient's condition.
- o
- •
Analysis of the UC intervention: the percentage of each group in the total UC (%AUC, %IUC and %DUC) before and after the intervention was calculated. The UC result was also reviewed, and three possible results were considered: positive (P), negative (N) and contaminated sample (C). The %P, %N and %C were calculated for each UC group, IHO and period.
- •
Economic analysis of the intervention: the relative unit of value of each urine culture was set at 1.5 based on our organisation's billing rates document.10 Tests with a relative unit value of 1 corresponded to a cost of €12, so a value of €18 was estimated for each urine culture.
The statistical analyses were carried out using R software v. 4.3.1 (R Core Team 2023). The packages used were: openxlsx (Schauberger and Walker 2023); janitor (Firke 2023) and forcats (Wickham 2023) (variable loading and pre-processing); compareGroups (Subirana, Sanz and Vila 2014) (descriptive tables and bivariate tables) and effectsize (Ben-Shachar, Lüdecke and Makowski 2020) (effect sizes); and BayesFactor (Morey and Rouder 2023) (calculation of the Bayes factor).
Quantitative variables were summarised by the mean and standard deviation if following a normal distribution, or by the median and the first and third quartiles otherwise. The Shapiro–Wilk test was used to determine the normality of a quantitative variable. The qualitative variables are presented as absolute and relative frequencies for each of their categories.
Comparison between groups was analysed using the t-test or Wilcoxon test for quantitative variables according to whether or not they followed a normal distribution. In the case of qualitative variables, the tests used were the chi-square test or Fisher's exact test. Once these comparisons were made, the most appropriate effect sizes, Cohen's W for quantitative variables and Cramer's V for qualitative variables, were calculated to study the magnitude of the associations found.
The level of significance was set at p < 0.05 and all analyses were performed with R software v. 4.3.3.
ResultsUrine cultures requestedIn the pre-intervention period, IHO B had fewer total urine cultures despite serving a larger population (Tables 1 and 2). However, the number of UC was higher and there was also a higher %AUC. The comparison between the two IHO was significant (p = 0.018), with a small associated effect size (V = 0.06; 95% CI [0; 0.10]).
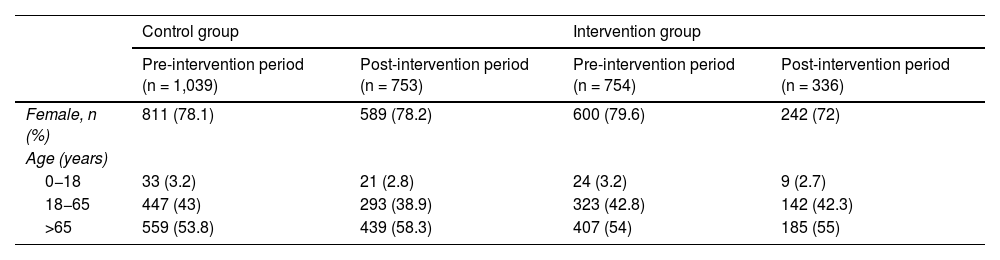
Demographic data.
| Control group | Intervention group | |||
|---|---|---|---|---|
| Pre-intervention period (n = 1,039) | Post-intervention period (n = 753) | Pre-intervention period (n = 754) | Post-intervention period (n = 336) | |
| Female, n (%) | 811 (78.1) | 589 (78.2) | 600 (79.6) | 242 (72) |
| Age (years) | ||||
| 0−18 | 33 (3.2) | 21 (2.8) | 24 (3.2) | 9 (2.7) |
| 18−65 | 447 (43) | 293 (38.9) | 323 (42.8) | 142 (42.3) |
| >65 | 559 (53.8) | 439 (58.3) | 407 (54) | 185 (55) |
Pre-intervention period.
| nU | %UC | %IUC | %DUC | %AUC | |||||||||
|---|---|---|---|---|---|---|---|---|---|---|---|---|---|
| 19.6 (n = 1,039) | 38.11 (n = 396) | 15.5 (n = 161) | 46.39 (n = 482) | ||||||||||
| %P | %C | %N | %P | %C | %N | %P | %C | %N | %P | %C | %N | ||
| Control | 5,301 | 34.2 | 15.7 | 50.1 | 31.6 | 20.2 | 48.2 | 36 | 14.9 | 49.1 | 35.9 | 12.2 | 51.9 |
| 11.36 (n = 754) | 41.38 (n = 312) | 18.7 (n = 141) | 39.92 (n = 301) | ||||||||||
|---|---|---|---|---|---|---|---|---|---|---|---|---|---|
| %P | %C | %N | %P | %C | %N | %P | %C | %N | %P | %C | %N | ||
| Intervention | 6,640 | 33.6 | 15.6 | 50.8 | 36.6 | 17.6 | 45.8 | 27.7 | 14.8 | 57.4 | 33.2 | 14 | 52.8 |
AUC: appropriate urine culture; C: contaminated urine cultures; DUC: doubtful urine culture; IUC: inappropriate urine culture; N: negative urine cultures; nU: total number of urine cultures; P: positive urine cultures; UC: repeated urine cultures in the last 30 days.
In the post-intervention period, there was a generalised decrease in total urine cultures (Figs. 2 and 3). However, when analysing the UC, it could be seen that, although they were reduced in both IHO, the reduction in the CG was 27.5% compared to 55.4% in the IG (Table 3), representing a reduction of 418 UC and an estimated saving of €7,524. Furthermore, with regard to the %AUC, we found that in the CG there was hardly any variation, while in the IG these increased by 152.4%, representing the majority of the UC. The comparison between the two IHO was statistically significant (p < 0.001), with an associated small/medium effect size (V = 0.15; 95% CI [0.09; 0.21]).
Post-intervention period.
| nU | %UC | %IUC | %DUC | %AUC | |||||||||
|---|---|---|---|---|---|---|---|---|---|---|---|---|---|
| 14.76 (n = 753) | 35.01 (n = 263) | 19.63 (n = 148) | 45.36 (n = 342) | ||||||||||
| %P | %C | %N | %P | %C | %N | %P | %C | %N | %P | %C | %N | ||
| Control | 5,101 | 21.3 | 6.6 | 72.1 | 17.9 | 6.5 | 75.6 | 18.2 | 8.8 | 73 | 25 | 6.1 | 68.7 |
| 5.84 (n = 336) | 19.88 (n = 67) | 9.28 (n = 65) | 60.84 (n = 204) | ||||||||||
|---|---|---|---|---|---|---|---|---|---|---|---|---|---|
| %P | %C | %N | %P | %C | %N | %P | %C | %N | %P | %C | %N | ||
| Intervention | 5,754 | 28.3 | 9.2 | 62.5 | 34.3 | 13.4 | 52.3 | 29.2 | 7.7 | 63.1 | 26 | 8.3 | 65.7 |
AUC: appropriate urine culture; C: contaminated urine cultures; DUC: doubtful urine culture; IUC: inappropriate urine culture; N: negative urine cultures; nU: total number of urine cultures; P: positive urine cultures; UC: repeated urine cultures in the last 30 days.
When comparing the influence of the intervention on each of the two IHO, there was no statistical significance within the CG (p = 0.059). The comparison between the two IHO was statistically significant (p < 0.001), with an associated small/medium effect size (V = 0.22; 95% CI [0.15; 0.27]). The percentage of cases with insufficient or absent information remained around 15–20 % in both the pre-intervention and post-intervention periods (Tables 2 and 3).
Approximately 30% (17.9–36.6 %) of the IUC had a positive result, while in about 15% (6.5–20.2 %), the sample was contaminated (Tables 2 and 3).
Computerised ruleAcceptance of the non-restrictive CR in the IG was only 9.6%; in the remaining cases, clinicians continued with the request for UC.
DiscussionThe ASP intervention conducted proved to be successful in reducing IUC, with a significant decrease found in the IHO where the intervention was implemented. Given the low uptake of the non-restrictive CR, we attribute this success mainly to the training provided by the PC ASP team, the first filter of the intervention. Consequently, it is inferred that healthcare professionals with greater willingness to follow the given recommendations refrained from requesting IUC after the training given, and those getting as far as the CR (second filter) were those with less willingness and cases in which the requested UC was indeed an AUC. While the implementation of a restrictive CR is a possibility, the current ASP approach focuses on training as the most effective long-term strategy, avoiding restrictive measures.
The higher number of AUC in the CG during the pre-intervention period may be multifactorial. However, we believe that this could be mainly due to socio-cultural differences between the populations served by the two IHO. IHO B serves a population with a higher immigration rate, and we attribute this difference to a higher volume of urine cultures in pregnant women due to a higher birth rate in this population group.
The overall decrease in total urine cultures in the post-intervention period could be due to seasonal factors. There is some controversy in the literature regarding the seasonal nature of UTI, with some studies concluding that they increase in warmer months such as summer,11,12 while others state that they are higher in the winter months.13 Our data from previous years suggest that a higher number of urine cultures are requested in the winter months compared to the autumn, which shows that seasonality may not have influenced this finding. However, further studies are needed to assess the seasonal nature of UTI in our setting.
Given that approximately one third of the IUC had a positive result, it is possible that an undetermined percentage of these patients were given inappropriate antibiotic therapy, with the consequent impact on adverse drug reactions. In addition, those IUC with contaminated results may have triggered further IUC, leading to unnecessary increases in healthcare costs, avoidable patient discomfort and possible unnecessary treatment after the second IUC.
To our knowledge, this is the first study to assess in detail the impact of UC on the total number of urine cultures and to classify them according to whether they were indicated or not according to the main treatment guidelines. In 2015, López-Prieto et al.14 conducted a descriptive cross-sectional study on the adequacy of urine culture ordering. The request for the first urine culture was inappropriate in 14% of patients and the second urine culture was inappropriate in 92%. However, this was a retrospective study, the authors claimed to have incomplete information, did not focus on UC and had a relatively small sample size. Our sample was relatively large, with a total of 22,706 urine cultures, 2,882 (12.7%) of which were UC. In addition, the quasi-experimental design of the study combined a temporal comparison after an intervention and a comparison with a CG, which provides a high level of evidence for our results.
Although most optimisation interventions are based on the development of clinical treatment guidelines and the systematic review of prescriptions,15–23 we consider it crucial to proactively exercise the role attributed to the PC ASP microbiologist in training focusing on pre-analytical factors and the appropriateness of the tests ordered.24 The problem of inappropriate test ordering is shared with the other clinical laboratory services; the Carter Review, a review of pathology services in England commissioned by the UK Department of Health, estimated that 25% of pathology tests were unnecessary.25 Following the adequacy approach, Salinas et al.26 recently published a review of various laboratory test demand management interventions. As in our study and previous similar reviews,26 they conclude that this approach could reduce the number of unnecessary tests, increase the effectiveness of the management of these systems and contribute to the overall success of the patient-centred approach. Our intervention was educational and non-restrictive, where clinicians were free to follow our recommendations or not, making this intervention applicable to other settings and circumstances. Although the focus was on PC due to the lower average patient complexity, it is also applicable to the hospital setting, as long as the characteristics of these patients are taken into account in the study design. Furthermore, we believe that similar optimisation interventions could be applicable to other types of microbiological samples, such as uncomplicated skin and soft tissue infections, where the lack of indication does not preclude abundant submission of such samples for microbiological analysis.
However, we should not overlook the limitations of the study. The study was not randomised because of the enormous complexity required. However, to mitigate the consequences of not randomly dividing the samples between CG and IG, we selected two population groups with equivalent characteristics in terms of number of patients seen and number of urine cultures per year. Another limitation of our study is the number of urine cultures with no or limited information in the medical records (15.5–19.3 %), as it adds difficulty in terms of interpreting the microbiological results and providing the study with greater accuracy. Finally, it was not possible to obtain reliable data on urinary antibiotic prescriptions in the IHO studied to show the impact of the intervention at this level. As discussed above, a reduction in inappropriate antibiotic prescribing could be assumed due to a decrease in the number of positive IUC, but we lack the data to substantiate this.
In conclusion, the findings of this study support the utility of interventions aimed at reducing the number of IUC. Achieving this can have an impact at all levels, starting with reducing direct and indirect patient harm, continuing with reducing pressure on health services and ending with better management of healthcare resources. Ultimately, as with any optimisation, it could also have an impact on reducing the growing problem of antibiotic resistance. However, there is a need for effective CR or better technological tools to facilitate implementation and a proactive system of continuous training to facilitate good decision making. Finally, it is equally important to be able to establish effective communication channels between microbiology physicians and PC physicians, who are often overloaded with work, in order to establish continuous feedback in order to facilitate patient management.
FundingThe authors have no sources of funding to declare.
None.