


The neutrophil-to-lymphocyte ratio (NLR) in the diagnosis of sepsis has been found to be higher in non-survivors than in survivors, and that is associated with mortality. A higher NLR in non-survivors than in survivors has been reported in two studies during patient follow-up; however, NLR was not controlled for sepsis severity. Thus, the objective of this study was to determine whether there is an association between NLR in the first seven days and mortality controlling for sepsis severity.
MethodsThis observational study, which included septic patients, was conducted in the Intensive Care Units of 3 Spanish hospitals. NLR was recorded on the first, fourth, and eighth day of sepsis. Multiple logistic regression analyses were carried out to determine the association between NLR during the first 7 days of sepsis diagnosis and mortality controlling for sepsis severity.
ResultsThirty-day non-surviving patients (n=68) compared to surviving patients (n=135) showed higher NLR on the first (p<0.001), fourth (p<0.001), and eighth (p<0.001) day of sepsis diagnosis. Multiple logistic regression analysis found an association between NLR at days first (p<0.001), fourth (p=0.004), and eighth (p=0.01) of sepsis diagnosis and mortality controlling for SOFA and lactic acid in those days.
ConclusionsThe new finding of our study was the association between NLR in the first seven days of sepsis and mortality controlling for sepsis severity.
Se ha objetivado que la relación neutrófilos/linfocitos (NLR) en el momento del diagnóstico de la sepsis es mayor en fallecidos que en supervivientes y que está asociada con la mortalidad. En dos estudios, se ha reportado mayor NLR en fallecidos durante la evolución; sin embargo, NLR no se controló por la gravedad de la sepsis. Por lo tanto, el objetivo de este estudio consistió en determinar si existe una asociación entre NLR durante los primeros siete días y mortalidad, controlando por gravedad de la sepsis.
MétodosEste estudio observacional, incluyendo pacientes sépticos, fue realizado en las Unidades de Cuidados Intensivos de tres hospitales españoles. Se registró NLR en los días 1, 4 y 8 del diagnóstico de la sepsis. Se realizó regresión logística múltiple para determinar la asociación entre NLR durante los primeros siete días y mortalidad (a los 30 días), controlando por gravedad de la sepsis.
ResultadosLos pacientes fallecidos en los primeros 30 días (n = 68), comparados con los supervivientes (n = 135), tuvieron mayor NLR en los días 1 (p < 0,001), 4 (p < 0,001) y 8 (p < 0,001) del diagnóstico de la sepsis. La regresión logística múltiple mostró la asociación entre NLR en los días 1 (p < 0,001), 4 (p = 0,004) y 8 (p = 0,01) del diagnóstico de la sepsis y mortalidad, controlando por SOFA y lactatemia en esos días.
ConclusionesEl nuevo hallazgo de nuestro estudio fue la asociación entre NLR durante los primeros siete días de la sepsis y la mortalidad, controlando por gravedad de la sepsis.
Sepsis is a major cause of healthcare and deaths.1,2 Neutrophils are manly involved in the innate immune response and lymphocytes in the adaptive immune response. In sepsis, blood neutrophil count increases and the blood lymphocyte count decreases; thus, the neutrophil-to-lymphocyte ratio (NLR) has been suggested as an indicator of systemic inflammation. A recently published meta-analysis has been carried out to clarify the prognostic value of NLR at admission in patients with sepsis.3 The authors included articles published before March 2019, and finally 14 studies comprising 11,564 patients were included. In a subanalysis with 9 out of 14 studies comprising 1371 patients was found higher NLR at admission in non-survivors than in survivors. In other subanalysis with 9 out of 14 studies comprising 10,685 patients was found that NLR at admission was associated with mortality. In other studies published after this meta-analysis, NLR at admission was also found higher in non-survivors than in survivors, and that was associated with mortality.4–10
In two studies, data on NLR during patient evolution were reported.10,11 One article found higher NLR in non-surviving than in surviving patients at days 1, day 3 and in the last day of ICU.10 Another article found a higher NLR in non-survivors than in day 1, day 3, and day 7 survivors.11 However, the association between NLR and mortality was not explored by controlling the severity of sepsis during the patients’ evolution. Thus, the objective of this study was to determine whether there is an association between NLR in the first seven days and mortality controlling for sepsis severity.
Material and methodsDesign and subjectsThis prospective and observational study was conducted during 2013 and 2014 in the Intensive Care Units of 3 hospitals in Spain. The approval by the Ethics Committee of the 3 hospitals, and the informed/signed consent from the patients or some family member was obtained for the participation in the study.
The patients meeting sepsis criteria of Sepsis-3 Consensus were included in the study.12 We excluded patients with hematological tumor, blood white cell count <1000/μl, solid tumor, radiation therapy, human immunodeficiency virus (HIV), steroid agents, immunosuppressive therapy, breastfeeding, age <18 years or pregnancy.
VariablesAge, sex, and the history of chronic obstructive pulmonary disease, ischemic heart disease, chronic renal failure and diabetes mellitus were registered. Additionally, we registered site of infection, bilirubin, creatinine, activated partial thromboplastin time, international normalized ratio, platelets, lactic acid, pressure of arterial oxygen, fraction inspired of oxygen, Acute Physiology and Chronic Health Evaluation (APACHE)-II score,13 and the development of bloodstream infection and septic shock. We also registered NLR, lactic acid and Sepsis-related Organ Failure Assessment [SOFA] score14 at days first (at ICU admission), fourth, and eighth of sepsis diagnosis. Mortality at 30 days was considered as the endpoint study.
Statistical methodsWe used medians (and percentile 25–75) and frequencies (and percentages), and Mann–Whitney U test and chi-square test to report and compare continuous and categorical variables. We compared NLR at days 1,4 and 8 between surviving and non-surviving patients (Fig. 1). We plotted receiver operating characteristic curves using NLR on days 1, 4 and 8 of sepsis diagnosis and mortality at 30 days; and area under curve (AUC) and 95% confidence interval were reported. We carried out multiple logistic regression analyses to determine the association between NLR on days 1, 4, and 8 of sepsis diagnosis and mortality controlling for SOFA and lactic acid on those days. We constructed Kaplan–Meier curves using NLR ≤12.1 and >12.1 (point selected in basis to Youden J index) and mortality at 30 days, and the curves were compared by log-rank test. Significant differences were established with p<0.05.
Results at days 1, 4 and 8 in survivor and non-survivor septic. There were higher NLR at days 1, 4 and 8 in survivor patients.")
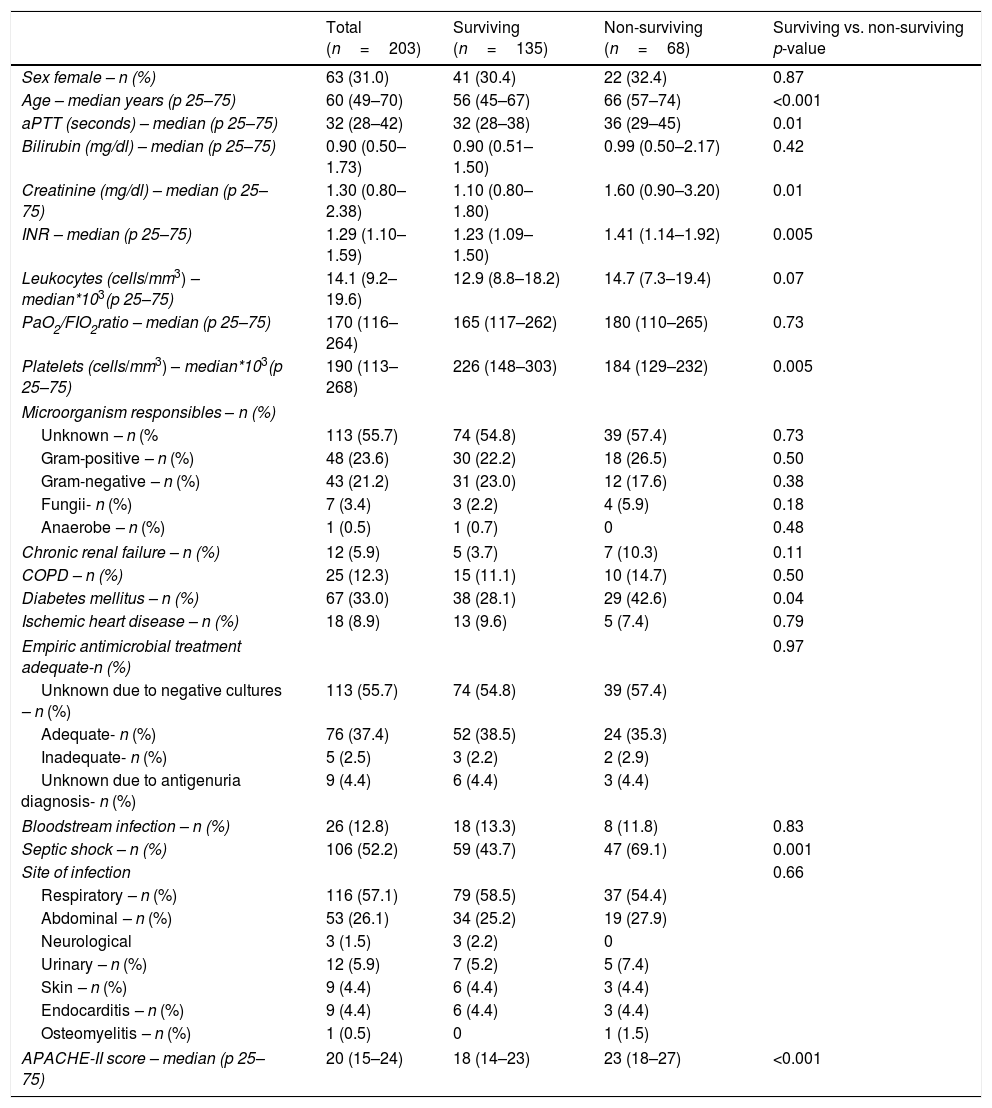
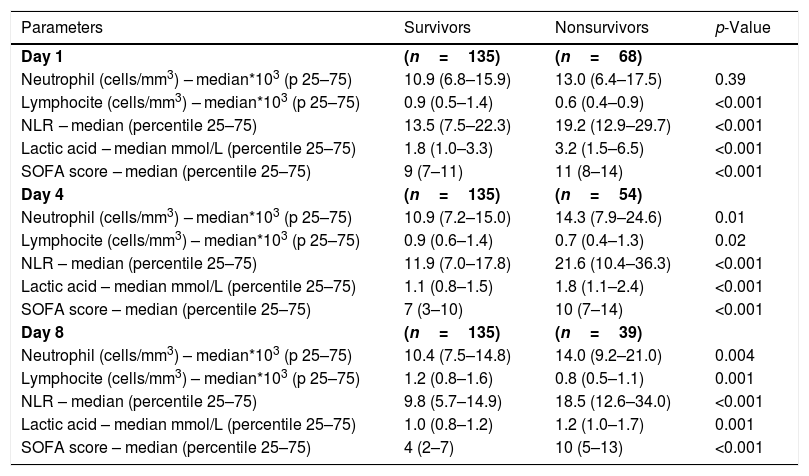
We found that non-surviving patients (n=68) compared to surviving patients (n=135) had higher APACHE-II, age, and rate of diabetes mellitus and septic shock. (Table 1). We found that non-surviving patients showed higher NLR in the first (p<0.001), fourth (p<0.001), and eighth (p<0.001) days than survivors (Table 2, Fig. 1), and also higher lactic acid and SOFA score in those days (Table 2).
Demographic and clinical characteristics of non-surviving and surviving septic patients.
| Total (n=203) | Surviving (n=135) | Non-surviving (n=68) | Surviving vs. non-surviving p-value | |
|---|---|---|---|---|
| Sex female – n (%) | 63 (31.0) | 41 (30.4) | 22 (32.4) | 0.87 |
| Age – median years (p 25–75) | 60 (49–70) | 56 (45–67) | 66 (57–74) | <0.001 |
| aPTT (seconds) – median (p 25–75) | 32 (28–42) | 32 (28–38) | 36 (29–45) | 0.01 |
| Bilirubin (mg/dl) – median (p 25–75) | 0.90 (0.50–1.73) | 0.90 (0.51–1.50) | 0.99 (0.50–2.17) | 0.42 |
| Creatinine (mg/dl) – median (p 25–75) | 1.30 (0.80–2.38) | 1.10 (0.80–1.80) | 1.60 (0.90–3.20) | 0.01 |
| INR – median (p 25–75) | 1.29 (1.10–1.59) | 1.23 (1.09–1.50) | 1.41 (1.14–1.92) | 0.005 |
| Leukocytes (cells/mm3) – median*103(p 25–75) | 14.1 (9.2–19.6) | 12.9 (8.8–18.2) | 14.7 (7.3–19.4) | 0.07 |
| PaO2/FIO2ratio – median (p 25–75) | 170 (116–264) | 165 (117–262) | 180 (110–265) | 0.73 |
| Platelets (cells/mm3) – median*103(p 25–75) | 190 (113–268) | 226 (148–303) | 184 (129–232) | 0.005 |
| Microorganism responsibles – n (%) | ||||
| Unknown – n (% | 113 (55.7) | 74 (54.8) | 39 (57.4) | 0.73 |
| Gram-positive – n (%) | 48 (23.6) | 30 (22.2) | 18 (26.5) | 0.50 |
| Gram-negative – n (%) | 43 (21.2) | 31 (23.0) | 12 (17.6) | 0.38 |
| Fungii- n (%) | 7 (3.4) | 3 (2.2) | 4 (5.9) | 0.18 |
| Anaerobe – n (%) | 1 (0.5) | 1 (0.7) | 0 | 0.48 |
| Chronic renal failure – n (%) | 12 (5.9) | 5 (3.7) | 7 (10.3) | 0.11 |
| COPD – n (%) | 25 (12.3) | 15 (11.1) | 10 (14.7) | 0.50 |
| Diabetes mellitus – n (%) | 67 (33.0) | 38 (28.1) | 29 (42.6) | 0.04 |
| Ischemic heart disease – n (%) | 18 (8.9) | 13 (9.6) | 5 (7.4) | 0.79 |
| Empiric antimicrobial treatment adequate-n (%) | 0.97 | |||
| Unknown due to negative cultures – n (%) | 113 (55.7) | 74 (54.8) | 39 (57.4) | |
| Adequate- n (%) | 76 (37.4) | 52 (38.5) | 24 (35.3) | |
| Inadequate- n (%) | 5 (2.5) | 3 (2.2) | 2 (2.9) | |
| Unknown due to antigenuria diagnosis- n (%) | 9 (4.4) | 6 (4.4) | 3 (4.4) | |
| Bloodstream infection – n (%) | 26 (12.8) | 18 (13.3) | 8 (11.8) | 0.83 |
| Septic shock – n (%) | 106 (52.2) | 59 (43.7) | 47 (69.1) | 0.001 |
| Site of infection | 0.66 | |||
| Respiratory – n (%) | 116 (57.1) | 79 (58.5) | 37 (54.4) | |
| Abdominal – n (%) | 53 (26.1) | 34 (25.2) | 19 (27.9) | |
| Neurological | 3 (1.5) | 3 (2.2) | 0 | |
| Urinary – n (%) | 12 (5.9) | 7 (5.2) | 5 (7.4) | |
| Skin – n (%) | 9 (4.4) | 6 (4.4) | 3 (4.4) | |
| Endocarditis – n (%) | 9 (4.4) | 6 (4.4) | 3 (4.4) | |
| Osteomyelitis – n (%) | 1 (0.5) | 0 | 1 (1.5) | |
| APACHE-II score – median (p 25–75) | 20 (15–24) | 18 (14–23) | 23 (18–27) | <0.001 |
aPTT=Activated partial thromboplastin time; INR=International normalized ratio; PaO2/FIO2=pressure of arterial oxygen/fraction inspired oxygen; COPD=Chronic Obstructive Pulmonary Disease; APACHE=Acute Physiology and Chronic Health Evaluation.
Organ dysfunction and laboratory data at day first, fourth, and eighth of sepsis.
| Parameters | Survivors | Nonsurvivors | p-Value |
|---|---|---|---|
| Day 1 | (n=135) | (n=68) | |
| Neutrophil (cells/mm3) – median*103 (p 25–75) | 10.9 (6.8–15.9) | 13.0 (6.4–17.5) | 0.39 |
| Lymphocite (cells/mm3) – median*103 (p 25–75) | 0.9 (0.5–1.4) | 0.6 (0.4–0.9) | <0.001 |
| NLR – median (percentile 25–75) | 13.5 (7.5–22.3) | 19.2 (12.9–29.7) | <0.001 |
| Lactic acid – median mmol/L (percentile 25–75) | 1.8 (1.0–3.3) | 3.2 (1.5–6.5) | <0.001 |
| SOFA score – median (percentile 25–75) | 9 (7–11) | 11 (8–14) | <0.001 |
| Day 4 | (n=135) | (n=54) | |
| Neutrophil (cells/mm3) – median*103 (p 25–75) | 10.9 (7.2–15.0) | 14.3 (7.9–24.6) | 0.01 |
| Lymphocite (cells/mm3) – median*103 (p 25–75) | 0.9 (0.6–1.4) | 0.7 (0.4–1.3) | 0.02 |
| NLR – median (percentile 25–75) | 11.9 (7.0–17.8) | 21.6 (10.4–36.3) | <0.001 |
| Lactic acid – median mmol/L (percentile 25–75) | 1.1 (0.8–1.5) | 1.8 (1.1–2.4) | <0.001 |
| SOFA score – median (percentile 25–75) | 7 (3–10) | 10 (7–14) | <0.001 |
| Day 8 | (n=135) | (n=39) | |
| Neutrophil (cells/mm3) – median*103 (p 25–75) | 10.4 (7.5–14.8) | 14.0 (9.2–21.0) | 0.004 |
| Lymphocite (cells/mm3) – median*103 (p 25–75) | 1.2 (0.8–1.6) | 0.8 (0.5–1.1) | 0.001 |
| NLR – median (percentile 25–75) | 9.8 (5.7–14.9) | 18.5 (12.6–34.0) | <0.001 |
| Lactic acid – median mmol/L (percentile 25–75) | 1.0 (0.8–1.2) | 1.2 (1.0–1.7) | 0.001 |
| SOFA score – median (percentile 25–75) | 4 (2–7) | 10 (5–13) | <0.001 |
NLR=neutrophil-to-lymphocyte ratio; SOFA=Sepsis-related Organ Failure Assessment.
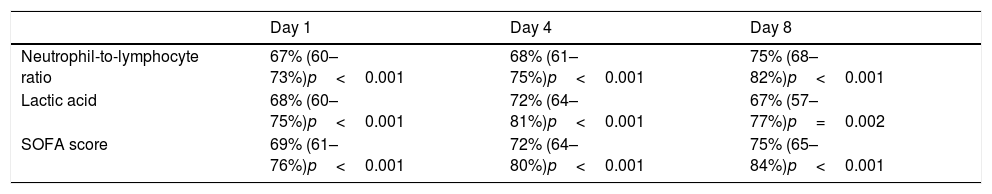
NLR on day one, day four, and day eight had an area under curve (95% confidence interval) for the prediction of 30-day mortality of 67% (60–73%, p<0.001), 68% (61–75%, p<0.001), and 75% (68–82%, p<0.001) respectively (Fig. 2, Table 3). No significant differences were found in AUC between NLR and lactic acid on day 1 (p=0.90), day 4 (p=0.44) and day 8 (p=0.26). Neither significant differences were found in AUC between NLR and SOFA at day 1 (p=0.77), day 4 (p=0.47) and day 8 (p=0.98).
 at day 1, 4 and 8 for prediction of mortality at 30 days. The area under curve of NLR at day 1, 4 and 8 for mortality prediction was between 67–75%.")
Thirty-day mortality prognostic capability of neutrophil-to-lymphocyte ratio, lactic acid and SOFA score at day first, fourth, and eighth of sepsis diagnosis. Data are showed as area under curve, 95% confidence interval and p-value.
| Day 1 | Day 4 | Day 8 | |
|---|---|---|---|
| Neutrophil-to-lymphocyte ratio | 67% (60–73%)p<0.001 | 68% (61–75%)p<0.001 | 75% (68–82%)p<0.001 |
| Lactic acid | 68% (60–75%)p<0.001 | 72% (64–81%)p<0.001 | 67% (57–77%)p=0.002 |
| SOFA score | 69% (61–76%)p<0.001 | 72% (64–80%)p<0.001 | 75% (65–84%)p<0.001 |
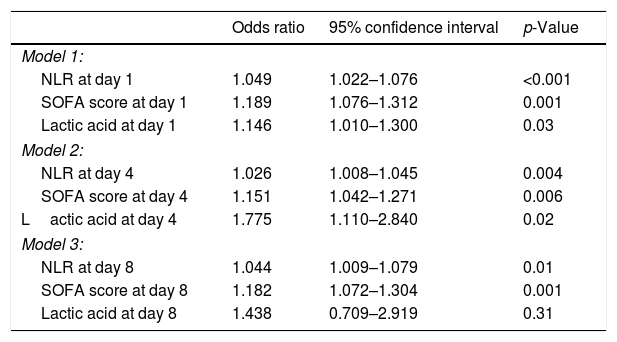
Multiple logistic regression analysis found an association between NLR on days one (p<0.001), four (p=0.004) and eight (p=0.01) of sepsis diagnosis and mortality controlling for SOFA and lactic acid in those days (Table 4). We found in the Kaplan–Meier that patients with NLR>12.1 had a higher rate of mortality (Hazard ratio=2.9; 95% CI=1.80–4.73; p<0.001) (Fig. 3).
Multiple logistic regression analysis models to predict 30-day mortality at day 1, 4 and 8 of sepsis evolution.
| Odds ratio | 95% confidence interval | p-Value | |
|---|---|---|---|
| Model 1: | |||
| NLR at day 1 | 1.049 | 1.022–1.076 | <0.001 |
| SOFA score at day 1 | 1.189 | 1.076–1.312 | 0.001 |
| Lactic acid at day 1 | 1.146 | 1.010–1.300 | 0.03 |
| Model 2: | |||
| NLR at day 4 | 1.026 | 1.008–1.045 | 0.004 |
| SOFA score at day 4 | 1.151 | 1.042–1.271 | 0.006 |
| Lactic acid at day 4 | 1.775 | 1.110–2.840 | 0.02 |
| Model 3: | |||
| NLR at day 8 | 1.044 | 1.009–1.079 | 0.01 |
| SOFA score at day 8 | 1.182 | 1.072–1.304 | 0.001 |
| Lactic acid at day 8 | 1.438 | 0.709–2.919 | 0.31 |
NLR=neutrophil-to-lymphocyte ratio; SOFA=sepsis-related organ failure assessment.
 lower or equal vs. higher than 12.1. Patients with NLR>12.1 had higher mortality rate.")
No significant differences in NLR were found regarding the development or not of septic shock (p=0.91) and the infection site (p=0.25). Neither significant differences in NLR were found when the microorganism responsible of sepsis was Gram-positive (p=0.65), Gram-negative (p=0.65), fungii (p=0.75), anaerobe (p=0.72) or unknown (p=0.94).
DiscussionThe main new findings from our study was the association between NLR in the first seven days of sepsis and mortality controlling for sepsis severity. Previously, an increase in NLR in non-survivors compared to surviving patients had been reported during the evolution10,11; but the association between NLR and mortality controlling for sepsis severity during the evolution of patients was not determined. Thus, we believed that the association between NLR in the first seven days of sepsis and mortality controlling for sepsis severity found in our study is a new and interesting finding. Other interesting findings of our study were the prognostic capability of NLR at days 1, 4 and 8, and that this capability was not different to lactic acid and SOFA in the same days.
The immune response is the reaction from the body to defend itself against foreign microorganisms (as viruses, bacteria, parasites, and fungi) which if not eliminated from the body could cause serious health problems. There are two types of immune response, the innate and the adaptive response, which work together for the protection against pathogens.15–19 The innate response is the first reaction to a foreign microorganism, is a quick and non-specific response to any type of pathogen. Components of the innate immune response include physical barriers (as skin and mucous membranes), immune cells (as neutrophils, macrophages and monocytes), and circulating factors (as cytokines and complement). The adaptive response is the second line of defense, it is a specific response against specific antigens, with generation of immunological memory and taking more time to activate the components involved. Components of the innate immune response include immune cells (T cell, and B cells) and circulating factors (antibodies that directly interact with the antigen). In the early stage of sepsis, the neutrophil count (fundamental components of innate immunity) increase rapidly, and there is a decreases in the lymphocyte count due to generalized lymphocyte apoptosis (which occurs in the spleen, thymus, and lymph nodes)20; thus, NLR increases in early stage of sepsis. Cell death in innate and adaptive immune systems benefits the host by downregulating inflammatory response in sepsis, but the extensive loss of immune cells may compromise the ability of the host to eliminate invading pathogens.20 We think that the association between NLR in the first seven days of sepsis and mortality that we found in this study could be in relation with a higher state of inflammation in the patients who die.
Our study has some limitations, such as that we have not registered NLR in other critically ill patients nor in healthy subjects. However, the objectives of this study were to determine whether an association between NLR in the first seven days of sepsis and mortality exists. We did not calculate the sample size, although an association was found between NLR and mortality controlling for sepsis severity in the three moments analyzed. In addition, the number of patients lost or excluded, and the delay time of antibiotic administration were not registered. Moreover, the bloodstream infection rate in our patients was low compared with other series (up to 40%).21
We think that the use of NLR, a simple laboratory parameter obtained during a conventional hemogram, could be standardized for the prediction of mortality in sepsis and its determination during the first 7 days could help in the estimation of prognosis.
ConclusionsThe new finding of our study was the association between NLR in the first seven days of sepsis and mortality controlling for sepsis severity.
FundingThis study was supported by a grant from Instituto de Salud Carlos III (PI-18-00500) (Madrid, Spain) and co-financed with Fondo Europeo de Desarrollo Regional (FEDER).
Conflicts of interestThe authors declare that they have no competing interests.
