


This paper presents results from the Spanish subpopulation of a study comparing Conversation Maps™ (CM)-based education with regular care (RC) in type 2 diabetes mellitus (T2DM).
Patients and methodsAdult patients with T2DM who were considered as not demonstrating ideal disease management were randomly assigned to CM or RC with assessments following (Visit 2), and at follow-up 6 months after (Visit 3), the final CM session. The primary endpoint was diabetes knowledge at Visit 3.
ResultsThree hundred and ten patients were randomized to receive CM education (n=148) or RC (n=162). Median knowledge scores were ranked significantly higher in the CM group than the RC group at Visit 2 and Visit 3 (p<0.001). No significant differences in clinical and other outcomes were identified between the interventions, except satisfaction with care (p<0.001, Visit 2; p=0.055, Visit 3) and perception of goal attainment (p<0.001 and p=0.046, respectively) that were both higher in the CM group.
ConclusionsIn these patients from Spain, CM was superior to RC in terms of diabetes knowledge 6 months after education was completed, suggesting that CM should be considered for use in patients requiring diabetes education.
Este artículo presenta los resultados de la subpoblación española de un estudio que compara una formación usando Mapas de Conversaciones™ (MC) con la atención habitual (AH) en pacientes con diabetes mellitus tipo 2.
Pacientes y métodosA pacientes adultos con diabetes mellitus tipo 2 que se consideró que no tenían un manejo ideal de su enfermedad se les asignó aleatoriamente a recibir MC o AH, realizando una evaluación inmediatamente después (visita 2) y otra a los 6 meses (visita 3) de la sesión final de los MC. La variable principal de valoración fue el conocimiento adquirido sobre la diabetes en la visita 3.
ResultadosParticiparon 310 pacientes a los que se asignó aleatoriamente a recibir una formación con MC (n=148) o AH (n=162). La mediana de la puntuación de conocimiento fue significativamente más elevada en el grupo MC que en el grupo AH tanto en la visita 2 como en la visita 3. No se identificaron diferencias significativas en las variables clínicas o de otra índole entre intervenciones, excepto en la satisfacción con el cuidado (visita 2, p<0,001; visita 3, p=0,055) y la percepción de consecución del objetivo (p<0,001 y p=0,046 respectivamente) que fueron ambas más elevadas en el grupo MC.
ConclusionesEn estos pacientes españoles, los MC fueron superiores a la AH en términos del conocimiento sobre la diabetes 6 meses después de completar la formación, por lo que los MC podrían ser una herramienta a considerar en pacientes que requieran una educación diabetológica.
Optimum metabolic control is essential to effectively prevent or delay complications related to diabetes.1,2 However, since patients are responsible for daily monitoring of their diabetes,3,4 it is crucial that they have a good understanding of the disease, its complications, and its management. Patient training is therefore considered an essential aspect of the modern care of diabetes,5,6
In recent years, a number of national and international organizations have provided guidelines for developing structured training for the self-management of the disease.5,7,8 They all recognize that complications arise because general interventions aimed at training in diabetes self-management have a number of interacting components which are often sensitive to local characteristics.
The immediate objective of a training program in diabetes self-management is to improve the patient's knowledge and understanding of this condition and, through this, to make the patient responsible for its control, so that by gradually improving diabetes care the patient may achieve a better clinical and health outcome in the long term.9,10
There is currently no national diabetes training and awareness program in Spain.11 There are, however, several diabetes self-management programs of variable scope, duration, content, and approach. Several reviews suggest that educational programs with a theoretical psychological, behavioral, or educational basis are associated with improved results.12,13 One which does have a solid theoretical basis is the educational tool Conversation Map™ (CM)–a recently developed educational program for the self-management of type 2 diabetes mellitus (T2DM).10
Training based on CM is intended to improve the decisions and actions related to self-management using tools based on conversation and focused on the patient to help people with T2DM understand and retain the information related to their disease.14 CM uses images, questions, data, and information to provide, through a facilitator, an interesting learning experience to small groups of patients with T2DM and their caregivers. CM tools were introduced in Canada in 2005, and have subsequently been provided to more than 40 countries worldwide. The UK Medical Research Council requires a randomized, comparative evaluation of educational initiatives in order to characterize the provision of cost-effective health care.15 This is the first randomized, comparative study of European CMs. The study objective was to assess the efficacy of training based on CMs as compared to regular care (RC) in Spain and Germany. This article provides a detailed analysis of data from the Spanish subpopulation of the study. The overall study results have been reported in another article.16
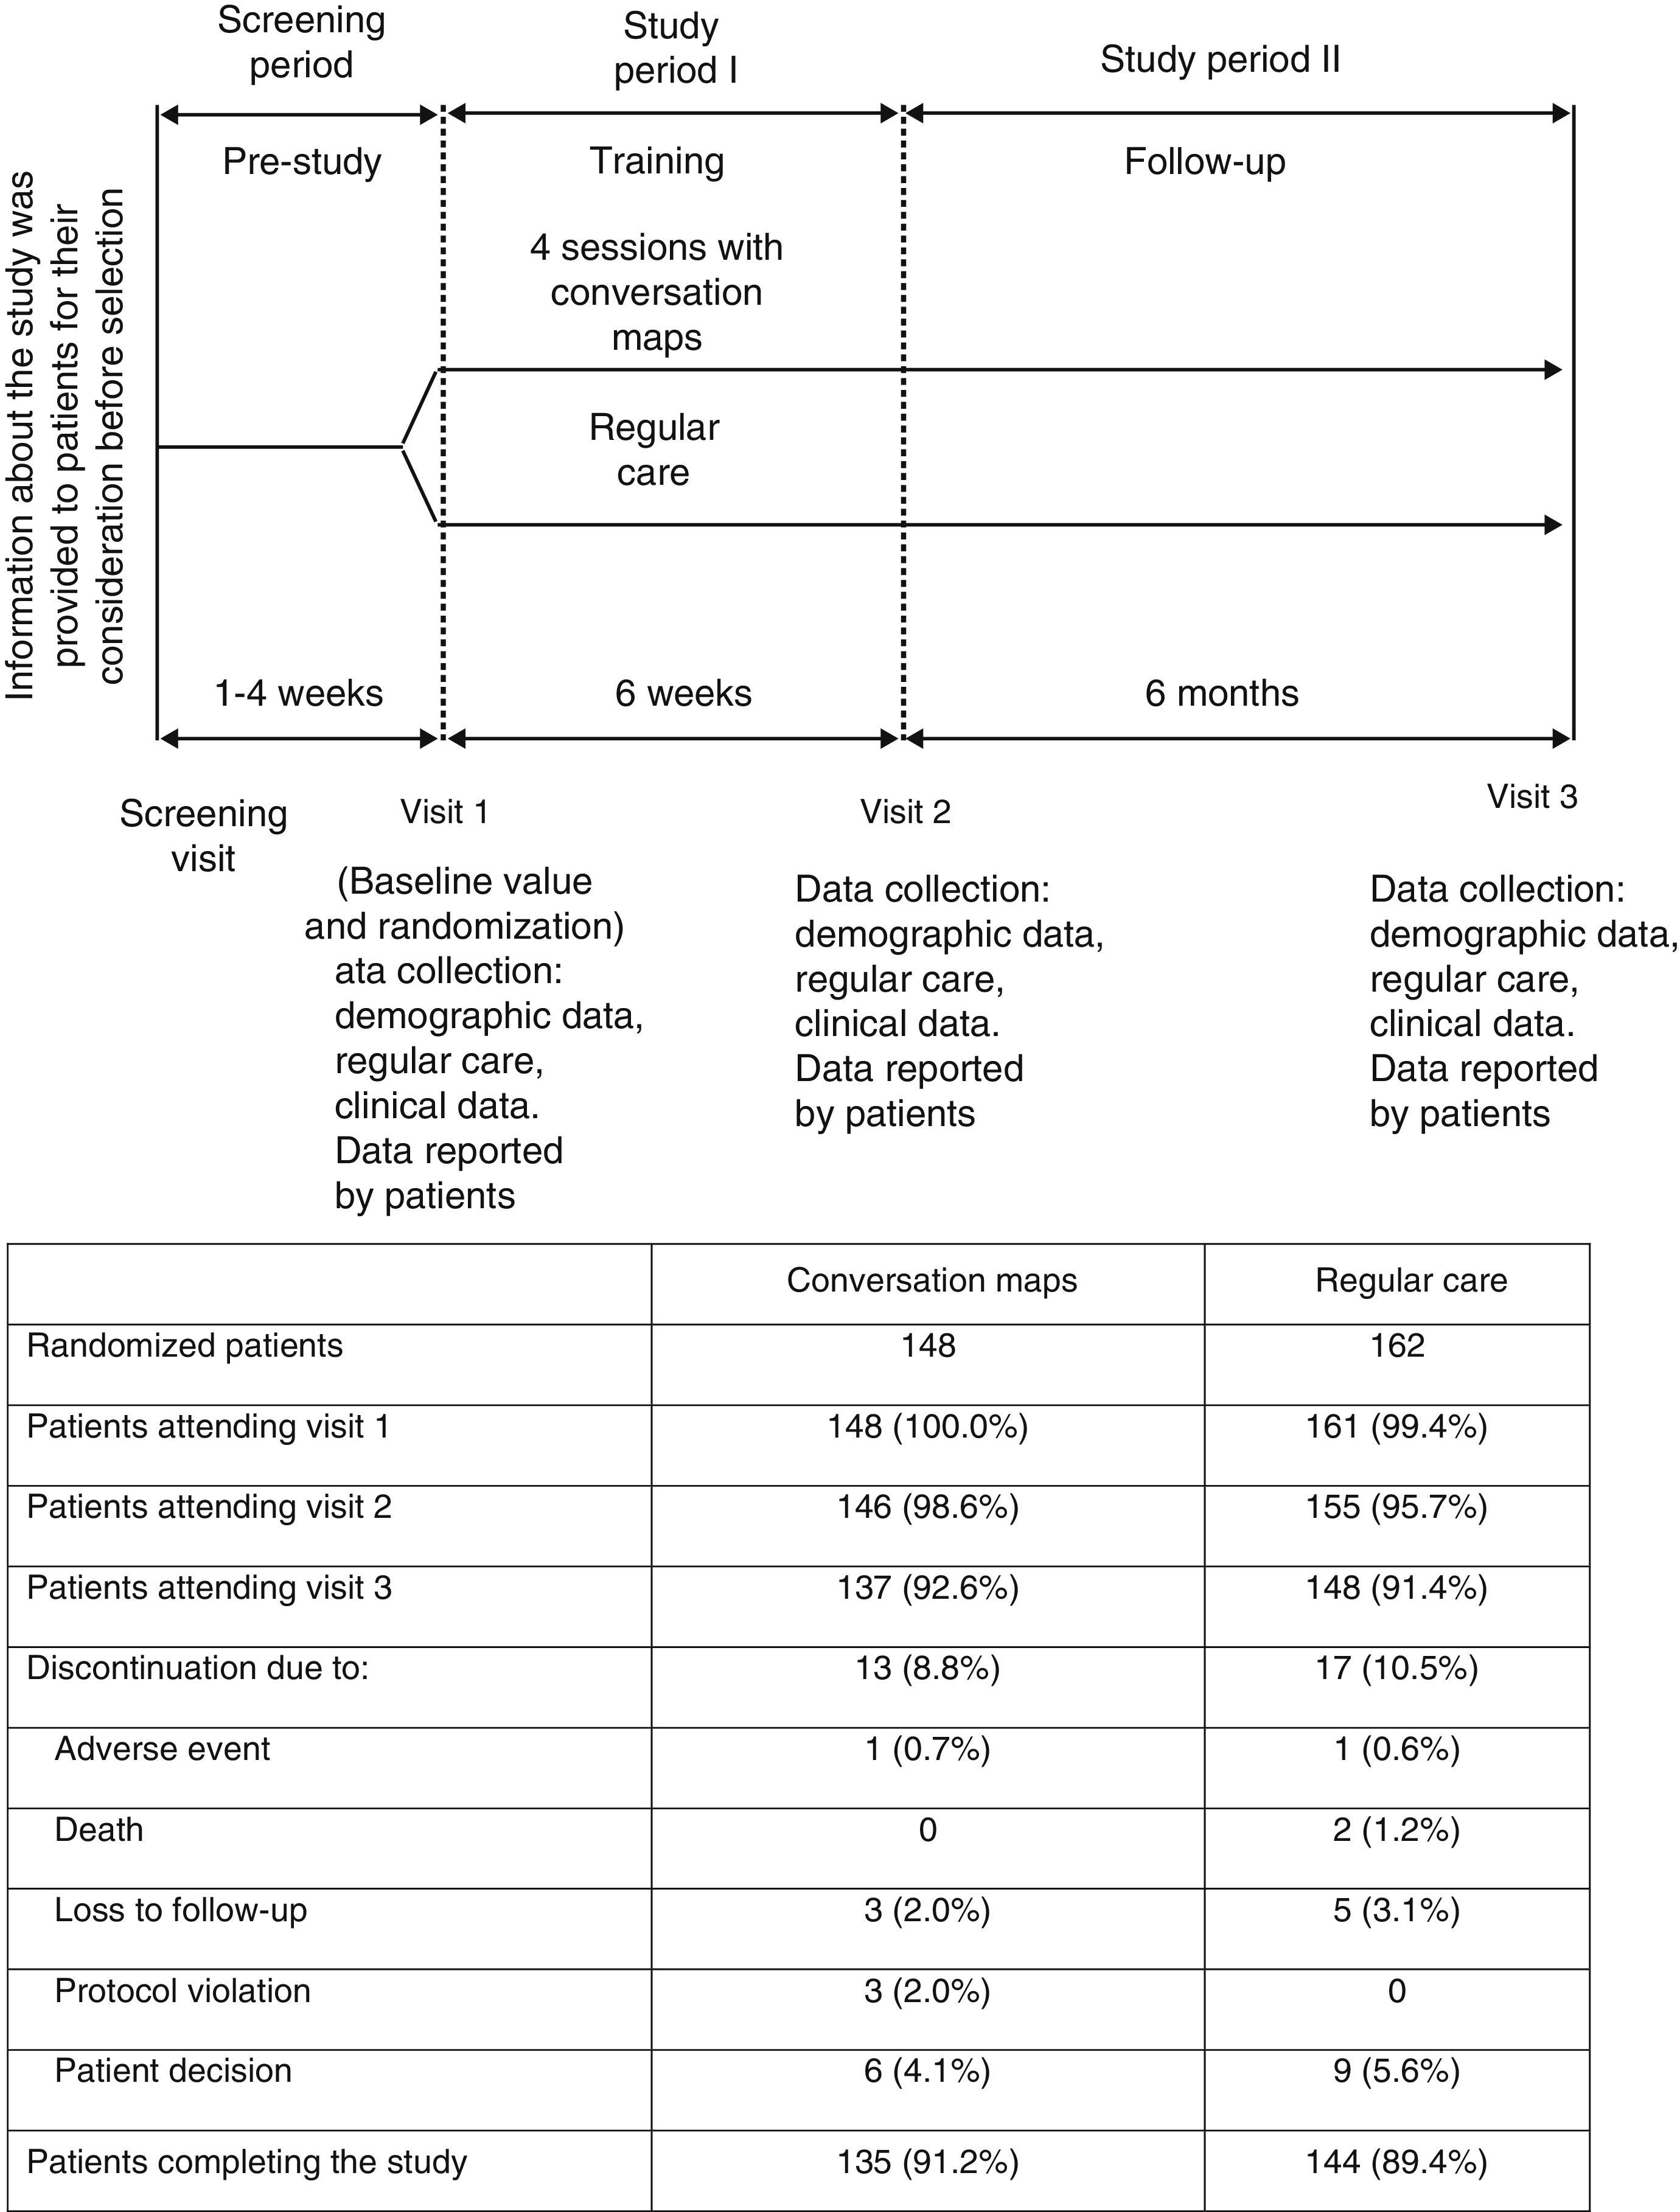
Patients and methodsStudy designThis was a 6-week randomized, open-label study with no drug intervention where outpatients were randomly assigned to receive CM or RC, with a 6-month follow-up after the final CM session (Fig. 1). Patients came from 14 primary care centers or hospitals experienced in the administration of CM sessions in Spain. At least 12 patients were enrolled in each center.

The patients were adults with T2DM aged 18–75 years who were considered by the healthcare professional (HCP) to have a suboptimal management of their disease, who needed to start or repeat a training process, and who had not previously participated in CM sessions. Through an interactive voice system, the patients were randomized, stratified by center, using a computer-generated random sequence to receive training with CM sessions provided by the center that enrolled them into the study or at routine visits to the HCP at the discretion of the latter, and which could include any training to be provided as part of their RC (control group).
All patients made three visits to the HCP over eight months (Fig. 1) to complete clinical assessments and answer questionnaires on patient-reported outcomes. End of study procedures (Visit 3) were performed on those patients who withdrew before study completion, and their reasons for withdrawal were recorded if known.
All patients signed a written informed consent to participate in the study and allow use of their data. The study was approved by the clinical research ethics committees of the participating centers in Spain and was conducted in compliance with the Declaration of Helsinki.
InterventionsPatients in the CM group were asked to attend four sessions (3–10 patients per session) with a duly trained facilitator. Each session lasted 2–3h, and the interval between sessions did not exceed two weeks, with a maximum interval of six weeks between the first and last sessions. If the patient did not attend at least two CM sessions, he/she was withdrawn from the study.
One of the four maps, in each case centered on a specific aspect, was used in each of the four sessions: living with diabetes, how diabetes works, healthy habits, and starting insulin treatment. Although the facilitator ran the discussions, patient interaction was encouraged, and the patients set their own objectives after each session. During the study, patients in the CM group continued to receive RC from HCPs, but did not follow any structured training program which could have been offered to them otherwise.
Patients in the RC group visited their HCPs as usual and received the instructions and training normally provided as part of their standard care. These patients attended their visits to HCPs according to the study design (Fig. 1), which allowed for the collection of specific study data. RC could include formal education other than programs based on CM, to be completed during the study period (Fig. 1).
ObjectivesThe primary objective was to compare the impact of training based on CM and RC on the knowledge of diabetes by patients with T2DM six months after the completion of their training (Visit 3). Secondary objectives included blood glucose control (HbA1c), body weight, behavior for diabetes self-management, physical and psychological well-being, and patient satisfaction with their care and with their achievement of personal therapeutic objectives.
Assessment criteriaThe primary assessment criterion was the Audit of Diabetes Knowledge (ADKnowl) questionnaire, specific for diabetes and designed to ascertain the essential knowledge of patients concerning diabetes and its management.17 The ADKnowl questionnaire consists of 138 items, and total scores range from 0 to 100, with higher scores indicating better knowledge.
Secondary clinical assessment criteria included HbA1c, lipid levels, body weight, body mass index/BMI), blood pressure and heart rate, current treatments for T2DM, and concomitant diseases. Patients recorded episodes of hyperglycemia in a diary.
To assess the outcomes perceived by patients (secondary endpoints), the following instruments were used: (a) the 28-item Michigan Diabetes Empowerment Scale (DES), a tool which is used to measure psychosocial efficacy related to diabetes as perceived by the patients themselves, scored from 1 to 5 (with higher scores indicating greater assumption of responsibility)18; (b) the Summary of Diabetes Self-Care Activities (SDSCA), which measures behavioral levels related to self-care and compliance with activities recommended by the physician for the previous seven days in five areas (diet, exercise, blood glucose control, foot care, and smoking), whose mean score ranges from 0 to 7 (higher scores indicate better results)19; (c) the EuroQoL-5D index (EQ-5D), standardized with United Kingdom coefficients (scores ranging from 0 to 1) and the 100-point visual analog scale assessing the state of health (physical and psychological well-being) (higher scores indicate better health)20; and (d) the Problem Areas in Diabetes (PAID) scale, which measures the emotional distress of patients using a 5-point scale, with final scores ranging from 0 to 100 (higher scores indicate greater emotional distress).21
Satisfaction with care was assessed based on answers to the questions “What has been your degree of satisfaction with the information you have received about your diabetes in the five years prior to this study or since your diagnosis (whichever is shorter)?” (Visit 1)/“What is your degree of satisfaction with the information you have received about your diabetes since the last study visit?” (subsequent visits). Answers were given using a 1–7 point scales, with higher scores indicating greater satisfaction. Perception of goal achievement was assessed using the answers to the question “To what extent have you achieved what you wanted (with regard to your diabetes) during this study?” in the last two visits. Answers were given using a 1–7 point scale, with higher scores indicating greater satisfaction.
Data were collected at study start, immediately after the last CM session (Visit 2), and six months after the last session (Visit 3; Fig. 1). A safety follow-up was performed, and adverse events occurring during the study were recorded.
StatisticsSix hundred and fifty patients were enrolled into the study, to ensure that 500 participants would complete the post-education period (250 in Germany and 250 in Spain). This provided a 90% statistical power to see a significant difference between the CM and RC groups at a 5% level, assuming that the actual probability that scores were higher in a given group was 58.5%. Efficacy analysis were performed on the whole analysis group, including data from all randomized participants; missed data in the questionnaires were managed as instructed by the authors of the questionnaires, and no imputation of missing values was made for clinical variables.
All statistical tests were two-tailed with a 5% significance level, and no adjustments were made for multiple comparisons. Tools to assess patient reported outcomes were scored according to scoring algorithms published and were summarized using nonparametric measures (median, interquartile range [IQR]).
For the primary analysis, total ADKnowl scores at the 6-month post-training visit (Visit 3) were compared using the rank sum test with two Wilcoxon–Mann–Whitney tests. Nonparametric analyses of covariance (ANCOVA) were used to calculate the effect of intervention (CM/RC) on ADKnowl scores at the final visit; other explanatory variables included: type of care (family physician/specialist), ADKnowl score at study start, years since diagnosis of T2DM, PAID score at study start, HbA1c at study start, and when the final visit occurred.
HbA1c values were assessed using Wilcoxon rank sum tests and mixed models of repeated measures, using an unstructured covariance matrix with the following covariates: HbA1c category at study start, antidiabetic drug class, country, visit, deviation from visit interval, PAID score at study start, ADKnowl score at study start; time since diagnosis; intervention (CM/RC), and visit*antidiabetic drug class and intervention*visit interaction terms. In addition, patients were grouped by antidiabetic drug class as a random effect. Weight/BMI was analyzed at six months using ANCOVA with the following covariates: BMI and HbA1c at study start, waist circumference, antidiabetic medication, country, PAID score at study start, time since diagnosis, and intervention (CM/RC).
DES, EQ-5D, and PAID scores were compared between the intervention groups using Wilcoxon rank sum tests. Satisfaction with care and goal achievement were summarized as n (%) for each intervention, and were compared using a Fisher's exact test and a Pearson's Chi-square test respectively.
The proportions of participants who reported severe hypoglycemia, participants very satisfied with care (score of 6 or 7), and participants with high goal achievement (score of 6 or 7) were compared using a Chi-square test or a Fisher's exact test as appropriate.
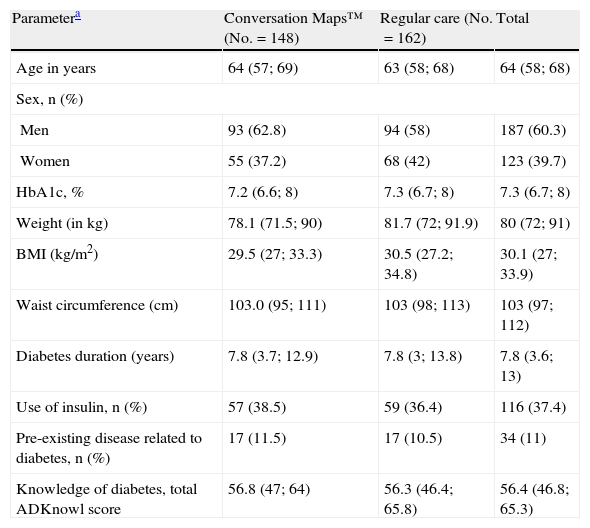
ResultsPatient distributionIn Spain, 310 patients were randomized to receive training with CM (n=148) or RC (n=162) from September 2009 to November 2010 (Fig. 1). Nineteen HCPs with a median (IQR) experience in diabetes education of 100 (24, 240) months participated in the study. Of these, 12 were nurses who specialized in diabetes, four were diabetes educators, and three were family physicians. A total of 285 patients completed the post-training assessment at Visit 3 (91.9%) (Fig. 1). Table 1 summarizes the demographic characteristics and other data of patients at study start.
Demographic data and characteristics of patients at study start.
| Parametera | Conversation Maps™ (No.=148) | Regular care (No.=162) | Total |
| Age in years | 64 (57; 69) | 63 (58; 68) | 64 (58; 68) |
| Sex, n (%) | |||
| Men | 93 (62.8) | 94 (58) | 187 (60.3) |
| Women | 55 (37.2) | 68 (42) | 123 (39.7) |
| HbA1c, % | 7.2 (6.6; 8) | 7.3 (6.7; 8) | 7.3 (6.7; 8) |
| Weight (in kg) | 78.1 (71.5; 90) | 81.7 (72; 91.9) | 80 (72; 91) |
| BMI (kg/m2) | 29.5 (27; 33.3) | 30.5 (27.2; 34.8) | 30.1 (27; 33.9) |
| Waist circumference (cm) | 103.0 (95; 111) | 103 (98; 113) | 103 (97; 112) |
| Diabetes duration (years) | 7.8 (3.7; 12.9) | 7.8 (3; 13.8) | 7.8 (3.6; 13) |
| Use of insulin, n (%) | 57 (38.5) | 59 (36.4) | 116 (37.4) |
| Pre-existing disease related to diabetes, n (%) | 17 (11.5) | 17 (10.5) | 34 (11) |
| Knowledge of diabetes, total ADKnowl score | 56.8 (47; 64) | 56.3 (46.4; 65.8) | 56.4 (46.8; 65.3) |
HbA1c: hemoglobin A1c; ADKnowl: Audit of Diabetes Knowledge Questionnaire; BMI: body mass index; IQR: interquartile range; No.: total number of participants; n: number of participants in each group.
A majority of patients had received advice on diet and exercise before they began their participation in this study (89.2% in the CM group and 88.9% in the RC group). In the five years before study entry, 4.1% of the participants from the CM group and 3.1% of the participants from the RC group had used structured training programs, and 21 patients from the RC group (13.5% of the 155 patients) used them during the 6-week training period of the study. One hundred and forty patients (94.6%) from the CM group attended at least three CM sessions, and 123 patients (83.1%) attended all four sessions. As required by the protocol, no patient from any group received structured training during the follow-up period.
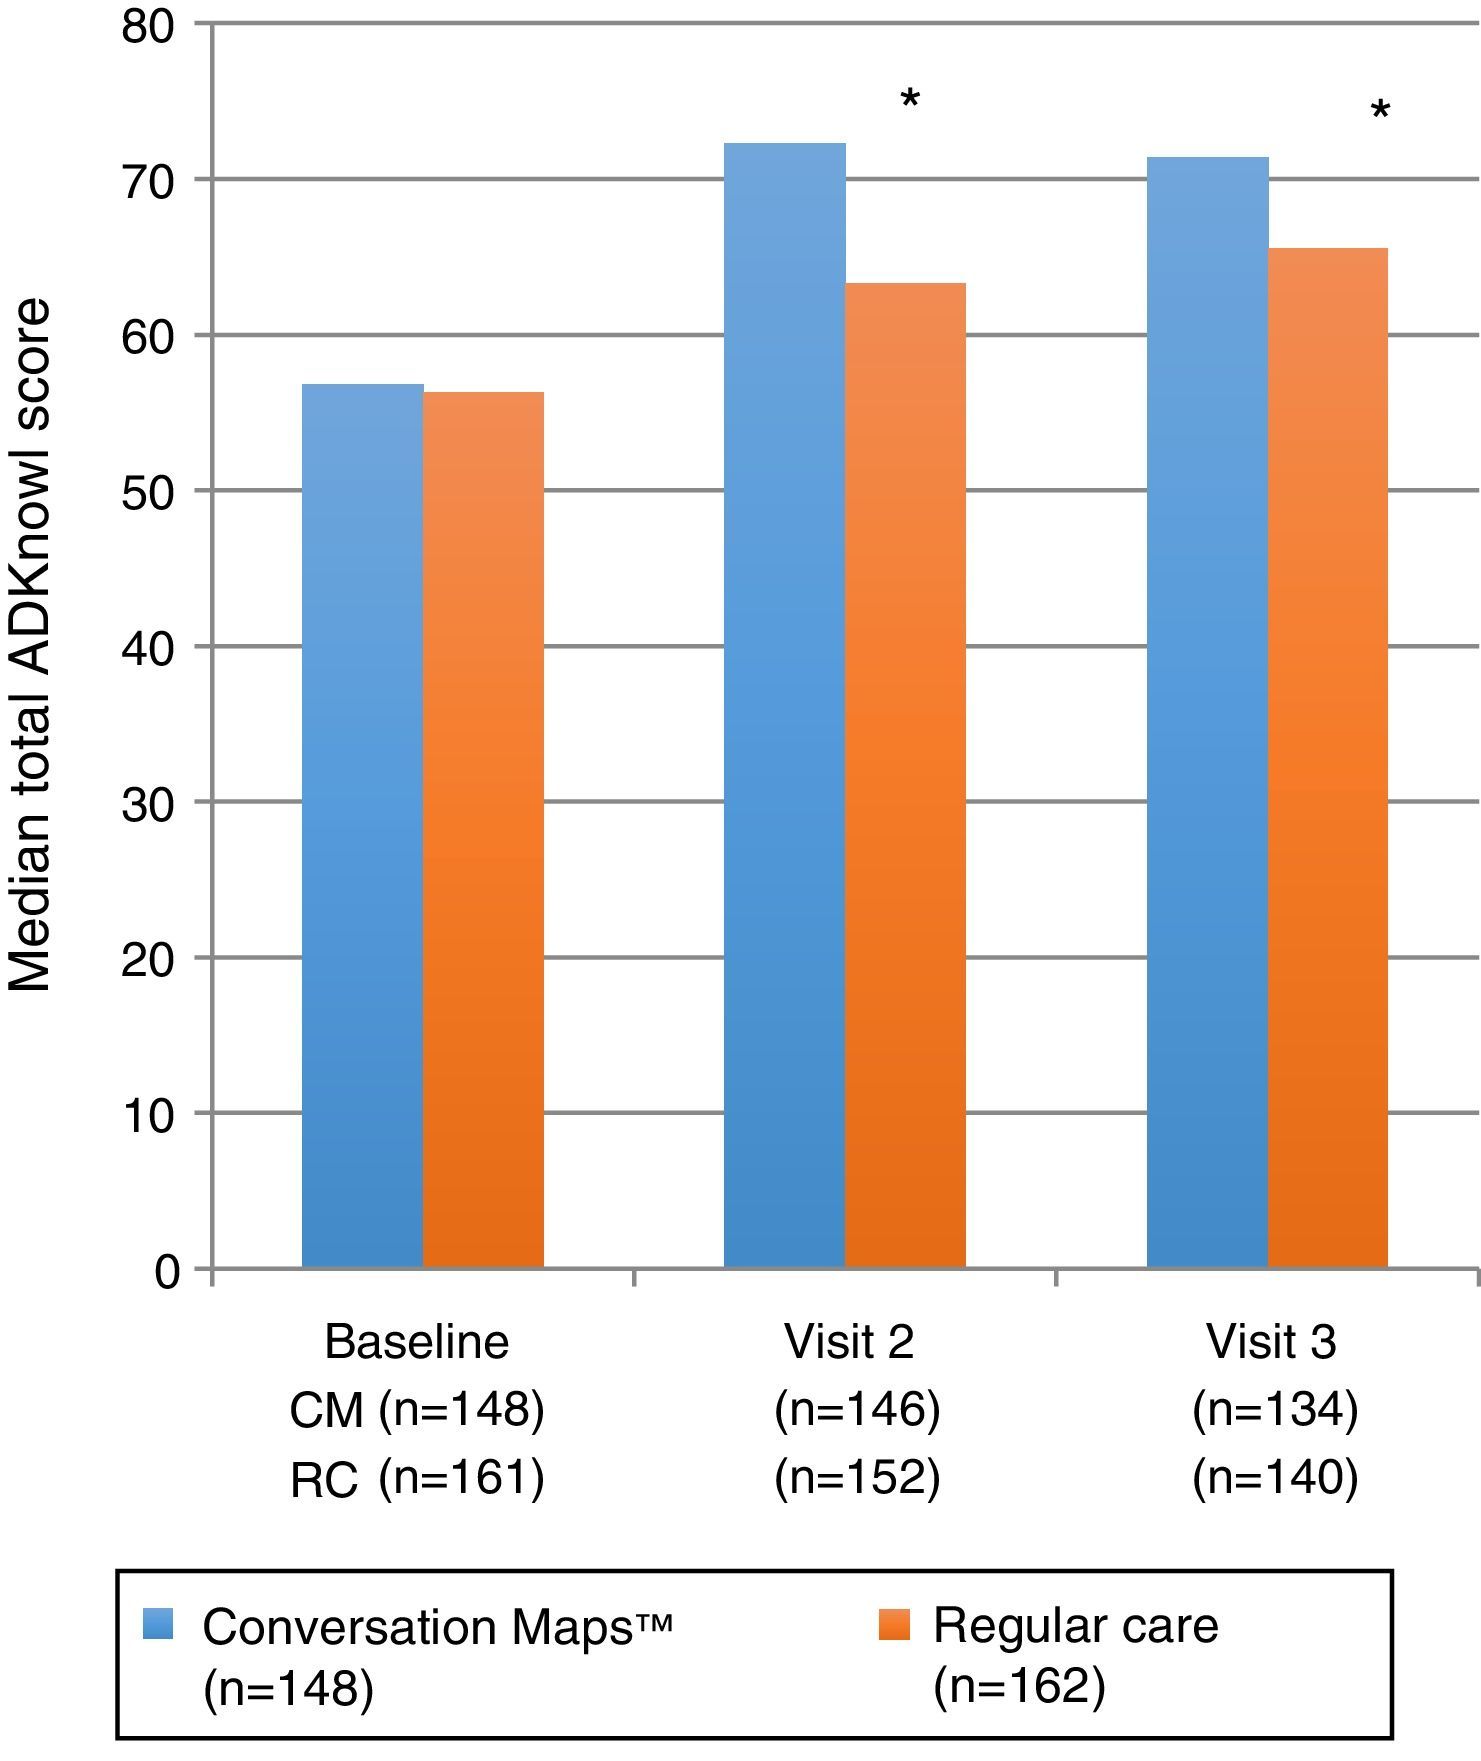
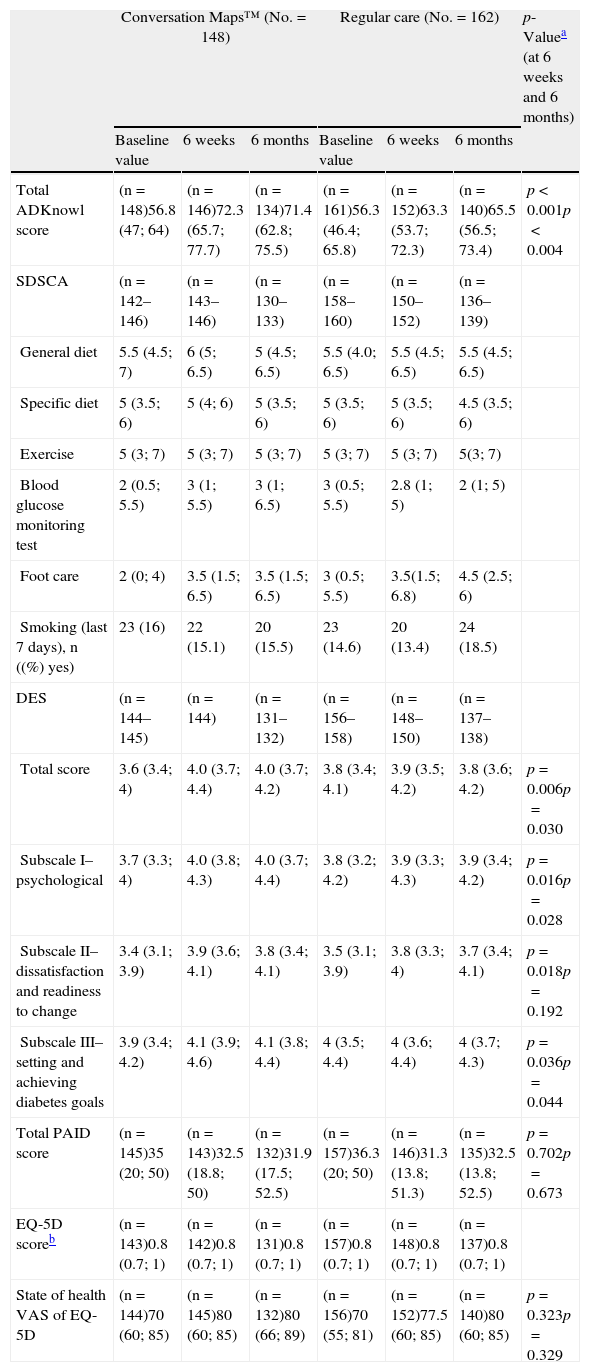
Primary endpoint: knowledge of diabetesTotal ADKnowl scores significantly increased as compared to study start in both groups, both at the 6-week visit and at the 6-month visit (p<0.001 for both groups). Scores were significantly higher in the CM group as compared to the RC group (Table 2 and Fig. 2; p<0.001 for both). Median (IQR) change in total ADKnowl scores was also greater in the group given training with CM than in the RC group at both visits (p<0.001 for both comparisons). Nonparametric ANCOVA models showed that, after adjustment of the initial covariates, the results were consistent with those obtained with the unadjusted analysis.
Median scores of patient reported outcomes at study start and after 6 weeks and 6 months of training with Conversation Maps for diabetes or regular care in patients with type 2 diabetes mellitus.
| Conversation Maps™ (No.=148) | Regular care (No.=162) | p-Valuea (at 6 weeks and 6 months) | |||||
| Baseline value | 6 weeks | 6 months | Baseline value | 6 weeks | 6 months | ||
| Total ADKnowl score | (n=148)56.8 (47; 64) | (n=146)72.3 (65.7; 77.7) | (n=134)71.4 (62.8; 75.5) | (n=161)56.3 (46.4; 65.8) | (n=152)63.3 (53.7; 72.3) | (n=140)65.5 (56.5; 73.4) | p<0.001p<0.004 |
| SDSCA | (n=142–146) | (n=143–146) | (n=130–133) | (n=158–160) | (n=150–152) | (n=136–139) | |
| General diet | 5.5 (4.5; 7) | 6 (5; 6.5) | 5 (4.5; 6.5) | 5.5 (4.0; 6.5) | 5.5 (4.5; 6.5) | 5.5 (4.5; 6.5) | |
| Specific diet | 5 (3.5; 6) | 5 (4; 6) | 5 (3.5; 6) | 5 (3.5; 6) | 5 (3.5; 6) | 4.5 (3.5; 6) | |
| Exercise | 5 (3; 7) | 5 (3; 7) | 5 (3; 7) | 5 (3; 7) | 5 (3; 7) | 5(3; 7) | |
| Blood glucose monitoring test | 2 (0.5; 5.5) | 3 (1; 5.5) | 3 (1; 6.5) | 3 (0.5; 5.5) | 2.8 (1; 5) | 2 (1; 5) | |
| Foot care | 2 (0; 4) | 3.5 (1.5; 6.5) | 3.5 (1.5; 6.5) | 3 (0.5; 5.5) | 3.5(1.5; 6.8) | 4.5 (2.5; 6) | |
| Smoking (last 7 days), n ((%) yes) | 23 (16) | 22 (15.1) | 20 (15.5) | 23 (14.6) | 20 (13.4) | 24 (18.5) | |
| DES | (n=144–145) | (n=144) | (n=131–132) | (n=156–158) | (n=148–150) | (n=137–138) | |
| Total score | 3.6 (3.4; 4) | 4.0 (3.7; 4.4) | 4.0 (3.7; 4.2) | 3.8 (3.4; 4.1) | 3.9 (3.5; 4.2) | 3.8 (3.6; 4.2) | p=0.006p=0.030 |
| Subscale I–psychological | 3.7 (3.3; 4) | 4.0 (3.8; 4.3) | 4.0 (3.7; 4.4) | 3.8 (3.2; 4.2) | 3.9 (3.3; 4.3) | 3.9 (3.4; 4.2) | p=0.016p=0.028 |
| Subscale II–dissatisfaction and readiness to change | 3.4 (3.1; 3.9) | 3.9 (3.6; 4.1) | 3.8 (3.4; 4.1) | 3.5 (3.1; 3.9) | 3.8 (3.3; 4) | 3.7 (3.4; 4.1) | p=0.018p=0.192 |
| Subscale III–setting and achieving diabetes goals | 3.9 (3.4; 4.2) | 4.1 (3.9; 4.6) | 4.1 (3.8; 4.4) | 4 (3.5; 4.4) | 4 (3.6; 4.4) | 4 (3.7; 4.3) | p=0.036p=0.044 |
| Total PAID score | (n=145)35 (20; 50) | (n=143)32.5 (18.8; 50) | (n=132)31.9 (17.5; 52.5) | (n=157)36.3 (20; 50) | (n=146)31.3 (13.8; 51.3) | (n=135)32.5 (13.8; 52.5) | p=0.702p=0.673 |
| EQ-5D scoreb | (n=143)0.8 (0.7; 1) | (n=142)0.8 (0.7; 1) | (n=131)0.8 (0.7; 1) | (n=157)0.8 (0.7; 1) | (n=148)0.8 (0.7; 1) | (n=137)0.8 (0.7; 1) | |
| State of health VAS of EQ-5D | (n=144)70 (60; 85) | (n=145)80 (60; 85) | (n=132)80 (66; 89) | (n=156)70 (55; 81) | (n=152)77.5 (60; 85) | (n=140)80 (60; 85) | p=0.323p=0.329 |
ADKnowl: Audit of Diabetes Knowledge Questionnaire; DES: Diabetes Empowerment Scale; VAS: visual analog scale; EQ-5D: EuroQoL-5D; IQR: interquartile range; No.: total number of participants; n: number of participants in each group; PAID: Problem Areas in Diabetes; SDSCA: Summary of Diabetes Self-Care Activities.
Values are medians (IQR) unless otherwise stated.
 questionnaire at study start and after 6 weeks and 6 months of training using Conversation Maps™ for diabetes (CM) or regular care (RC). *p<0.001 between both interventions.")
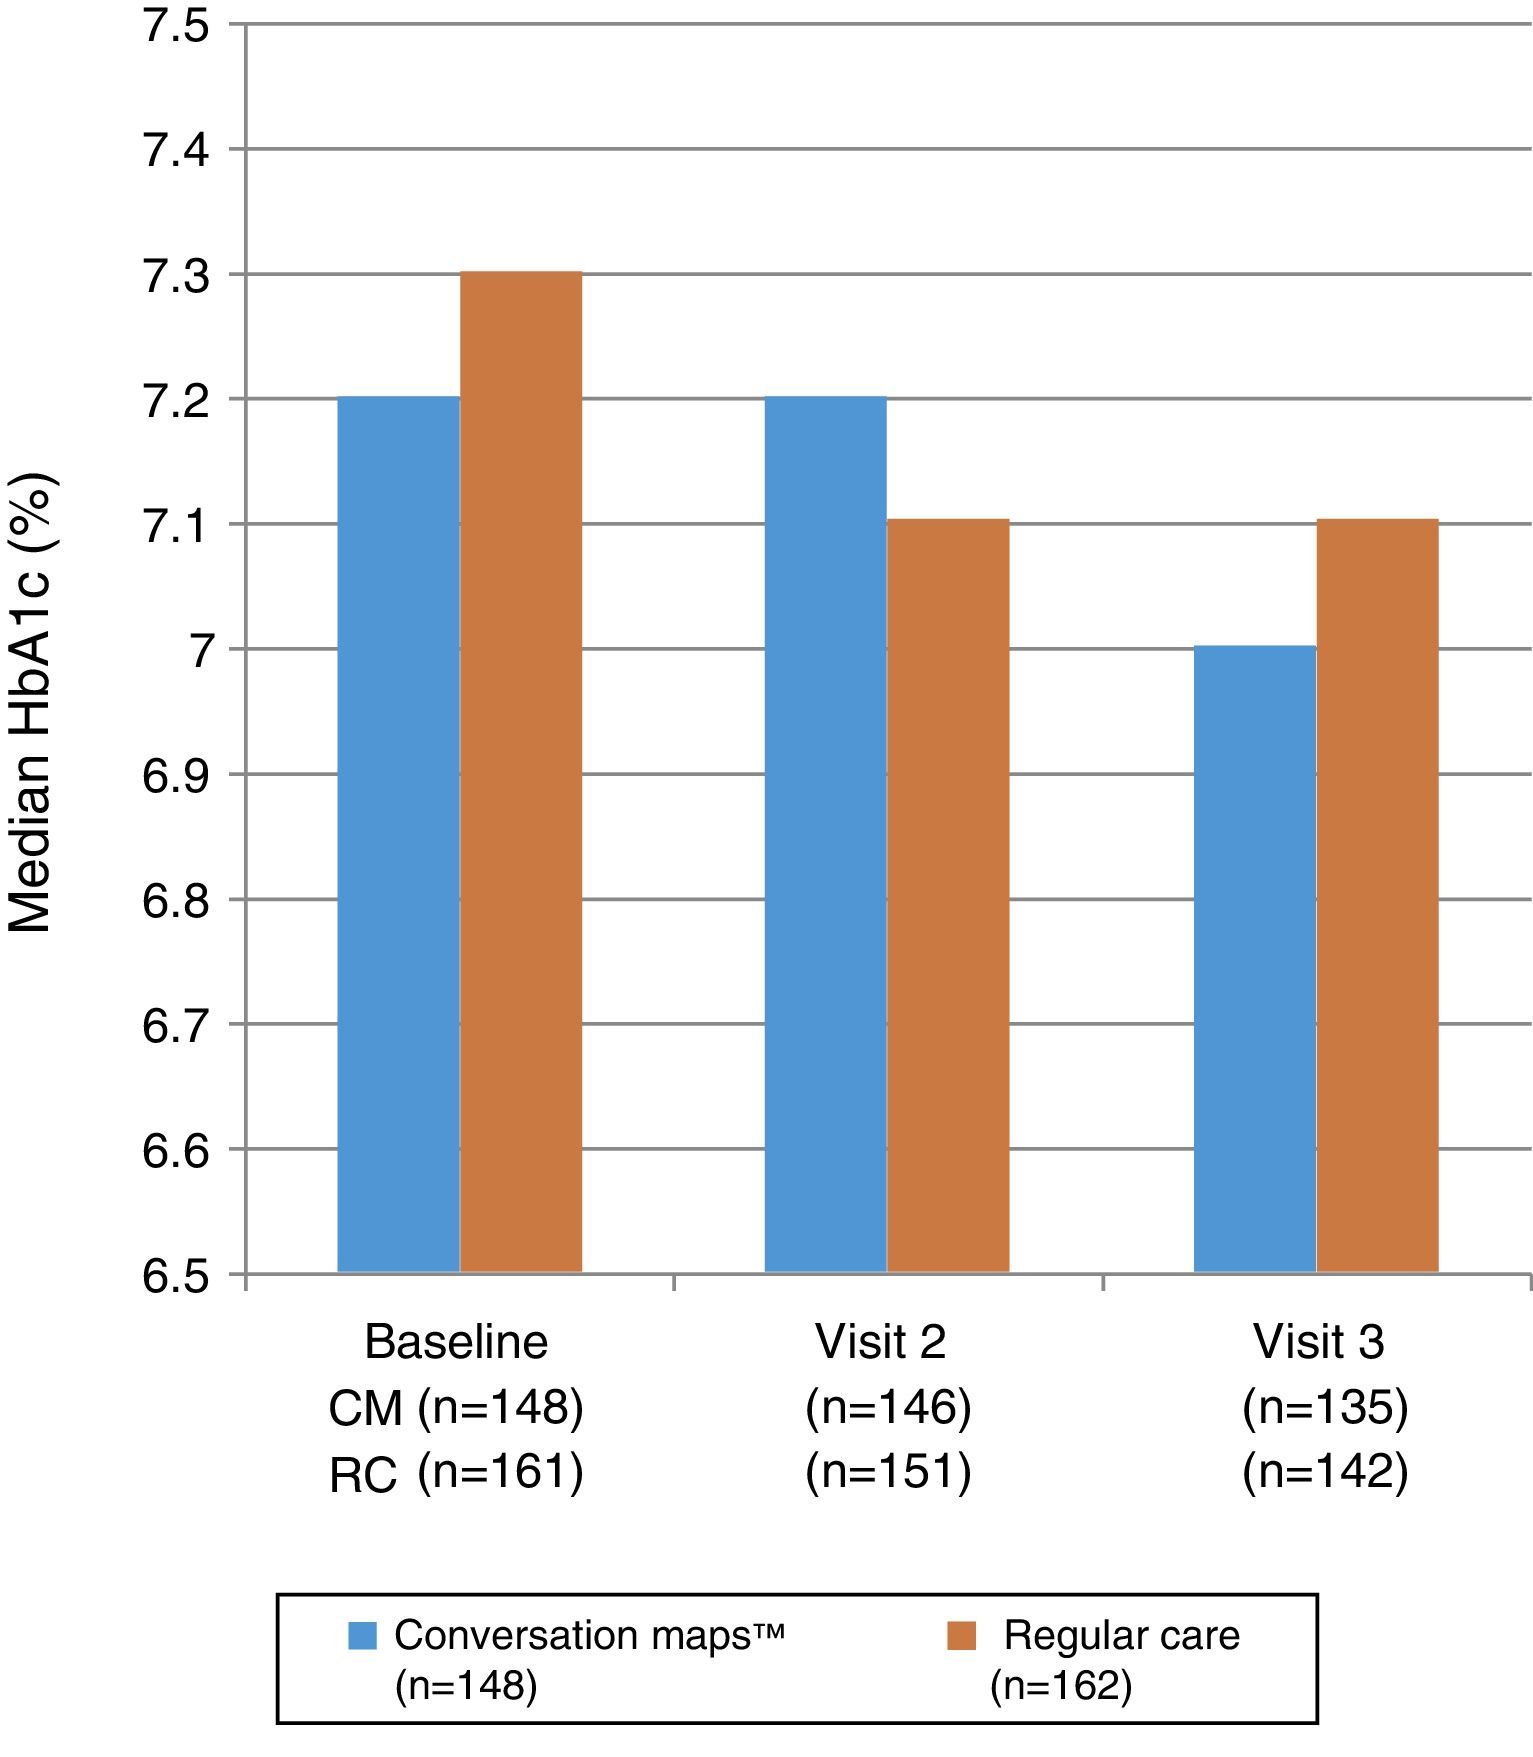
Fig. 3 shows the median HbA1c values at study start and at Visits 2 and 3. No statistically significant differences were seen between the groups at Visit 2 (p=0.985) or Visit 3 (p=0.555). Mixed-model analysis of repeated measures of change in HbA1c values in the CM and RC groups showed no significant difference at any visit (p=0.644 and p=0.486 respectively). Median (IQR) decrease in HbA1c values from study start to Visit 3 was −0.1 (−0.5; 0.2)% and −0.1 (−0.7; 0.3)% in the CM and RC groups respectively (p<0.05 for both). At Visit 3, 34.3% of the 135 evaluable patients in the CM group and 29.7% of the 142 evaluable patients in the RC group achieved the goal of HbA1c≤6.5%; the respective proportions of patients in each group with an HbA1c value≤7.5% were 65.7% and 58.8%.
 or regular care (RC).")
The proportion of patients who reported severe hypoglycemia was <5% in both groups at study start (CM: 2.8%; RC: 0.7%) and continued to be less than 5% in the CM group at Visit 2 (3.5%) and Visit 3 (4.6%). The proportion of patients affected also remained low in the RC group at Visit 2 (5.3%; p=0.438 versus the CM group) and Visit 3 (2.9%; p=0.533 versus the CM group). A single patient (from the CM group) experienced treatment-emergent hypoglycemia.
There were no clinically relevant differences between the CM and RC groups regarding median BMI, weight, waist circumference, diastolic and systolic blood pressure, heart rate, or lipid levels at study start or at subsequent visits. Changes seen in these parameters were nonsignificant during the study in both groups.
Less than 4% of patients in either group experienced adverse events occurring during the study and related to T2DM, and no patient reported an event that could be related to a study procedure.
Patient reported outcomesTable 2 shows fluctuations in scores of the different domains (diet, exercise, blood glucose level, foot care, and smoking) of SDSCA during the study.
Table 2 also summarizes the changes from study start in total and PAID subscale scores and in EQ-5D and VAS scores reported at Visits 2 and 3. No significant differences between the groups were seen in any of the three timepoints. Total DES scores were significantly higher after CM as compared to RC at both post-intervention visits, and subscale scores also significantly favored CM at one or both visits (Table 2). Change in total DES score from study start to Visit 2 (p=0.001) and Visit 3 (p=0.011) was significantly greater with CM as compared to RC.
Satisfaction with care was significantly greater in the CM group as compared to the RC group at the end of the 6-week intervention period, Visit 2 (p<0.001; Fig. 4.
 or regular care (RC). Categories 6 or 7 indicate greater satisfaction.")
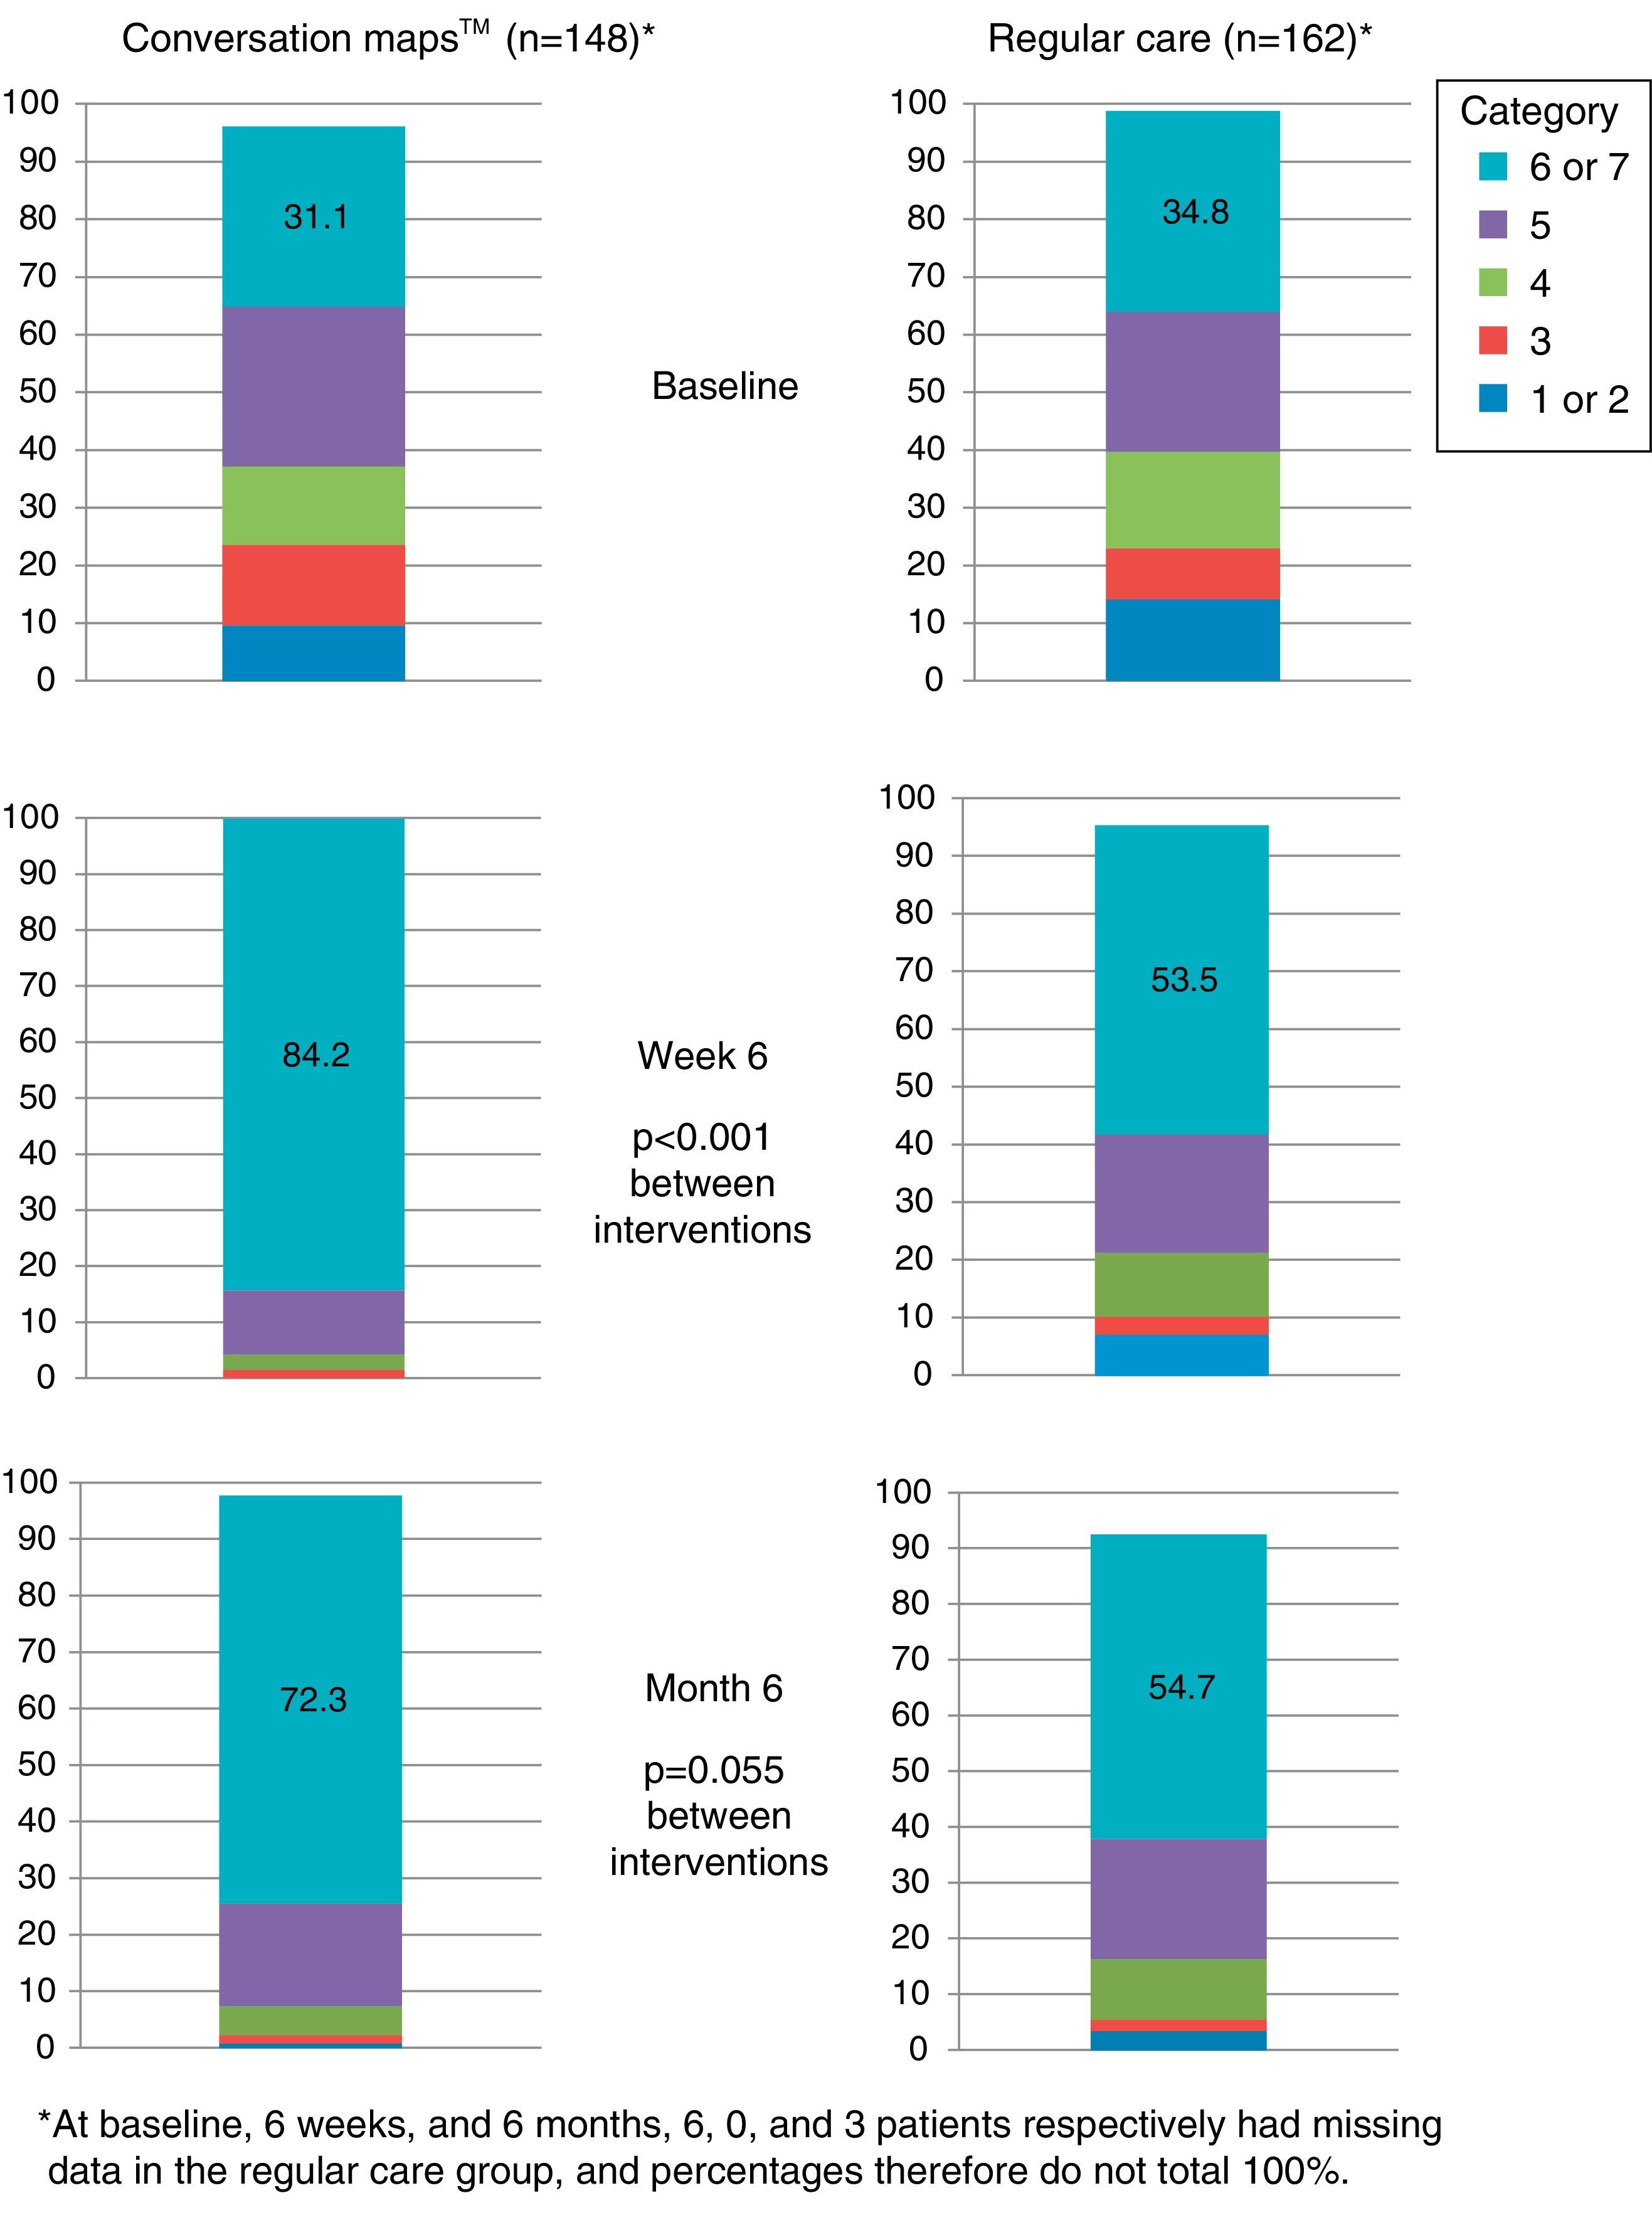
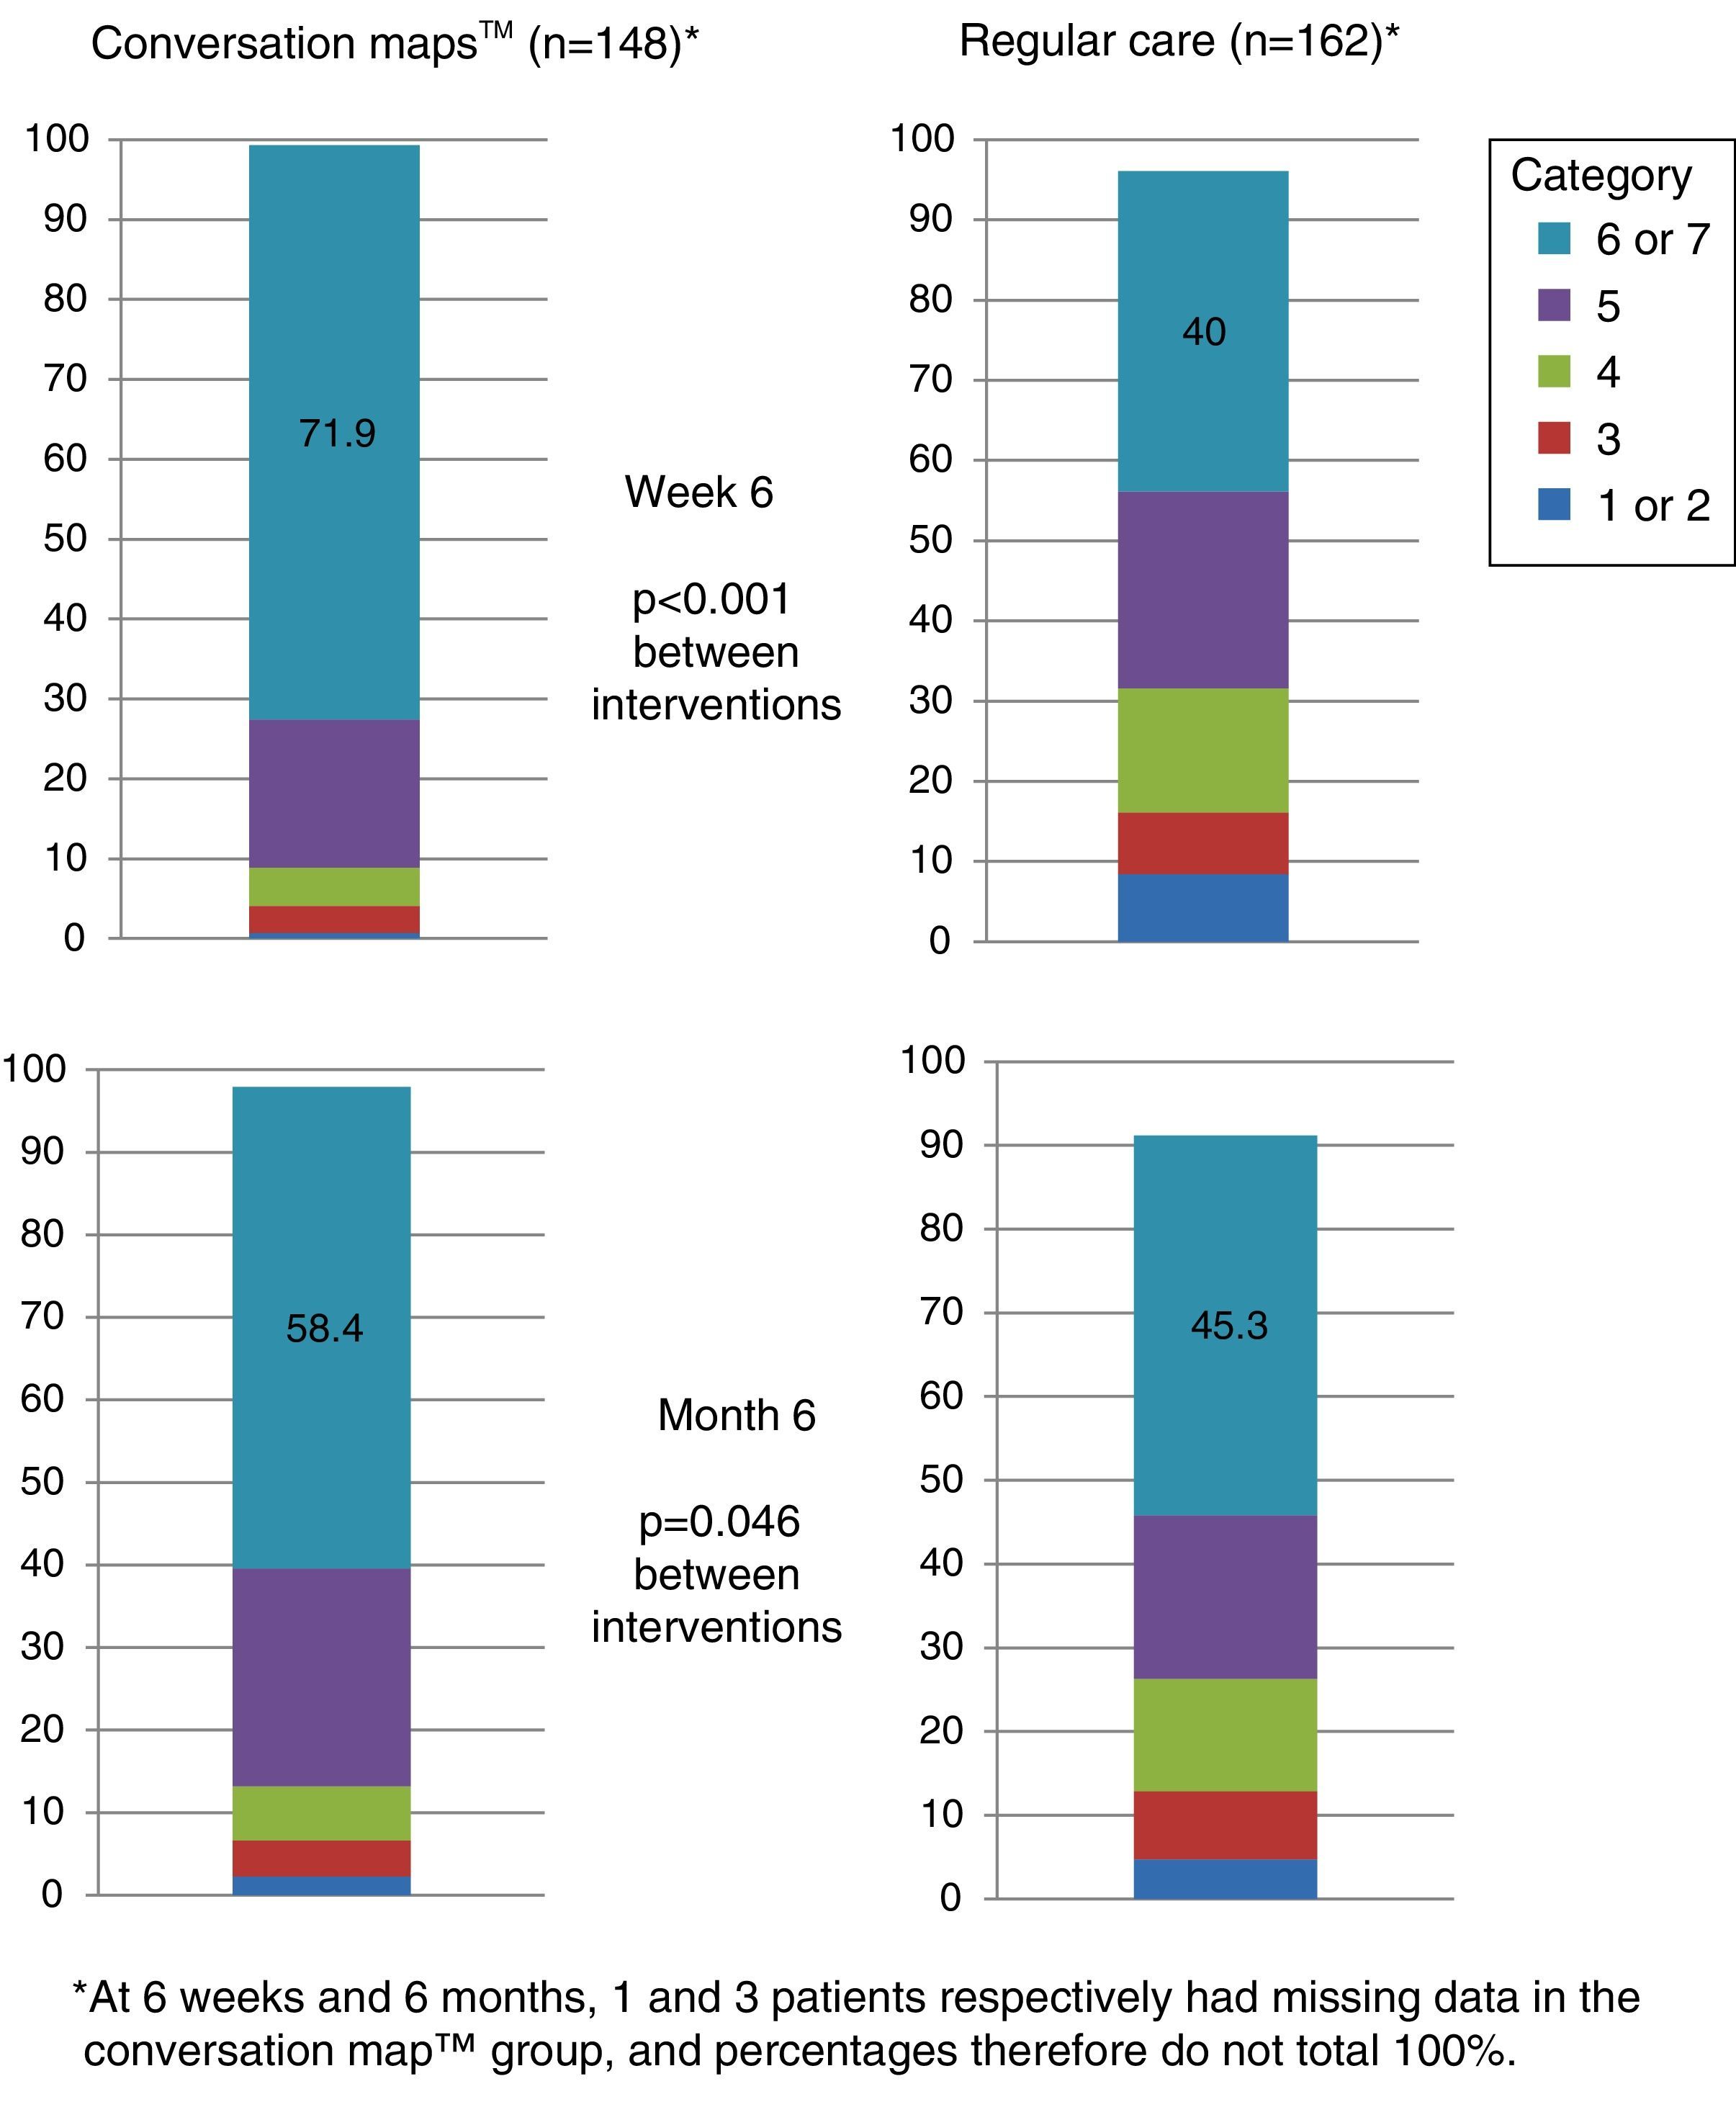
More than half the patients who received training based on CM felt that they had achieved their goals at six months. Patients who received training based on CM were more prone to have a higher goal achievement evaluation than patients in the RC group at both visits (Visit 2, p<0.001 and Visit 3, p=0.046; Fig. 5).
 or regular care (RC). Category 1 indicates that the patient did not achieve what he/she wanted at all; category 7 indicates that the patient achieved all that he/she wanted.")
Perception of goal achievement of patients with type 2 diabetes mellitus at study start and after 6 weeks and 6 months of training using Conversation Maps™ for diabetes (CM) or regular care (RC). Category 1 indicates that the patient did not achieve what he/she wanted at all; category 7 indicates that the patient achieved all that he/she wanted.
This is the first randomized study conducted in Europe to assess the efficacy of training based on CMs as compared to RC in patients with T2DM.
Since the immediate objective of training is to improve knowledge and understanding of diabetes, CM-based training was mainly assessed in our study in regard to diabetes knowledge. Prior research had shown that changes in behavior, and ultimately in clinical results, is unlikely unless patients know something about their disease and understand what should be changed and how.9 In Spanish patients with T2DM, diabetes knowledge improved in both groups (CM versus RC), but was greater in the CM group six months after the completion of training. A number of trials evaluating other programs or tools for patients with T2DM also suggest that diabetes education improves patient self-knowledge, with the benefits being sustained for up to five years in some cases.22–24 However, disease knowledge per se is probably not sufficient to induce clinical improvement, and no difference related to this variable was seen between both groups at six months, in agreement with reports from other studies.22–25 It should be noted that, based on the low HbA1c levels at the start of our study, it appears likely that HCPs were sending participants “with training needs” for reasons other than blood glucose control (e.g. treatment noncompliance, lack of responsibility for self-care, or future insulinization), which may have decreased the capacity of our study to show significant differences between the two interventions regarding this clinical assessment criterion.
The results of an observational study suggest that patients with T2DM of shorter duration achieve greater HbA1c decreases or are more likely to achieve control of HbA1c than other patients.26 In this study, median diabetes duration was 7.8 years, and median patient age was 64 years. In addition, 38.5% of patients in the CM group and 36.4% of those in the RC group were receiving insulin at study start.
Prior research had shown that, in patients with T2DM, group education on diabetes self-management may improve psychosocial and lifestyle variables as compared to standard care, even in the absence of Hb1Ac reduction.22–24,27 In this study, both groups experienced similar improvements regarding pain, discomfort and overall state of health (EQ-5D), self-care and compliance with activities recommended by the physician (SDSCA), and diabetes-related distress (PAID). Psychosocial efficacy related to diabetes perceived by the patient (DES) improved to a greater extent with CM than with RC. These improvements in patient reported outcomes may have contributed to the high degree of satisfaction with care and goal achievement, also reflected in the high information retention rates in both groups. Satisfaction with care and goal achievement were higher in patients trained with CM than in those on RC, but differences between both groups in these measurements were smaller at the 6-month visit as compared to the 6-week visit, which suggests that regular reinforcement of training with CM would be beneficial.
No national structured educational programs for patients with T2DM are currently implemented in Spain, but there are local and regional initiatives. The results of this study show that the use of CMs may be considered in patients with T2DM who require diabetes education. In order to maximize the efficacy of CM-based training, it may be advisable to use it only with patients who are willing and able to receive this type of training, because these are the patients most likely to acquire and retain the information provided and to act in consequence.22,25 Other studies are therefore recommended to identify and determine which patients would be more likely to benefit from educational programs related to diabetes.
LimitationsThe participants were followed up for only six months after training, and evidence of long-term maintenance of the effect is therefore not available. In addition, the study was not blinded, and the introduction of bias related to the results of patient questionnaires (e.g. satisfaction with self-care) cannot therefore be ruled out.
In this study, the patients in the comparator group did not receive standardized interventions, but their regular care, which is heterogeneous in nature, as is patient education in Spain. The lack of a standardized national program makes selection of a comparator difficult. Thus, RC was selected as comparator to assess the incremental benefit of CMs as compared to options currently used by Spanish centers. RC may or may not have included diabetes education, and we found that 21 patients from the RC group used structured educational programs during the study, which may have affected our results.
No detailed data on the skills of each diabetes educator participating in the study were collected (although they had a median experience of 100 months in providing diabetes education).
Finally, there may have been a learning effect in ADKnowl completion. To minimize this, participants were not given their scores or correct answers after questionnaire completion, and the ADKnowl was the first questionnaire they completed to guarantee that they did not obtain information from subsequent questionnaires (e.g. SDSCA) and did not complete the ADKnowl using that information. However, it is likely that any learning effect would have been similar in both treatment groups.
ConclusionIn Spain, where there are no national structured programs for diabetes education or awareness, CMs were superior to RC, and should therefore be considered for patients with T2DM who need diabetes education.
Conflict of interestJR, AR, and SC are employees and shareholders of Eli Lilly. AC is an employee at Eli Lilly. MR was an employee at Lilly at the time of study conduct and manuscript preparation.
Eli Lilly sponsored both the study and the writing of this manuscript.
The authors wish to acknowledge Caroline Spencer and David Peters (Rx Communications, United Kingdom) for their help in the writing of this article, funded by Eli Lilly.
At the time the study was conducted the author was employed by Eli Lilly and Com.
Please cite this article as: Penalba M, Moreno L, Cobo A, Reviriego J, Rodríguez A, Cleall S, et al. Impacto de las herramientas «Mapas de Conversaciones™» sobre el conocimiento de la diabetes en pacientes españoles con diabetes mellitus tipo 2: un estudio aleatorizado y comparativo. Endocrinol Nutr. 2014;61:505–515.
- Gut microbiota and type 2 diabetes mellitus
- Healthcare costs of people with type 2 diabetes mellitus in the Basque Country (Spain)
- Use of healthcare resources and costs associated to the start of treatment with injectable drugs in patients with type 2 diabetes mellitus
- Efficacy and safety of empagliflozin in combination with other oral hypoglycemic agents in patients with type 2 diabetes mellitus