


To determine compliance, metabolic control, complications and healthcare costs of patients with type 2 diabetes mellitus (T2DM) treated with metformin who started a second antidiabetic drug.
Patients and methodsDesign multicenter observational retrospective. Patients aged ≥30 years (age) were evaluated, treated with metformin and started a second antidiabetic treatment during 2008–2009. There were 4 patient groups (metformin and another antidiabetic): (a) dipeptidyl peptidase-4 inhibitors (IDPP4), (b) sulfonylureas, (c) glitazones and (d) insulin. Main measures: comorbidity, metabolic control, compliance and complications. Patients were followed for 2 years. The cost model differed in direct (primary care/specialist) and indirect (labor productivity) healthcare costs. Statistical analysis: logistic regression models and ANCOVA, p<0.05.
Results2067 patients were included (mean age: 66.6 years, male: 53.1%). 25.1% started a second treatment with IDPP4; 42.9% sulfonylureas, 14.0% glitazones and 18.0% insulin. At 2 years of follow-up, patients treated with IDPP4 showed greater adherence versus 70.3%. 59.9%, 60.3% and 58.4; better control of 64.3% versus DM2. 62.6%, 62.8% and 50.5% and a decrease of 13.9% compared to hypoglycemia 40.4%, 37.6% and 58.9%, respectively (p<0.001). The average/unit total cost was 2321€ versus 2475€, 2724€ and 3164€, respectively, p<0.001. Rates of cardiovascular events and renal failure were 3.7%, 6.4%, 7.6% and 10.2%, respectively.
ConclusionsSulfonylureas were the most commonly used drugs. Patients treated with IDPP4 had higher compliance and control of diabetes, with lower rates of hypoglycemia and healthcare costs.
Determinar el cumplimiento, control metabólico, complicaciones y costes sanitarios de los pacientes tratados con metformina que iniciaron un segundo fármaco antidiabético en pacientes con diabetes tipo 2 (DM2).
Pacientes y métodosDiseño observacional-multicéntrico de carácter retrospectivo. Se evaluaron pacientes de edad igual o superior a 30 años, en tratamiento con metformina y que iniciaron un segundo tratamiento antidiabético durante 2008-2009. Se establecieron 4 grupos de pacientes (metformina y otro antidiabético): (a) inhibidores de la dipeptidil peptidasa 4 (IDPP4); (b) sulfonilureas; (c) glitazonas, y (d) insulinas. Principales medidas: comorbilidad, control metabólico, cumplimiento y complicaciones. El seguimiento se realizó durante 2 años. El modelo de costes diferenció los costes sanitarios directos (atención primaria/especializada) e indirectos (productividad laboral). Análisis estadístico: modelos de regresión logística y ANCOVA, p<0,05.
ResultadosSe seleccionaron 2.067 pacientes (edad media: 66,6 años; varones: 53,1%). Un 25,1% iniciaron un segundo tratamiento con IDPP4; 42,9% con sulfonilureas, 14,0% con glitazonas, y 18,0% con insulinas. A los 2 años de seguimiento, los pacientes tratados con IDPP4 mostraron un mayor cumplimiento terapéutico (70,3 vs. 59,9%, 60,3% y 58,4); mejor control de la DM2 (64,3 vs. 62,6%, 62,8 y 50,5%) y menor proporción de hipoglucemias (13,9 frente a 40,4%, 37,6% y 58,9%, respectivamente) (p<0,001). El promedio/unitario de los costes totales fue de 2.321€ frente a 2.475€, 2.724€, y 3.164€, respectivamente; p<0,001. Las tasas de eventos cardiovasculares e insuficiencia renal fueron del 3,7; 6,4; 7,6, y 10,2%, respectivamente.
ConclusionesLas sulfonilureas fueron los fármacos más utilizados. Los pacientes en tratamiento con IDPP4 presentaron mayor cumplimiento y control de la diabetes, con menores tasas de hipoglucemias y costes sanitarios.
Cardiovascular disease is the leading cause of morbidity and mortality in developed countries. The detection and control of the different cardiovascular risk factors continues to be the main strategy for preventing cardiovascular disease.1 Diabetes mellitus (DM) is one of the diseases with the greatest social and health impact, not only because of its high frequency, but also mainly because of its attendant complications and its significant role as a cardiovascular risk factor.2–4 The prevalence of DM in Spain is 8% in women and 12% in males, ranging from 6% to 12% depending on the different studies, populations, and methods used for diagnosis, and may be up to 20% in people older than 75 years.5,6
The non-drug treatment for DM comprises three basic aspects: diet, physical exercise, and healthy lifestyle.7 If metabolic objectives are not achieved after a reasonable time with non-drug treatment, drug treatment should be started. The objective of drug treatment in DM is to achieve the optimum metabolic control with the maximum possible safety. Metformin is the drug of first choice recommended by the different scientific societies.7,8 Very strict control is recommended in the early treatment of DM, and when adequate blood glucose control is not achieved with monotherapy, a second drug should be added.8,9 The most common acute complication in diabetes is hypoglycemia, especially in patients treated with insulin and/or sulfonylureas.8 In patients with type 2 diabetes mellitus (T2DM), symptoms of hypoglycemia are non-specific and difficult to quantify, and may vary depending on the degree of hypoglycemia, patient age, and the rate of decrease in glycemia.10 It should be noted that the new therapeutic class of dipeptidyl peptidase 4 inhibitors (DDP4 inhibitors) has the potential advantage over traditional secretagogues for substantially decreasing hypoglycemia because its mechanism for stimulating insulin secretion is glucose-dependent.11
T2DM is one of the diseases which has the greatest social and health impact, not only because of its high prevalence, but also due to its acute and chronic complications, its high morbidity and mortality rates, its impact on the quality of life, and because it requires a high level of healthcare resource utilization.12,13 Studies in Spain on complications, metabolic control, and the use and costs of healthcare resources in patients treated with combined anti-diabetic drugs are limited or non-existent, which is why this study may be of some relevance. The main study objective was to determine the different treatment options in patients with T2DM who are receiving metformin and who start a second antidiabetic treatment in standard clinical practice in a population setting. The following were also reported for each group (dual therapy): (a) potential complications (hypoglycemia and macrovascular complications [cardiovascular events –CVEs and nephropathy]); (b) changes in therapeutic control objectives and treatment compliance; and (c) the use and costs of healthcare resources.
Patients and methodsStudy design and populationA multicenter, observational, longitudinal study was conducted based on a review of the medical records (computer databases) of patients followed up on an outpatient or inpatient basis who were treated with metformin for T2DM. The study population consisted of patients from six primary care centers and two hospitals, Hospital Municipal de Badalona and Hospital Germans Trías i Pujol (inpatients). The population covered by the centers was mainly urban, of intermediate to low socioeconomic status, and working in the industrial sector.
Inclusion and exclusion criteriaThe study enrolled all patients who started a second anti-diabetic treatment between 1/01/2008 and 31/12/2009 and who met the following criteria: (a) aged 30 years or older; (b) of either sex; (c) were diagnosed with T2DM at least 12 months before study start; (d) were in regular compliance with the protocol/cardiovascular risk guide established; (e) were in the chronic prescription program to get medical prescriptions (with written record of daily dose, time interval, and duration of each treatment administered as prescribed by the physician); (f) were currently being treated with metformin as first therapeutic option (monotherapy); and (g) were patients in whom a follow-up for at least two years after the start of the second antidiabetic drug could be warranted. Patients moving to other locations, those living outside the area, and those only attending integrated specialists were excluded. Patients were followed up for 24 months from the date of the start of treatment for the following: (a) complications (hypoglycemia and microvascular and macrovascular [CVEs] complications); (b) changes in therapeutic control objectives (HbA1c); (c) treatment compliance; and (d) the use and costs of healthcare resources.
Evaluation of type 2 diabetes mellitus and its complicationsT2DM was diagnosed based on component 7 of diseases and health problems14 (T90) of the International Classification of Primary Care (ICPC-2) and the coding of hospital discharge and emergencies according to the International Classification of Diseases, 9th revision, clinical modification (ICD-9-CM [250.00–250.92]).
HypoglycemiaAll cases of symptomatic hypoglycemia were identified. Records were collected from the reasons given for visiting healthcare centers and/or from the computer clinical protocols during patient follow-up.
Macrovascular complications, cardiovascular disease, and kidney diseaseNew cases of CVEs or kidney disease were recorded during the follow-up period (two years). These included: (a) heart diseases, such as cardiac ischemia (codes: K74, K76; stable, unstable, and other), acute myocardial infarction (code. K75), and heart failure (K77) according to the definition in diagnostic criteria of the World Health Organization; (b) cerebrovascular disease, including stroke (ischemic or hemorrhagic) and transient ischemic attack, K90 and K91; (c) peripheral artery disease (all types); and (d) kidney disease (diabetic nephropathy or impaired kidney function [serum creatinine: males>133; females>124mmol, or glomerular filtration rate<60]).
A register was obtained from specialized care discharge reports and/or from ICPC-2.14 The cumulative incidence rate was defined as the proportion of healthy subjects who experienced the complication (the number of new cases). Cumulative incidence provides an estimate of the chance or risk that a subject free of a given disease will develop such a disease during a specific time interval. The results were not standardized because the population pyramid distributed by age and gender of the study patients was similar to that of the Catalonian population (source: Spanish National Statistics Institute).
Treatment descriptionThis was a non-interventional study which collected information and clinical data on patients previously treated with antidiabetic drugs according to the Anatomical Therapeutic Chemical Classification System (ATC) based on the clinical judgment of physicians.15 The allocation of a patient to a specific treatment strategy was based on standard clinical and/or care practice. Information was collected on the following antidiabetic drugs: (a) metformin (A10BA*); (b) sulfonylureas (A10BB*); (c) glitazones (A10BG*); (d) insulins (all types); and (e) DPP-4 inhibitors (A10BH*), as monotherapy or in combination (A10BD*). Information was collected, according to recommendations made by physicians, from the prescriptions dispensed by the pharmacy using the pharmaceutical prescription monitoring program of CatSalut.
Compliance and persistenceCompliance was defined as the degree of coincidence or agreement of the behavior of a patient with regard to medication intake as recommended by healthcare professionals. The percentage compliance of the period was calculated as the ratio between the total number of tablets dispensed and the total number of tablets recommended or prescribed, assuming that drug dispensing, the purchase of the drug at the pharmacy, did not represent the actual use of intake, but was closely associated with the latter. High compliance was defined as values ≥80%, while rates ranging from 50% to 79% and <50% were considered as intermediate and low compliance, respectively. Treatment persistence was defined as time, measured in months, without discontinuation of initial treatment or without change to another medication at least 30 days after initial prescription. Insulin data were collected from the number of cartridges contained in the packages.
Study groupsThe number of active substances was collected from the chronic patient prescriptions at study start according to the ATC classification.15 Four patient groups were established (metformin and another antidiabetic drug): (a) sulfonylureas; (b) glitazones; (c) insulins; and (d) DPP-4 inhibitors.
Sociodemographic and comorbidity variablesThe main study variables included age (continuous), sex, and time since start of T2DM, as well as personal history based on ICPC-214: high blood pressure (K86, K87), dyslipidemia (T93), obesity (T82), smoking (P17), alcoholism (P15, P16), all types of organ failure (heart, liver, and kidney), ischemic heart disease (codes: K74, K76, K75), stroke (K90, K91, K93), chronic obstructive pulmonary disease (R95, chronic airflow obstruction), bronchial asthma (R96), types of dementia or memory disorders (P70, P20), neurological disorders (Parkinson [N87], epilepsy [N88], multiple sclerosis [N86] and other diseases [N99]), depressive syndrome (P76), and malignant neoplasms (all types; A79, B72-75, D74-78, F75, H75, K72, L71, L97, N74-76, R84-86, T71-73, U75-79, W72-73, X75-81, Y77-79).
For each patient, the following were used as summary variables of general comorbidity: (a) the Charlson comorbidity index16 as an approximation to patient severity, and (b) the individual case-mix index, obtained from the Adjusted Clinical Groups (ACG), a system that classifies patients by iso-consumption of resources.17 The ACG system software provides resource utilization bands (RUBs), so that each patient is grouped into one of five mutually exclusive categories based on his/her general morbidity (1: healthy users or very low morbidity; 2: low morbidity; 3: moderate morbidity; 4: high morbidity; 5: very high morbidity). Information was also collected on microvascular complications (diabetic retinopathy, diabetic nephropathy, diabetic neuropathy, and diabetic vasculopathy).
Biochemical and anthropometric parametersBiochemical parameters and/or therapeutic control goals included: systolic and diastolic blood pressure (mmHg), body mass index (BMI, kg/m2), basal blood glucose (mg/dL), glycosylated hemoglobin (%), serum triglycerides, total cholesterol, high density lipoprotein cholesterol (HDL-C), and low density lipoprotein cholesterol (LDL-C) in mg/dL; and the estimation of cardiovascular risk (CVC; calculation: SCORE) according to criteria of the modified National Cholesterol Education Program-Adult Treatment Panel III (NCEP-ATP III).18 These parameters were collected at study start and end (two-year follow-up).
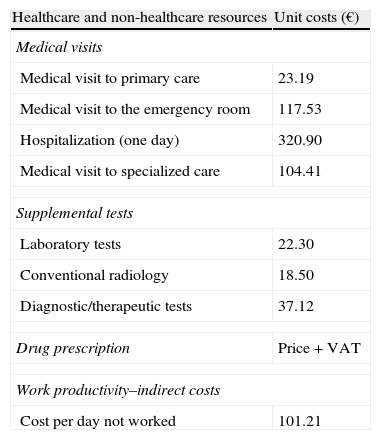
Resource utilization and cost modelDirect healthcare costs were defined as those related to care activities (medical visits, hospitalization days, visits to emergency rooms, diagnostic or treatment requests, etc.) carried out by healthcare professionals. Costs related to work productivity losses (number of sick leaves and days of disability) were considered as non-healthcare or indirect costs. Cost system design was defined by taking into consideration the characteristics of the organization and the degree of development of the information systems available. The product unit serving as the basis for the final calculation (during the study period) was the patient seen, and cost was given as mean cost per patient (unit cost). Table 1 shows the different study concepts and their economic value (in 2011). The different rates were obtained from the analytical accounts of the centers, except for medication and days of sick leave. All medical prescriptions were quantified based on retail price by pack at the time of prescription. Days of sick leave or productivity losses were considered as non-healthcare costs (indirect costs). Cost was quantified based on the minimum interprofessional wage (source: INE).19
Unit costs and work productivity losses.
| Healthcare and non-healthcare resources | Unit costs (€) |
| Medical visits | |
| Medical visit to primary care | 23.19 |
| Medical visit to the emergency room | 117.53 |
| Hospitalization (one day) | 320.90 |
| Medical visit to specialized care | 104.41 |
| Supplemental tests | |
| Laboratory tests | 22.30 |
| Conventional radiology | 18.50 |
| Diagnostic/therapeutic tests | 37.12 |
| Drug prescription | Price+VAT |
| Work productivity–indirect costs | |
| Cost per day not worked | 101.21 |
Source of healthcare resources: our own analytical accounting. Values are given in euros.
Price+VAT: retail price plus VAT.
The confidentiality of records was maintained in accordance with the Spanish Organic Act on Data Protection (15/1999, of 13 December) by using anonymized data. The study was classified by the Spanish Agency for Medicinal Products and Medical Devices (non-PAS), and subsequently approved by the Clinical Research Ethics Committee of Hospital Clínico y Provincial in Barcelona.
Statistical analysisA univariate descriptive statistical analysis was conducted using means, standard deviation (SD), and 95% confidence intervals (CIs), and a Kolmogorov–Smirnov test was used to verify the normal distribution of quantitative variables. Kaplan–Meier survival curves were used to quantify median persistence time of drugs. In the bivariate analysis, ANOVA, Chi-square, Pearsons's linear correlation, and non-parametric Mann–Whitney tests, and means comparison for paired groups were used. A logistic regression analysis was performed to determine the comorbidities associated with the group of DPP-4 inhibitors and insulins, and another analysis was done to define the variables associated with CVEs (presence/absence) using the enter procedure (statistic: Wald). Outpatient and inpatient costs were compared as recommended by Thompson and Barber20 using an analysis of covariance (ANCOVA) with sex, age, RUBs, and the Charlson index as covariates (procedure: estimation of marginal means, Bonferroni correction).
ResultsOf the 62,370 subjects over 30 years of age assigned and regularly seen at the centers, 48.295 required care, and 6620 patients were diagnosed with T2DM (prevalence: 10.6%; 95% CI: 10.4–10.8%). A total of 2067 patients treated with antidiabetic drugs (associated with metformin) were selected for the study. By study groups, 42.9% (No.=886) were treated with sulfonylureas, 14.0% (No.=290) with glitazones, 18.0% (No.=372) with insulins, and 25.1% (No.=519) with DPP-4 inhibitors, p<0.001. The mean age was 66.6 (SD: 10.9) years, and 53.1% were males.
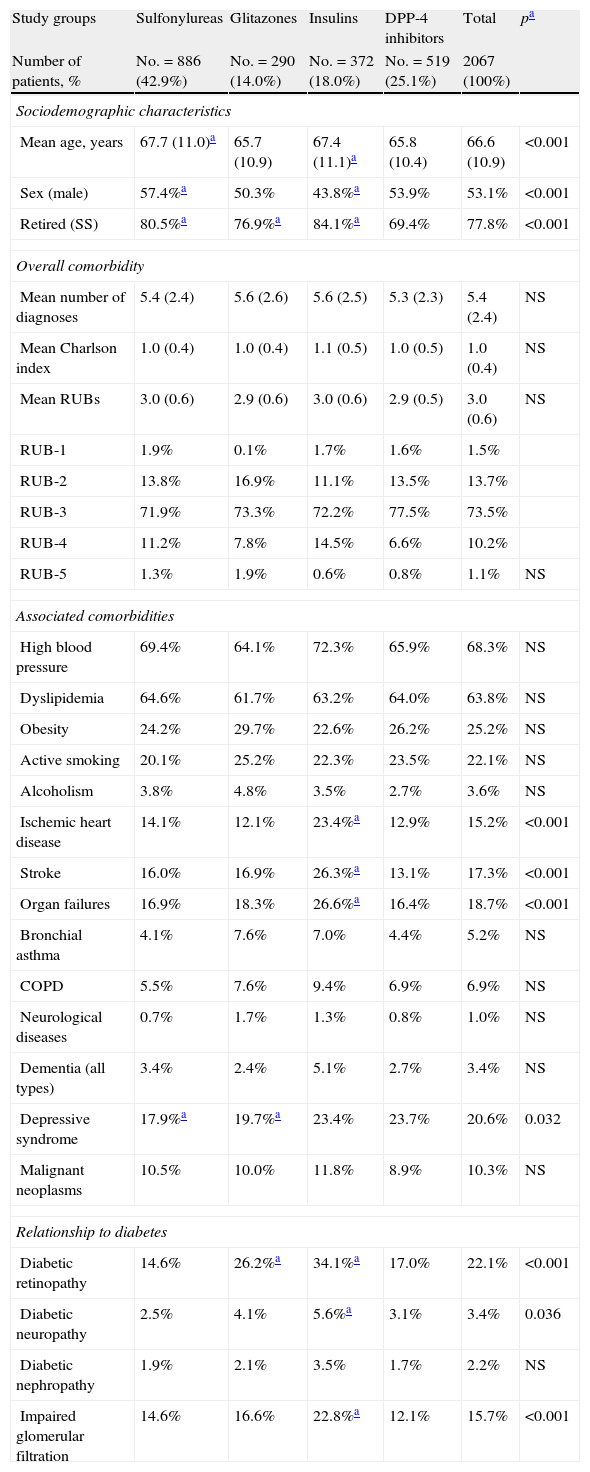
Table 2 shows the baseline characteristics of the study series by groups of treated patients. Patients treated with DPP-4 inhibitors had a lower mean age as compared to those on sulfonylureas and insulins and a similar age to those receiving glitazones (65.8 versus 67.7, 67.4, and 65.7 years, respectively; p<0.001). A higher proportion of women were found in the sulfonylurea group as compared to those treated with glitazones, insulins, and DPP-4 inhibitors (57.4% versus 50.3%, 43.8%, and 53.9%, respectively; p<0.001). Patients had a similar general comorbidity (5.4, 5.6, 5.6, and 5.3 diagnoses, respectively). Patients treated with insulins had higher rates of ischemic heart disease (23.4%), stroke (26.3%), organ failure (26.6%), retinopathy (34.2%), neuropathy (5.6%), and impaired glomerular filtration rate (22.8%), p<0.05.
Baseline characteristics of study series.
| Study groups | Sulfonylureas | Glitazones | Insulins | DPP-4 inhibitors | Total | pa |
| Number of patients, % | No.=886 (42.9%) | No.=290 (14.0%) | No.=372 (18.0%) | No.=519 (25.1%) | 2067 (100%) | |
| Sociodemographic characteristics | ||||||
| Mean age, years | 67.7 (11.0)a | 65.7 (10.9) | 67.4 (11.1)a | 65.8 (10.4) | 66.6 (10.9) | <0.001 |
| Sex (male) | 57.4%a | 50.3% | 43.8%a | 53.9% | 53.1% | <0.001 |
| Retired (SS) | 80.5%a | 76.9%a | 84.1%a | 69.4% | 77.8% | <0.001 |
| Overall comorbidity | ||||||
| Mean number of diagnoses | 5.4 (2.4) | 5.6 (2.6) | 5.6 (2.5) | 5.3 (2.3) | 5.4 (2.4) | NS |
| Mean Charlson index | 1.0 (0.4) | 1.0 (0.4) | 1.1 (0.5) | 1.0 (0.5) | 1.0 (0.4) | NS |
| Mean RUBs | 3.0 (0.6) | 2.9 (0.6) | 3.0 (0.6) | 2.9 (0.5) | 3.0 (0.6) | NS |
| RUB-1 | 1.9% | 0.1% | 1.7% | 1.6% | 1.5% | |
| RUB-2 | 13.8% | 16.9% | 11.1% | 13.5% | 13.7% | |
| RUB-3 | 71.9% | 73.3% | 72.2% | 77.5% | 73.5% | |
| RUB-4 | 11.2% | 7.8% | 14.5% | 6.6% | 10.2% | |
| RUB-5 | 1.3% | 1.9% | 0.6% | 0.8% | 1.1% | NS |
| Associated comorbidities | ||||||
| High blood pressure | 69.4% | 64.1% | 72.3% | 65.9% | 68.3% | NS |
| Dyslipidemia | 64.6% | 61.7% | 63.2% | 64.0% | 63.8% | NS |
| Obesity | 24.2% | 29.7% | 22.6% | 26.2% | 25.2% | NS |
| Active smoking | 20.1% | 25.2% | 22.3% | 23.5% | 22.1% | NS |
| Alcoholism | 3.8% | 4.8% | 3.5% | 2.7% | 3.6% | NS |
| Ischemic heart disease | 14.1% | 12.1% | 23.4%a | 12.9% | 15.2% | <0.001 |
| Stroke | 16.0% | 16.9% | 26.3%a | 13.1% | 17.3% | <0.001 |
| Organ failures | 16.9% | 18.3% | 26.6%a | 16.4% | 18.7% | <0.001 |
| Bronchial asthma | 4.1% | 7.6% | 7.0% | 4.4% | 5.2% | NS |
| COPD | 5.5% | 7.6% | 9.4% | 6.9% | 6.9% | NS |
| Neurological diseases | 0.7% | 1.7% | 1.3% | 0.8% | 1.0% | NS |
| Dementia (all types) | 3.4% | 2.4% | 5.1% | 2.7% | 3.4% | NS |
| Depressive syndrome | 17.9%a | 19.7%a | 23.4% | 23.7% | 20.6% | 0.032 |
| Malignant neoplasms | 10.5% | 10.0% | 11.8% | 8.9% | 10.3% | NS |
| Relationship to diabetes | ||||||
| Diabetic retinopathy | 14.6% | 26.2%a | 34.1%a | 17.0% | 22.1% | <0.001 |
| Diabetic neuropathy | 2.5% | 4.1% | 5.6%a | 3.1% | 3.4% | 0.036 |
| Diabetic nephropathy | 1.9% | 2.1% | 3.5% | 1.7% | 2.2% | NS |
| Impaired glomerular filtration | 14.6% | 16.6% | 22.8%a | 12.1% | 15.7% | <0.001 |
Values are percentages or means (standard deviation).
RUBs: resource utilization bands; COPD: chronic obstructive pulmonary disease; NS: not significant; p: statistical significance; SS: social security.
In the logistic regression model, patients in the DPP-4 inhibitor group were associated with an odds ratio (OR) for major depression of 1.4 (95% CI: 1.0–1.7; p<0.001) and had a better metabolic control of DM, OR=1.2 (95% CI: 1.1–1.5; p=0.018), while patients in the insulin group were associated with ischemic heart disease with an OR of 1.4 (95% CI: 1.0–1.7; p<0.001), with major depression with an OR of 1.3 (95% CI: 1.1–1.6; p<0.038), and with diabetic retinopathy with an OR of 1.9 (95% CI: 1.5–2.3; p<0.001).
Table 3 shows the association between compliance, persistence, and the degree of diabetes control by study groups. Patients in the DPP-4 inhibitor group had a higher mean treatment compliance (70.3% versus 60.3% [glitazones] and 59.9% [sulfonylureas], and 58.4% [insulins]; p<0.001) and greater treatment persistence at 48 months (63.4% versus 51.0%, 52.4%, and 48.1%; p<0.001), respectively. An acceptable correlation was seen between compliance and treatment persistence in months (r=0.451; p<0.001) for all groups. Control of T2DM at the end of follow-up of the patient cohort was higher in the DPP-4 inhibitor group as compared to all other groups (64.3% versus 62.8%, 62.6%, and 50.5%, respectively; p<0.001).
Relationship between compliance, persistence, and degree of diabetes control. Two-year follow-up.
| Study groups | Sulfonylureas | Glitazones | Insulins | DPP-4 inhibitors | Total | pa |
| Number of patients, % | No.=886 (42.9%) | No.=290 (14.0%) | No.=372 (18.0%) | No.=519 (25.1%) | 2067 (100%) | |
| Time since diagnosis of diabetes, years | 8.2 (11.3) | 8.7 (10.4) | 3.6 (7.8)a | 8.9 (4.6) | 7.6 (9.5) | <0.001 |
| Time since start of metformin (>1 year) | 75.9% | 75.2% | 76.9% | 72.6% | 75.9% | NS |
| Duration of associated treatment, months | ||||||
| Mean (SD) | 14.8 (7.7)a | 14.1 (7.2)a | 12.1 (7.2)a | 17.1 (7.1) | 14.8 (7.5) | <0.001 |
| Median (P25–P75) | 14.0 (12.6–15.3) | 14.0 (12.6–15.3) | 11.0 (9.4–12.6) | 17.0 (16.6–19.3) | 15.0 (8.0–23.0) | <0.001 |
| Treatment compliance | 59.9%a | 60.3%a | 58.4%a | 70.3% | 62.3% | <0.001 |
| ≥80%, high | 35.0% | 44.4% | 42.0% | 55.1% | 35.4% | |
| 50–79%, intermediate | 42.1% | 30.0% | 32.7% | 29.1% | 41.3% | |
| <50%, low | 22.9% | 25.6% | 25.3% | 15.8% | 23.2% | <0.001 |
| Treatment persistence | 52.4%a | 51.0%a | 48.1%a | 63.4% | 54.2% | <0.001 |
| Diabetes control | ||||||
| Baseline | 59.8% | 60.0% | 49.2% | 61.2% | 58.2% | |
| End | 62.6% | 62.8% | 50.5% | 64.3% | 61.4% | |
| Percent difference | 2.8%a | 2.8%a | 1.3%a | 3.1% | 3.2% | <0.001 |
Values are percentages.
Optimum control: HBA1c values <7%; treatment compliance: ratio between number of tablets dispensed and prescribed; persistence: median time with no discontinuation of initial treatment or change to other medication, at least 30 days after initial prescription; NS: not significant; p: statistical significance.
Table 4 shows the baseline and final values of biochemical and anthropometric parameters associated with antidiabetic drugs by treatment group. Decreased levels of HbA1c (7.5% versus 7.1%; p<0.001) and total cholesterol (191.3 versus 178.4mmHg; p<0.001) were seen in the DPP-4 inhibitor group. Significant but substantially lower reductions were also found in all other groups (sulfonylureas: 7.3% versus 7.0%; glitazones: 7.4% versus 7.1%; insulins: 8.0% versus 7.7%; p<0.008).
Biochemical and anthropometric parameters.
| Study groups | Baseline | End | Difference | p |
| Total series (No.=2067) | ||||
| Systolic blood pressure, mmHg | 135.1 (15.6) | 132.8 (15.7) | 2.3 | <0.001 |
| Diastolic blood pressure, mmHg | 75.7 (9.6) | 73.7 (10.1) | 2.0 | <0.001 |
| Body mass index, kg/m2 | 30.6 (5.2) | 30.2 (5.1) | 0.4 | <0.001 |
| Glucose, mg/dL | 150.5 (48.7) | 143.4 (52.2) | 7.1 | <0.001 |
| HbA1c, % | 7.3 (1.4) | 7.1 (1.4) | 0.2 | <0.001 |
| Triglycerides, mg/dL | 156.6 (94.1) | 146.3 (87.3) | 10.3 | <0.001 |
| Total cholesterol, mg/dL | 188.1 (39.1) | 178.4 (38.9) | 9.7 | <0.001 |
| HDL cholesterol, mg/dL | 51.7 (13.3) | 49.7 (13.4) | 2.0 | <0.001 |
| LDL cholesterol, mg/dL | 105.7 (33.6) | 99.9 (32.3) | 5.8 | <0.001 |
| Serum creatinine, mg/dL | 1.2 (0.9) | 1.1 (0.5) | 0.1 | <0.001 |
| Cardiovascular risk, % | 18.0 (8.9) | 15.8 (8.9) | 2.2 | <0.001 |
| Sulfonylureas (No.=886) | ||||
| Systolic blood pressure, mmHg | 135.5 (15.3) | 133.8 (15.1) | 1.7 | 0.004 |
| Diastolic blood pressure, mmHg | 75.8 (9.3) | 73.9 (9.7) | 1.9 | <0.001 |
| Body mass index, kg/m2 | 29.9 (4.7) | 29.4 (4.7) | 0.5 | <0.001 |
| Glucose, mg/dL | 150.1 (46.2) | 143.0 (51.1) | 7.1 | <0.001 |
| HbA1c, % | 7.3 (1.3) | 7.0 (1.4) | 0.3 | <0.001 |
| Triglycerides, mg/dL | 155.2 (92.7) | 145.2 (84.8) | 9.9 | <0.001 |
| Total cholesterol, mg/dL | 189.0 (38.4) | 180.5 (39.3) | 8.5 | <0.001 |
| HDL cholesterol, mg/dL | 51.6 (13.2) | 49.6 (12.9) | 2.0 | <0.001 |
| LDL cholesterol, mg/dL | 107.1 (32.3) | 102.6 (32.6) | 4.5 | <0.001 |
| Serum creatinine, mg/dL | 1.2 (0.5) | 1.0 (0.4) | 0.2 | <0.001 |
| Cardiovascular risk, % | 18.4 (8.5) | 16.7 (8.9) | 1.7 | <0.001 |
| Glitazones (No.=290) | ||||
| Systolic blood pressure, mmHg | 133.1 (16.3) | 131.3 (16.9) | 1.8 | NS |
| Diastolic blood pressure, mmHg | 74.3 (9.4) | 72.9 (10.2) | 1.4 | 0.034 |
| Body mass index, kg/m2 | 30.8 (5.4) | 30.5 (5.4) | 0.3 | 0.019 |
| Glucose, mg/dL | 145.9 (47.4) | 136.1 (46.3) | 9.8 | 0.003 |
| HbA1c, % | 7.4 (1.3) | 7.1 (1.3) | 0.3 | <0.001 |
| Triglycerides, mg/dL | 165.1 (91.8) | 151.1 (81.9) | 14.0 | <0.001 |
| Total cholesterol, mg/dL | 190.2 (41.4) | 179.7 (42.6) | 10.5 | <0.001 |
| HDL cholesterol, mg/dL | 52.1 (14.1) | 51.1 (15.1) | 1.0 | NS |
| LDL cholesterol, mg/dL | 105.3 (34.3) | 100.2 (34.4) | 5.1 | 0.014 |
| Serum creatinine, mg/dL | 1.2 (0.4) | 1.1 (0.6) | 0.1 | NS |
| Cardiovascular risk, % | 17.5 (10.2) | 15.6 (10.1) | 2.0 | 0.000 |
| Insulins (No.=372) | ||||
| Systolic blood pressure, mmHg | 135.6 (16.5) | 132.7 (15.3) | 2.9 | 0.005 |
| Diastolic blood pressure, mmHg | 74.8 (10.3) | 71.9 (10.1) | 2.9 | <0.001 |
| Body mass index, kg/m2 | 31.8 (5.7) | 31.5 (5.1) | 0.3 | NS |
| Glucose, mg/dL | 150.9 (59.2) | 144.1 (62.4) | 6.8 | NS |
| HbA1c, % | 8.0 (1.6) | 7.7 (1.5) | 0.2 | 0.007 |
| Triglycerides, mg/dL | 155.9 (107.5) | 149.2 (108.2) | 6.7 | NS |
| Total cholesterol, mg/dL | 179.7 (37.9) | 172.5 (39.1) | 7.2 | 0.001 |
| HDL cholesterol, mg/dL | 51.9 (13.8) | 49.3 (13.7) | 2.6 | <0.001 |
| LDL cholesterol, mg/dL | 97.6 (33.1) | 93.1 (29.8) | 4.5 | 0.005 |
| Serum creatinine, mg/dL | 1.3 (1.2) | 1.1 (0.6) | 0.2 | NS |
| Cardiovascular risk, % | 17.6 (8.5) | 15.3 (8.2) | 2.3 | 0.000 |
| DPP-4 inhibitors (No.=519) | ||||
| Systolic blood pressure, mmHg | 135.3 (15.0) | 132.2 (16.0) | 3.1 | <0.001 |
| Diastolic blood pressure, mmHg | 77.1 (9.5) | 75.1 (10.4) | 2.0 | <0.001 |
| Body mass index, kg/m2 | 30.7 (5.2) | 30.4 (5.1) | 0.3 | 0.002 |
| Glucose, mg/dL | 153.7 (45.1) | 147.8 (48.6) | 5.9 | 0.013 |
| HbA1c, % | 7.5 (1.3) | 7.1 (1.3) | 0.4 | <0.001 |
| Triglycerides, mg/dL | 154.8 (79.1) | 149.1 (77.2) | 5.7 | 0.043 |
| Total cholesterol, mg/dL | 191.3 (38.8) | 178.4 (35.5) | 12.9 | <0.001 |
| HDL cholesterol, mg/dL | 51.4 (12.5) | 49.3 (13.1) | 2.1 | <0.001 |
| LDL cholesterol, mg/dL | 109.6 (34.9) | 100.1 (31.9) | 9.6 | <0.001 |
| Serum creatinine, mg/dL | 1.2 (1.2) | 1.1 (0.3) | 0.1 | 0.002 |
| Cardiovascular risk, % | 17.7 (8.9) | 14.9 (8.4) | 2.8 | <0.001 |
Values are means (SD: standard deviation).
NS: not significant; p: statistical significance.
Table 5 shows the mean use of resources by study group. As compared to the groups receiving sulfonylureas, glitazones, and insulins, patients on DPP-4 inhibitors paid less visits to PC (21.6 versus 28.8, 27.4, and 32.0; p<0.001) and had less hospitalization days (0.1 versus 0.2, 0.2, and 0.3; p<0.001), respectively. There were no differences in days of productivity lost. Overall, higher healthcare costs were found for the insulin group.
Mean use of resources by study group.
| Study groups | Sulfonylureas | Glitazones | Insulins | DPP-4 inhibitors | Total | p | |||||
| Number of patients, % | No.=886 (42.9%) | No.=290 (14.0%) | No.=372 (18.0%) | No.=519 (25.1%) | 2067 (100%) | ||||||
| Use of resources | % use | Mean | % use | Mean | % use | Mean | % use | Mean | % use | Mean | |
| Primary care | |||||||||||
| Medical visits | 100.0 | 28.8 (15.1)a | 100.0 | 27.4 (15.5)a | 100.0 | 32.0 (17.3)a | 100.0 | 21.6 (14.8) | 100.0 | 27.4 (15.7) | <0.001 |
| Laboratory tests | 91.4 | 3.0 (1.8)a | 92.4 | 3.1 (1.9)a | 79.6 | 3.2 (2.5)a | 89.8 | 2.2 (1.5) | 89.0 | 2.8 (1.9) | <0.001 |
| Conventional radiology | 52.4 | 1.0 (1.2) | 56.6 | 1.0 (1.3) | 53.8 | 1.0 (1.3) | 58.6 | 1.1 (1.2) | 54.8 | 1.0 (1.2) | NS |
| Supplemental tests | 33.7 | 0.5 (0.8) | 42.4 | 0.6 (0.8)a | 32.3 | 0.4 (0.8) | 36.2 | 0.5 (0.7) | 35.3 | 0.5 (0.8) | 0.034 |
| Specialized care | |||||||||||
| Hospitalization days | 2.0 | 0.2 (0.7)a | 2.4 | 0.2 (0.9)a | 6.5 | 0.3 (1.6)a | 1.5 | 0.1 (0.2) | 2.8 | 0.2 (0.9) | <0.001 |
| Medical visits | 44.6 | 2.8 (3.2)a | 45.9 | 1.8 (3.1) | 65.3 | 3.7 (4.4)a | 52.4 | 1.8 (2.4)a | 50.5 | 2.8 (3.3) | <0.001 |
| Emergency room visits | 21.3 | 0.2 (0.5) | 19.3 | 0.2 (0.5) | 25.8 | 0.3 (0.6)a | 18.9 | 0.2 (0.5) | 21.2 | 0.3 (0.5) | 0.030 |
| Days of work disability | 2.3 | 0.5 (5.1) | 1.0 | 2.7 (33.9) | 1.1 | 1.3 (22.8) | 1.0 | 0.1 (0.1) | 1.3 | 0.9 (16.3) | NS |
Values are means (SD: standard deviation); p: statistical significance; NS: not significant.
Table 6 shows the gross and adjusted cost model (sex, age, RUBs, and the Charlson index) during the 48-month follow-up by study group. The total cost of care for patients with T2DM was 5.3 million euros, of which 96.6% were direct healthcare costs and 3.4% were indirect non-healthcare costs. Among healthcare costs, 84.6% were primary care costs (medication: 55.85%; medical visits: 24.9%) and 12.0% were specialized care costs (medical visits: 9.7%). Mean total (healthcare and non-healthcare) costs were lower in patients treated with DPP-4 inhibitors as compared to the other three study groups (2241.9€ versus 2474.0€, 2586.4€, and 3184.1€, respectively; p<0.001). Mean adjusted costs (ANCOVA) were 2321.2€ (95% CI: 2127.2–2515.1€) versus 2475.3€ (95% CI: 2327.6–2623.0€), 2724.4€ (95% CI: 2462.2–2986.6€), and 3163.9 (95% CI: 2934.2–3393.5€), respectively; p<0.001. These differences were seen in all cost components of the study groups. Only non-healthcare costs (work productivity or indirect losses) showed no statistically significant differences between the groups. Healthcare costs moderately correlated to age (r=0.295) and overall comorbidity (RUBs; r=0.333), p<0.001.
Gross and adjusted cost model (24-month follow-up) by study group in a retrospective cohort.
| Study groups | Sulfonylureas | Glitazones | Insulins | DPP-4 inhibitors | Total | p | Total | % |
| Unit cost | Unit cost | Unit cost | Unit cost | Unit cost | ||||
| Unadjusted cost model | ||||||||
| Healthcare costs | 2416.4 | 2312.8 | 3048.6 | 2241.5 | 2471.8 | <0.001 | 5,109,230.5 | 96.6% |
| Primary care costs | 2132.0 | 2068.2 | 2528.5 | 2016.5 | 2164.9 | <0.001 | 4,474,931.1 | 84.6% |
| Medical visits | 669.5 | 637.6 | 744.0 | 501.8 | 636.8 | <0.001 | 1,316,230.4 | 24.9% |
| Laboratory tests | 67.5 | 70.7 | 71.5 | 49.5 | 64.1 | <0.001 | 132,595.8 | 2.5% |
| Conventional radiology | 18.0 | 19.3 | 18.4 | 19.7 | 18.7 | NS | 38,572.5 | 0.7% |
| Supplemental tests | 17.1 | 22.0 | 16.2 | 17.0 | 17.6 | 0.034 | 36,303.4 | 0.7% |
| Drugs | 1360.0 | 1318.7 | 1678.4 | 1428.8 | 1428.8 | <0.001 | 2,953,296.0 | 55.8% |
| Specialized care costs | 284.4 | 244.6 | 520.1 | 225.0 | 306.3 | <0.001 | 633,186.0 | 12.0% |
| Hospitalization days | 16.7 | 27.7 | 88.0 | 6.2 | 28.4 | <0.001 | 58,724.7 | 1.1% |
| Medical visits | 238.9 | 189.4 | 392.9 | 190.9 | 247.6 | <0.001 | 511,817.8 | 9.7% |
| Emergency room visits | 28.9 | 27.6 | 39.2 | 27.9 | 30.3 | 0.030 | 62,643.5 | 1.2% |
| Non-healthcare costs (productivity) | 57.6 | 273.6 | 135.5 | 1.0 | 87.5 | NS | 180,761.1 | 3.4% |
| Total costs | 2474.0 | 2586.4 | 3184.1 | 2241.9 | 2559.7 | <0.001 | 5,290,945.1 | 100.0% |
| Adjusted cost modela | ||||||||
| Healthcare costs | 2413.1a | 2432.6a | 3034.8a | 2326.0 | <0.001 | |||
| 95% CI | 2323.9–2502.3 | 2274.2–2590.9 | 2896.1–3173.5 | 2208.8–2443.1 | ||||
| Primary care costs | 2130.8 | 2174.4a | 2505.8a | 2090.5 | <0.001 | |||
| 95% CI | 2054.1–2207.5 | 2038.2–2310.5 | 2386.6–2625.1 | 1989.8–2191.2 | ||||
| Specialized care costs | 282.3a | 258.2a | 529.0a | 235.4 | <0.001 | |||
| 95% CI | 249.7–314.8 | 200.4–316.0 | 478.3–579.6 | 192.7–278.2 | ||||
| Non-healthcare costs (productivity) | 62.2 | 291.8 | 129.0 | 2.8 | NS | |||
| 95% CI | 2.3–176.8 | 88.4–495.2 | 9.1–307.2 | 0.0–135.2 | ||||
| Total costs | 2475.3a | 2724.4a | 3163.9a | 2321.2 | <0.001 | |||
| 95% CI | 2327.6–2623.0 | 2462.2–2986.6 | 2934.2–3393.5 | 2127.2–2515.1 | ||||
Values are means.
p: statistical significance; NS: not significant; CI: confidence interval.
ANCOVA model: each F test contrasts the simple effect in each group to all other effects shown. These contrasts are based on paired comparisons, linearly independent, between the estimated marginal means. Covariates: age, RUBs, and Charlson index. Fixed components: sex and drug groups. Stable®: significant comparison between DPP-4 inhibitors and all other groups (sulfonylureas, glitazones, and insulins) in the adjusted model.
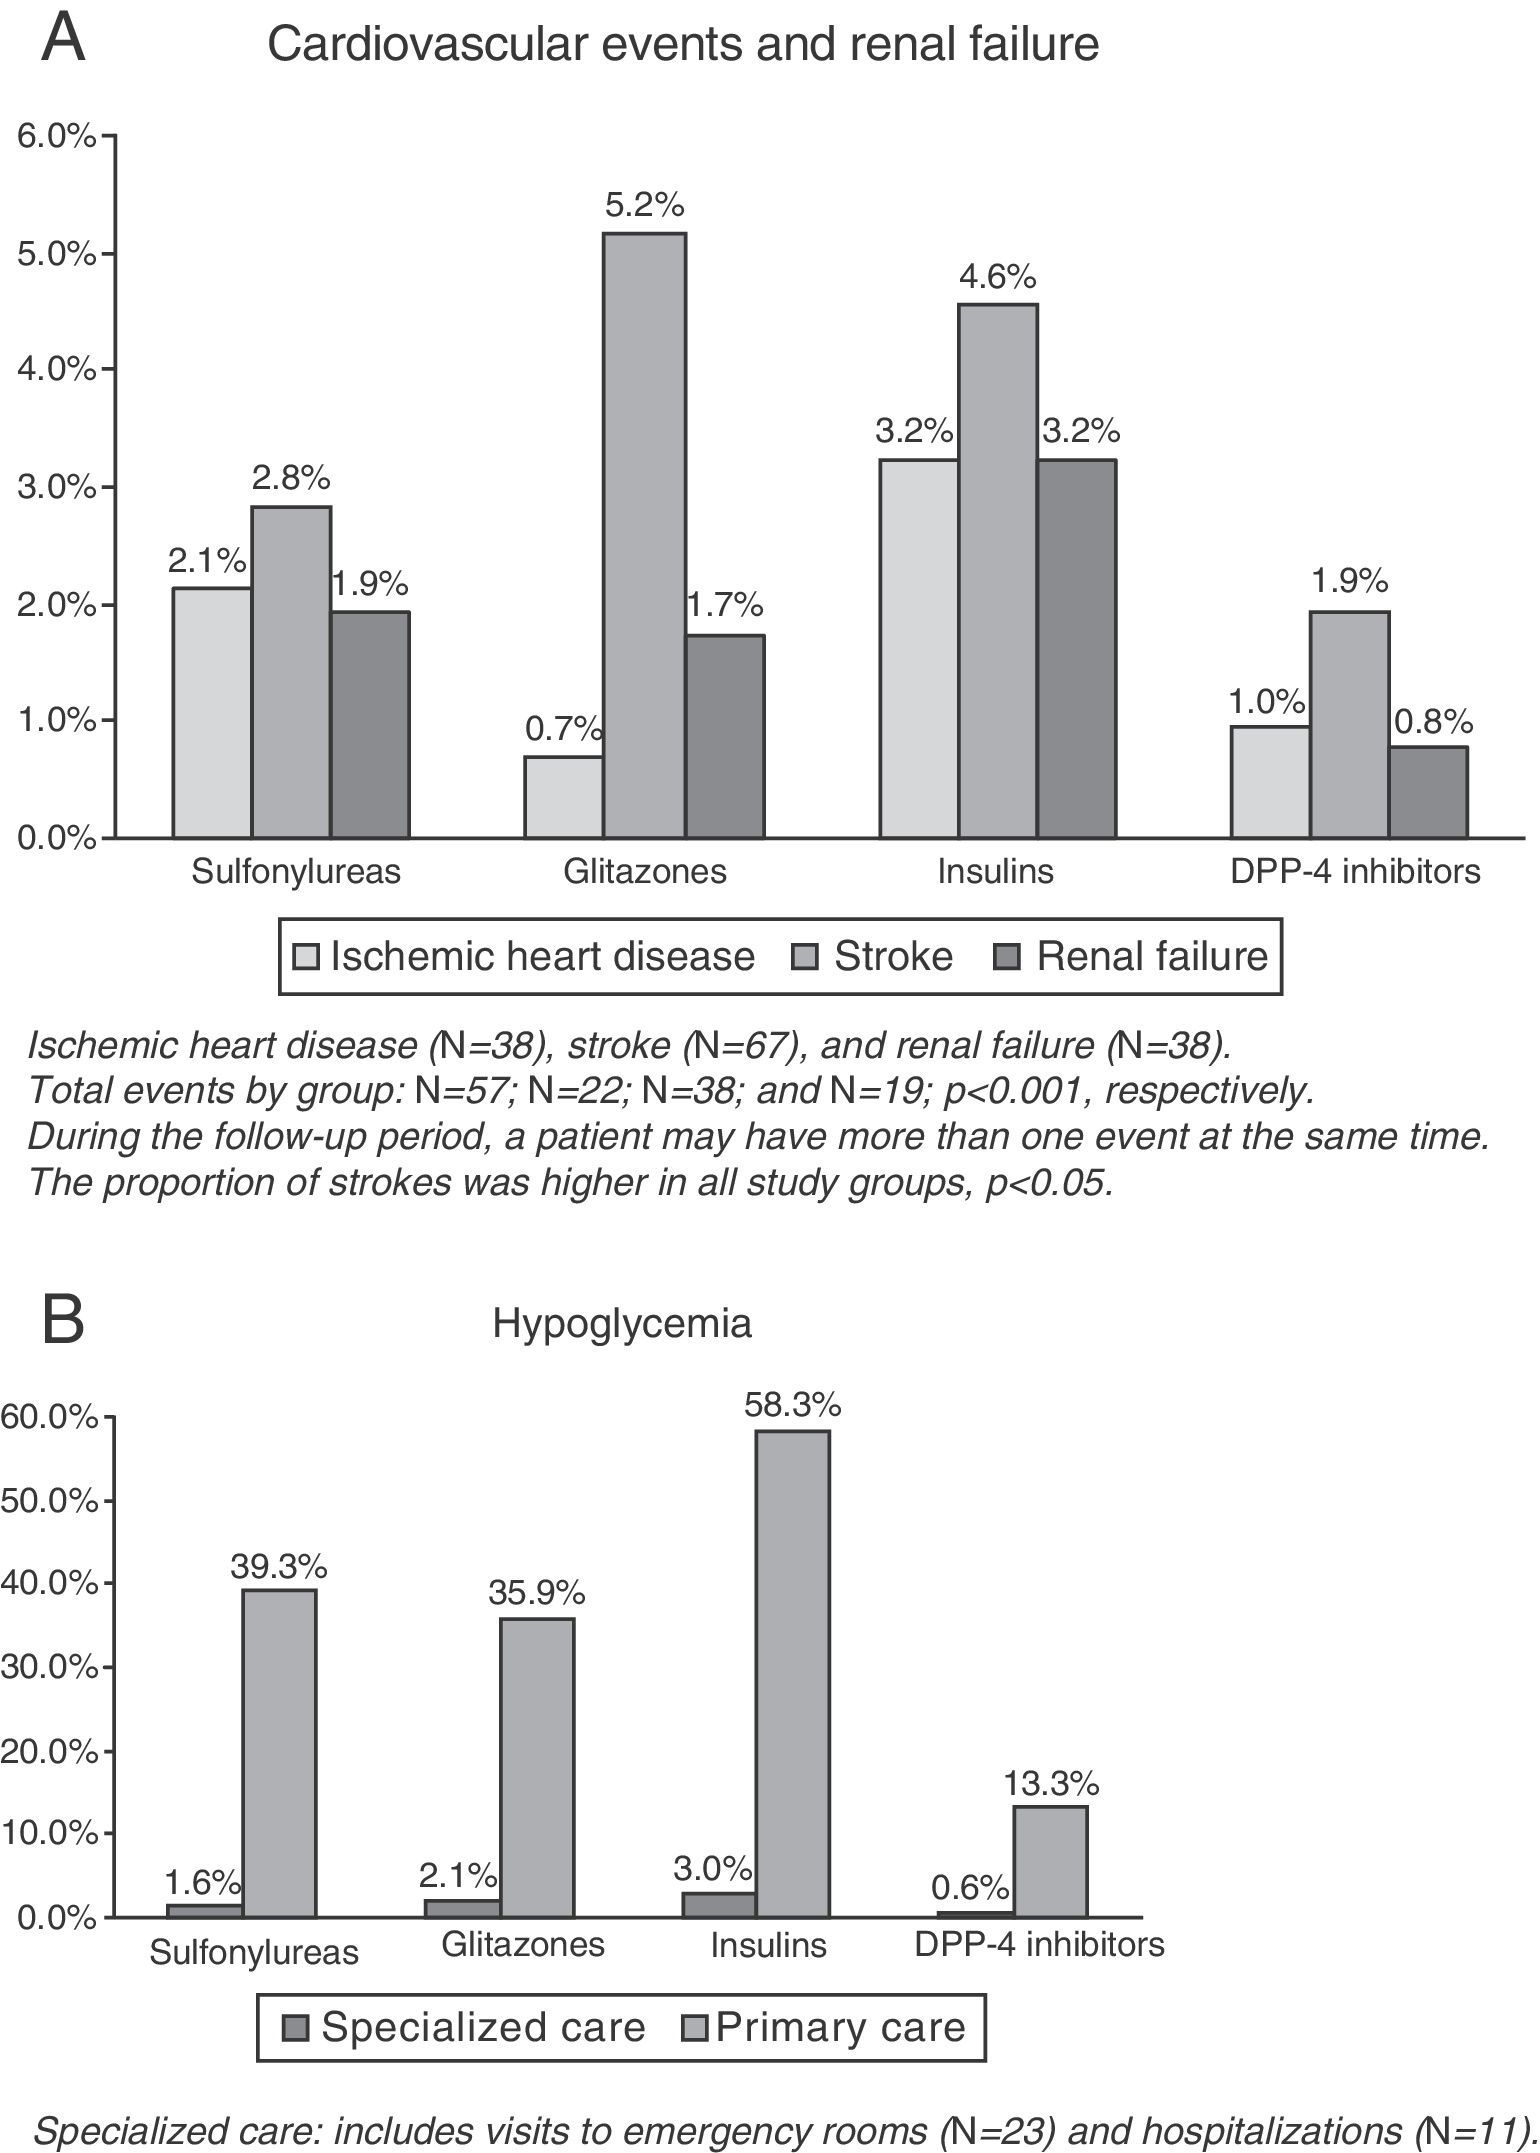
CVE and renal failure rates are shown in Fig. 1A. The group treated with DPP-4 inhibitors had a lower proportion of new cases of ischemic heart disease as compared to the insulin group (1.0% versus 3.2%, p=0.033), while no significant differences were found as compared to the groups treated with sulfonylureas (2.1%) and glitazones (0.7%). This group (DPP-4 inhibitors) had a lower proportion of new cases of stroke as compared to the insulin group (1.9% versus 5.2%, p=0.043), while no conclusive results were found as compared to the groups treated with insulins (4.6%) and sulfonylureas (2.8%). No significant differences were found in renal failure between the study groups. The total number of patients with CVEs was 136 (rate: 6.6%). The group treated with DPP-4 inhibitors (3.7%) showed significant differences as compared to the insulin group only (10.2%; p=0.002), while no conclusive results were found as compared to the groups treated with sulfonylureas (No.=57, 6.4%) and glitazones (No.=22, 7.6%).
.")
The proportion of patients with hypoglycemia was 36.7%. Patients in the DPP-4 inhibitor group had a lower hypoglycemia rate as compared to the other three study groups (13.9% versus 40.4%, 37.6%, and 58.9%, respectively, p<0.001). Overall, 0.5% of patients required hospital admission, 1.1% were seen at hospital emergency rooms, and 35.7% attended primary care (Table 2, B). Mean hypoglycemic episodes by patient were 0.1 (0.3) versus 0.5 (0.7), 0.4 (0.6), and 0.8 (1.3), respectively, p<0.001.
In the logistic regression model, the presence of CVEs (all types analyzed) was associated with treatment noncompliance (OR=1.1; CI: 1.0–1.8), with low control of T2DM (OR=1.2; CI: 1.1–1.7), with overall comorbidity (OR=2.1; CI: 1.6–2.9), with male sex (OR=1.5; CI: 1.1–2.2), and with age (OR=1.1; CI: 1.0–1.2), p<0.05.
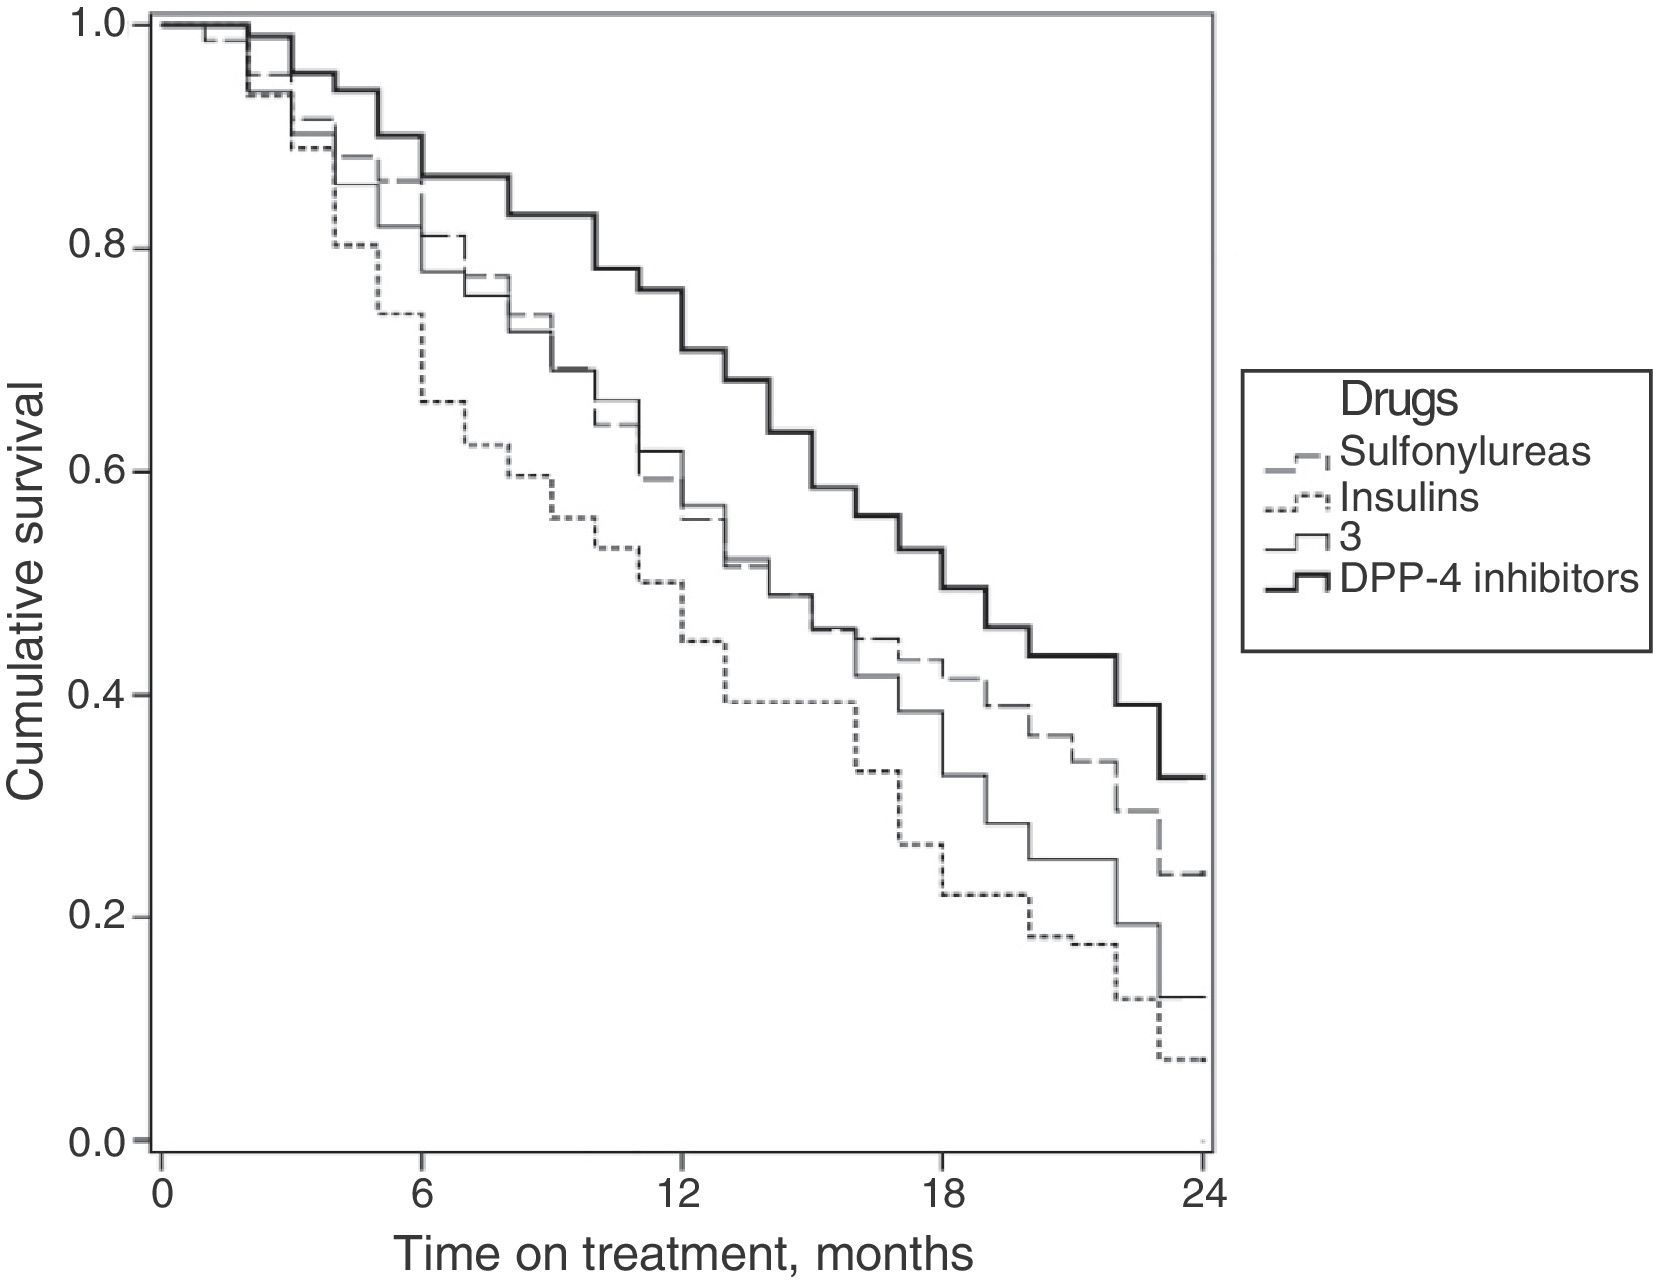
Fig. 2 shows the survival curves for the persistence of antidiabetic treatment by study group. Median persistence times were 14.0 months for sulfonylureas (95% CI: 12.6–15.3 months); 14.0 months for glitazones (95% CI: 12.6–15.3 months); 11.0 months for insulins (95% CI: 9.4–12.6 months); and 17.0 months for DPP-4 inhibitors (95% CI: 16.6–19.3 months).
Discussion
Our study details the different therapeutic options for T2DM once first drug treatment with metformin has started. Among the four treatment classes examined, higher treatment compliance and disease control rates were found with DPP-4 inhibitors (combined with metformin) (Table 3), which may be associated with lower rates of hypoglycemia, vascular complications, and healthcare costs under standard medical practice conditions in a population setting. The evidence available in Spain from the evaluation of these measures in a single study is limited, which may give this study some conceptual attractiveness because of its more comprehensive approach.21
Not all patients with T2DM started drug treatment with metformin, but in those who did, sulfonylureas were the drugs most commonly used as a second therapeutic option. It is well known that the therapeutic strategy recommended by scientific bodies7,8 involves attempting from diagnosis or as early as possible to achieve good metabolic control, starting by lifestyle changes (healthy diet, weight loss, physical exercise, and smoking cessation) together with metformin administration. If this is not sufficient, the second phase, consisting of adding sulfonylureas, basal insulin, glitazones, or other drugs as appropriate for each patient should be started after a short period of time (3–6 months). These recommendations appear to have been followed in the reported study, but the start of the initial drug treatment was more conservative (Tables 2 and 3).
A total of 2067 patients were selected for the study, 18.0% of whom were treated with insulin. It should be noted that these patients had (as compared to the other groups) a longer time from diagnosis of T2DM to the start of this second treatment option (3.6 years), which somewhat affected the comparability of the study groups (treatment options). This longer interval may have been due to delayed diagnosis of the disease (advanced diabetes) or increased genetic susceptibility, among other factors (contraindications, etc.), because these patients were older and had higher rates of ischemic heart disease and diabetic retinopathy. This finding is consistent with the data reported in other studies reviewed,9,22,23 although the use of other concomitant medication was not quantified in our study.
DPP-4 inhibitors were the second therapeutic option (25.1% of the total). Our results show that after two years of follow-up, patients treated with DPP-4 inhibitors showed greater treatment compliance, better metabolic control, and lower hypoglycemia rates as compared to the other study groups. In our study, compliance with DPP-4 inhibitors was 70%, a little higher as compared to the compliance with the other treatments (58–60%). Few studies on compliance and persistence with oral antidiabetics and insulin have been found in the literature reviewed, and it was difficult to use them for purposes of comparison because of the different methodologies used. Compliance rates reported in such studies ranged from 40% to 80%. In this regard, Márquez Contreras et al.24 reported in a recent study noncompliance with insulin treatment in a quarter of the patients with diabetes. Cramer et al.,25 in a review based on 139 studies, reported persistence and compliance rates with oral antidiabetic drugs of 63% and 58%, respectively, at 12 months, for all the therapeutic classes analyzed. In a series of patients on combined treatment with metformin and sulfonylureas, Jermendy et al.26 found 56% persistence at one year. Although these results are consistent with our findings, they do not confirm this slight superiority of DPP-4 inhibitors. This result could have been due to a random event (individual variability) or to the presence of some unidentified confounding variables. One plausible explanation could be that they have a better tolerability and safety profile, as demonstrated by markedly lower hypoglycemia rates (pharmacokinetic and pharmacodynamic properties).8,11 However, further studies comparing the use of antidiabetic drugs as dual therapy are needed to confirm the validity of these results. It is clear that the role of DPP-4 inhibitors in the therapeutic armamentarium for T2DM is rapidly evolving, but long-term data evaluating their effects on metabolic control and cardiovascular risk are lacking.27,28 That there is evidence of a direct association between compliance and control appears to be beyond doubt.1,7,9,11,24,26
Patients treated with DPP-4 inhibitors showed lower healthcare costs, with decreased use of resources in specialized care, and less hospital admissions. The few studies available show that the greater the compliance and metabolic control of these patients, the lower the risk of hospital admission. As an example, Breitscheidel et al.29 concluded in their review that improved compliance may lead to a reduction in total healthcare costs in T2DM; in seven studies, compliance was inversely associated with total healthcare costs, and costs were lower due to a lower proportion of days of hospitalization. However, the degree of variability in the reviewed studies was high, which makes a comparison of the results difficult. Overall, our results are consistent with those of these studies,12 and the association of hypoglycemia with costs should be emphasized.30
Our data reflect the lower CVE and renal failure rates in patients treated with DPP-4 inhibitors, but the differences were not statistically significant in all the study groups. In this regard, various literature references9,22,23 have shown, in both type 1 and type 2 diabetes mellitus, that the good metabolic control represented by low HbA1c values significantly improves the incidence and course of microangiopathic complications, and that these benefits persist for years even if metabolic control worsens. Because of the close relationship between some microangiopathies (mainly nephropathy) and CVEs, a good metabolic control could be expected to have a positive influence on it, though with less intensity than the control of other risk factors such as dyslipidemia and high blood pressure.1,7 DPP-4 inhibitors are now thought to possibly have cardiovascular benefits, but this has yet to be confirmed by the results of various ongoing clinical trials.
The potential limitations of the study include the categorization of the disease, a potential bias in patient classification, the selection of the therapeutic groups, and operational cost measurements, and are attributable to the information system developed. This article therefore has the limitations inherent to retrospective studies, such as disease underreporting or a potential variability of professionals and patients because of the observational design. Another potential study limitation derived from its design is that vascular complications may be associated with a better diabetic control derived from the use of DPP-4 inhibitors due to there being other factors not considered which may be having an influence. Similarly, and paradoxically, patients who switch from metformin to insulin have a faster disease progress and experience greater complications. This circumstance, not accurately measured in our study (a limitation), may be attributed to a random effect, to more rapidly progressing forms of the disease and/or to the fact that patients treated with insulin have a greater complexity. An additional study limitation refers to the measurement of hypoglycemia, because only the episodes where patients required healthcare and this was documented were identified, which may have led to an underdiagnosis of cases. Future research will be needed to analyze cost/effectiveness and diagnostic and treatment delays, and data will have to be collected from other healthcare organizations. Moreover, the successful care of patients with chronic diseases such as T2DM should be based on interventions by multidisciplinary teams that promote effective interventions in which patients are highly involved in self-care. In conclusion, sulfonylureas were the drugs most commonly used in combination with metformin. Patients treated with DPP-4 inhibitors showed greater compliance and diabetes control, with lower hypoglycemia rates and healthcare costs.
Conflicts of interestThis study was funded by Novartis Farmacéutica SA, which had no influence on its results.
Please cite this article as: Sicras-Mainar A, Font-Ramos B, Roldán-Suárez C, Navarro-Artieda R, Ibáñez-Nolla J. Caracterización y costes asociados al perfil del paciente con diabetes tipo 2 en tratamiento con metformina al que se le añade un segundo fármaco antidiabético oral: estudio de base poblacional. Endocrinol Nutr. 2013;60:557–569.