

Patients with type 2 diabetes (T2DM) demonstrate low dietary adherence and this is further aggravated with comorbid obesity. The aim of the present study was to assess diet quality in patients with T2DM and comorbid obesity compared to patients with T2DM alone and to examine the associations between comorbidities and diet quality.
MethodsThe sample consisted of 59 adult patients with diabesity (T2DM and comorbid obesity) and 94 patients with T2DM alone. All diabetes comorbidities and complications were recorded and diet quality was assessed with the Healthy Eating Index (HEI).
ResultsMean raw HEI of the diabese subjects was 81.9±7.1 and the diabetic subjects was 80.2±6.9. When HEI was adjusted to the sex, age and weight status, the diabese demonstrated a higher HEI. Among comorbidities, only renal disease decreased HEI. According to the principal component analysis of the total sample, adequate diet quality was explained by cardiovascular disease, cigarette smoking, alcohol consumption, peptic ulcer, sex, diabesity and diabetic foot syndrome. In the diabese, adequate HEI was explained by diabetic foot syndrome, smoking, drinking alcohol and having a family history of diabetes.
ConclusionsAdult patients with T2DM demonstrate adequate diet quality. Different factors are associated with the adoption of a high quality diet between the diabese and the T2DM alone.
Los pacientes con diabetes tipo 2 (DM2) muestran un bajo cumplimiento dietético y esto se agrava aún más con la obesidad comórbida. El objetivo de este estudio fue evaluar la calidad en la dieta de los pacientes con DM2 y obesidad comórbida en comparación con pacientes que solo padecen DM2, además de examinar la asociación entre las comorbilidades y la calidad de la dieta.
MétodosLa muestra consistió en 59 pacientes adultos con diabesidad (DM2 y obesidad comórbida) y 94 pacientes con solo DM2. Se registraron todas las comorbilidades y las complicaciones por diabetes, y se evaluó la calidad de la dieta con el Índice de Alimentación Saludable (IAS).
ResultadosLa media bruta del IAS en las personas diabéticas y obesas fue del 81,9±7,1 y en aquellas que presentaban solo diabetes 80,2±6,9. Al ajustar por sexo, edad y peso, las personas con diabetes y obesidad simultánea presentaron un IAS más elevado. De las comorbilidades habituales, solo la nefropatía disminuyó el IAS. De acuerdo con el análisis de componentes principales de la muestra total, la calidad de una dieta adecuada viene explicada por las enfermedades cardiovasculares, el tabaquismo, el consumo de alcohol, la úlcera péptica, el sexo, la diabesidad y el síndrome del pie diabético. En las personas diabéticas obesas, un IAS adecuado venía explicado por el síndrome del pie diabético, el tabaquismo, consumo de alcohol y antecedentes familiares de diabetes.
ConclusionesLos pacientes adultos con DM2 demostraron una calidad adecuada en su dieta. Existen diversos factores asociados con la adopción de una dieta de alta calidad entre las personas con diabetes y obesas, y aquellas con solo DM2.
Sedentary lifestyle and nutrition transition have increased the prevalence of overweight worldwide. Concurrently, excess in body weight is the premium cause for the development of insulin resistance and type 2 diabetes mellitus (T2DM).1 The coexistence of both T2DM and obesity has been named “diabesity” and consists of the new health epidemic.2
Although obesity is the most prevalent comorbidity of T2DM, the disease is also associated with several diabetic and non-diabetic related comorbidities such as retinopathy, nephropathy, cardiovascular disease (CVD), atherosclerosis and hypertension, all of which confer an elevated morbidity and mortality among the patients.3,4 Aside pharmacotherapy, dietary treatment consists of a proved and costless therapeutic remedy in targeting diabetes, diabesity and their complications.5,6 Overall, studies have showed poor dietary compliance among patients with T2DM.7,8 In Spain, the majority of diabetic patients are obese, consume a low quality diet, high in fats and in particular monounsaturated fatty acids and exceed recommendations for saturated fats intake.8,9 In France, patients have reported difficulties in dietary advice adherence.10 Among the factors affecting diabetes treatment adherence, obesity appears to be the predisposing one.10 Although the assessment of diet quality consists of the only measure evaluating dietary therapy adherence, until now no study has assessed the impact of comorbid obesity on the diet quality of the diabetic subjects. Research has proved that diet has an effect on the progression of several diabetes comorbidities,11 but researchers have never addressed the opposite hypothesis. Thus, it is still unknown whether the duration of the disease or the prevalence of diabetes complications ameliorates the patients’ diet quality. It is possible that the increased morbidity associated with diabetes complications might trigger individual adherence and improves nutritional intake, in an effort to achieve better diabetes control.
The aim of the present cross-sectional study was twofold: (1) to assess diet quality in patients with diabesity and T2DM alone, attending a primary health care clinic in Greece; (2) to delineate the existing associations between diabetes complications/comorbidities and diet quality in patients with T2DM compared with diabese patients.
Materials and methodsSample recruitmentThe initial sample comprises 200 adult patients with T2DM, all having accepted the disease according to the Kűbler-Ross scale.12 Participants were outpatients of the 1st Department of Internal Medicine at the Hippokratio General Hospital in Thessaloniki, Greece. Sample collection took place during January–March 2010 at the Hippokratio Hospital and included all outpatients who visited the Diabetes clinic during these months who had accepted the diagnosis of T2DM. Forty-nine patients were low energy reporters and were removed from the study sample. Thus, the final sample comprises 151 patients with T2DM, 56 men and 95 women (age: 65±11.6 years), all adequate energy reporters. All patients were receiving individualized instructions on the dietary management of diabetes and weight control by a registered dietician and a medical doctor experienced in diabetes, according to the International Diabetes Federation lifestyle modification guidelines.13 Patients provided oral consent for participation in the study, which was approved by the hospital's ethics committee.
Anthropometric indices and medical historyBody weight (BW) and height was measured with a Seca 789 (Seca, Germany) and body mass index (BMI) was calculated. Overweight was defined as 25≤BMI<30kg/m2 and obesity as BMI≥30kg/m2. Since all participants were diagnosed with T2DM, those with comorbid obesity formed the diabese group (n=59) and those with diabetes alone formed the diabetic group (n=92).
Bioelectrical impedance analysis (BIA) was used to assess body composition in the sample, with the use of a Maltron 907 analyser (Maltron International, Rayleigh, Essex, UK), according to the manufacturer's guidelines. Adiposity (the prevalence of overfat participants) was defined as two highest quintiles of fat mass (>37.16% for the men and >40.01% for the women).14 Fat mass index (FMI) was calculated as the fat mass (kg), divided by the height2 (m) of each participant.15 Sarcopenic obesity was diagnosed in patients with coexisting sarcopenia and adiposity, according to the NHANES III criteria.14
A detailed medical history was attained by an experienced doctor and all diabetes chronic comorbidities and complications were recorded. Diabetes control was evaluated through glycated hemoglobin (HbA1c). Malnutrition was assessed with the Mini Nutritional Assessment® tool (MNA-SF).16
Diet qualityEnergy and macronutrient intake of each participant was evaluated through two previous non-consecutive food recalls collected on weekdays by an experienced dietician, as suggested by Hoffmann.17 Each food recall was analyzed with Food Processor 7.4 (ESHA, Portland, Oregon) and the median intakes were used to assess energy intake for each participant. A validated food-frequency questionnaire18 was used to calculate the Healthy Eating Index (HEI).19 HEI is an index of diet quality that comprises twelve components, each measuring the consumption of a different food group or nutrient (total fruit including juices, whole fruit, total vegetables, dark green and orange vegetables and legumes, total grains, whole grains, milk, meat and beans, oils, saturated fat, sodium and energy consumption from solid fats, alcohol and added sugar (SOFAAS)). HEI score ranging from 80 to 100 was considered adequate, a score between 60.00 and 79.99 average and a value below 60 was indicative of low diet quality.20 Participants consuming more than 300ml of ethanol per week were considered alcohol consumers.21
Statistical analysesTwo statistical software packages were used for data analysis, SPSS 15.0 (SPSS Inc., Chicago, IL, USA) and MiniTab® 14.0 (MiniTab Inc., State College, PA, USA). All data were tested for normality in distribution using the Kolmogorov–Smirnov test. Independent samples t-tests were performed on continuous variables and chi-square was applied on categorical variables. When continuous data were not normally distributed, Mann–Whitney U-test was used to assess differences between the two groups. Odds ratios were calculated for the prevalence of each comorbidity on the studied groups. Linear regression was used to adjust HEI to the age, sex and weight status of participants. Binary logistic regression was applied on the HEI using 80 as a cut-off,20 in order to adjust the prevalence of adequate quality dieters for participants’ sex, age and obesity. Spearman's rho was used to assess correlations.
Simple correspondence analysis (SCA) was applied on the diabetes- and non-diabetes-related comorbidities between the diabese and the diabetic patients. SCA presents categorical data graphically in a single plot and is used to reveal relationships among the studied variables.22 The SCA method is considered a successful complement analysis in exploring categorical data23 and consists of a popular modern method in nutrition studies.20,24 Principal component analysis (PCA) was applied in the diabese group, as well as in the total sample in order to investigate the factors contributing to a diet of adequate quality. The analysis retained factors with Eigen value greater than 1, in accordance to Kaiser's recommendations.
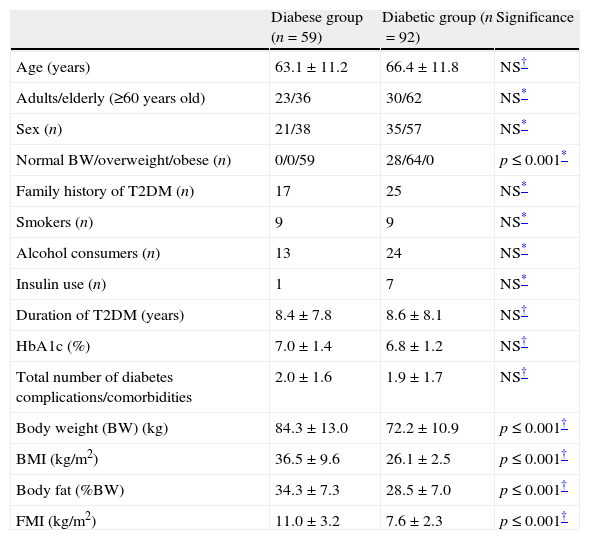
ResultsAmong the diabetic subjects, 28 were of normal BW and 64 were overweight. The two groups did not demonstrate differences in the diabetes control or the duration of T2DM (Table 1). As expected, body weight, BMI, body fat and FMI were significantly higher in the diabese group (p≤0.001).
Characteristics, anthropometric indices, diabetes control and complications between diabese and diabetic patients.
| Diabese group (n=59) | Diabetic group (n=92) | Significance | |
| Age (years) | 63.1±11.2 | 66.4±11.8 | NS† |
| Adults/elderly (≥60 years old) | 23/36 | 30/62 | NS* |
| Sex (n) | 21/38 | 35/57 | NS* |
| Normal BW/overweight/obese (n) | 0/0/59 | 28/64/0 | p≤0.001* |
| Family history of T2DM (n) | 17 | 25 | NS* |
| Smokers (n) | 9 | 9 | NS* |
| Alcohol consumers (n) | 13 | 24 | NS* |
| Insulin use (n) | 1 | 7 | NS* |
| Duration of T2DM (years) | 8.4±7.8 | 8.6±8.1 | NS† |
| HbA1c (%) | 7.0±1.4 | 6.8±1.2 | NS† |
| Total number of diabetes complications/comorbidities | 2.0±1.6 | 1.9±1.7 | NS† |
| Body weight (BW) (kg) | 84.3±13.0 | 72.2±10.9 | p≤0.001† |
| BMI (kg/m2) | 36.5±9.6 | 26.1±2.5 | p≤0.001† |
| Body fat (%BW) | 34.3±7.3 | 28.5±7.0 | p≤0.001† |
| FMI (kg/m2) | 11.0±3.2 | 7.6±2.3 | p≤0.001† |
BMI: body mass index; BW: body weight; HbA1c: glycated hemoglobin; NS: not significant; T2DM: type 2 diabetes mellitus.
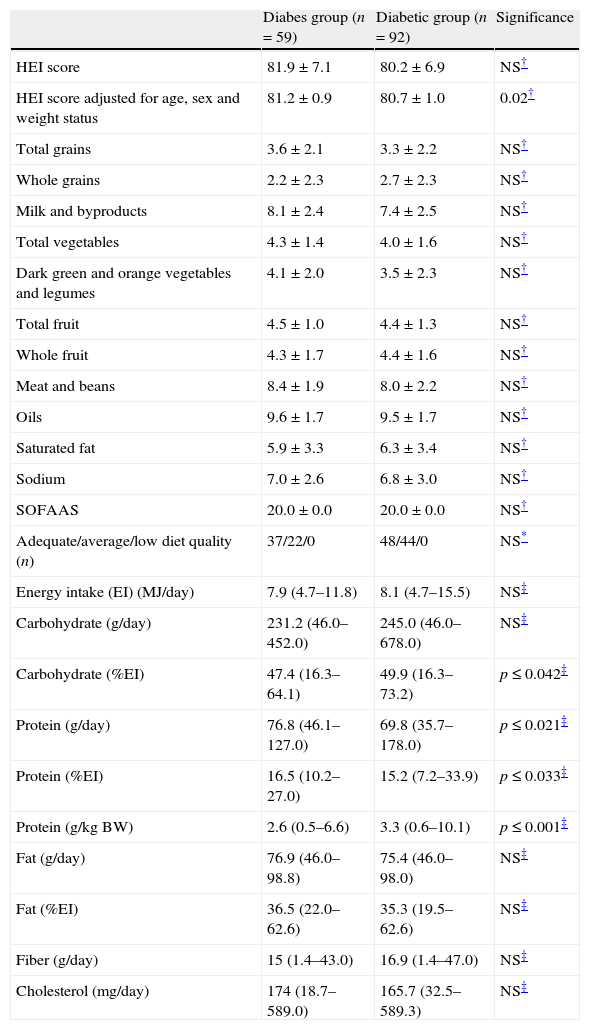
Raw HEI score was indifferent between the two groups (Table 2). When HEI was adjusted to the age, sex and weight status of participants, the diabese group demonstrated a higher diet quality according to the HEI (p≤0.02). No differences were observed in the food groups consumption between the studied groups. The diabese patients consumed more protein expressed as g/day and as a proportion of the total energy intake (p≤0.05), but the diabetic patients exhibited a greater carbohydrate consumption (% of the EI) and protein intake relatively to their body weight (p≤0.05 and 0.001, respectively). None of the participants exhibited a diet of low quality. The majority of the diabese (62.7%) and approximately half of the diabetic patients were following a diet of adequate quality (52.2%). When the sample was categorized in patients diagnosed with a complication/comorbidity and T2DM patients without comorbidities, no differences were demonstrated in the HEI except for renal impairment. Diabetic subjects with renal impairment (n=3) exhibited lower HEI (73.2±4.7) compared to the rest of the sample (81.1±7.0) (p≤0.05).
Diet quality between diabese and diabetic patients (HEI components score and total HEI score).
| Diabes group (n=59) | Diabetic group (n=92) | Significance | |
| HEI score | 81.9±7.1 | 80.2±6.9 | NS† |
| HEI score adjusted for age, sex and weight status | 81.2±0.9 | 80.7±1.0 | 0.02† |
| Total grains | 3.6±2.1 | 3.3±2.2 | NS† |
| Whole grains | 2.2±2.3 | 2.7±2.3 | NS† |
| Milk and byproducts | 8.1±2.4 | 7.4±2.5 | NS† |
| Total vegetables | 4.3±1.4 | 4.0±1.6 | NS† |
| Dark green and orange vegetables and legumes | 4.1±2.0 | 3.5±2.3 | NS† |
| Total fruit | 4.5±1.0 | 4.4±1.3 | NS† |
| Whole fruit | 4.3±1.7 | 4.4±1.6 | NS† |
| Meat and beans | 8.4±1.9 | 8.0±2.2 | NS† |
| Oils | 9.6±1.7 | 9.5±1.7 | NS† |
| Saturated fat | 5.9±3.3 | 6.3±3.4 | NS† |
| Sodium | 7.0±2.6 | 6.8±3.0 | NS† |
| SOFAAS | 20.0±0.0 | 20.0±0.0 | NS† |
| Adequate/average/low diet quality (n) | 37/22/0 | 48/44/0 | NS* |
| Energy intake (EI) (MJ/day) | 7.9 (4.7–11.8) | 8.1 (4.7–15.5) | NS‡ |
| Carbohydrate (g/day) | 231.2 (46.0–452.0) | 245.0 (46.0–678.0) | NS‡ |
| Carbohydrate (%EI) | 47.4 (16.3–64.1) | 49.9 (16.3–73.2) | p≤0.042‡ |
| Protein (g/day) | 76.8 (46.1–127.0) | 69.8 (35.7–178.0) | p≤0.021‡ |
| Protein (%EI) | 16.5 (10.2–27.0) | 15.2 (7.2–33.9) | p≤0.033‡ |
| Protein (g/kg BW) | 2.6 (0.5–6.6) | 3.3 (0.6–10.1) | p≤0.001‡ |
| Fat (g/day) | 76.9 (46.0–98.8) | 75.4 (46.0–98.0) | NS‡ |
| Fat (%EI) | 36.5 (22.0–62.6) | 35.3 (19.5–62.6) | NS‡ |
| Fiber (g/day) | 15 (1.4–43.0) | 16.9 (1.4–47.0) | NS‡ |
| Cholesterol (mg/day) | 174 (18.7–589.0) | 165.7 (32.5–589.3) | NS‡ |
HEI: Healthy Eating Index; NS: not significant; SOFAAS: solid fats, alcohol and added sugar; EI: energy intake; BW: body weight; NS: not significant. HEI score and components are expresses as mean±SD, energy and nutrient content of the diet is expressed as median (range).
The majority of the participants (82.1%) demonstrated at least one diabetes-related or non-diabetes-related comorbidity. In the total sample, the number of diabetes complications and comorbidities was correlated to the duration of diabetes (rho=0.378, p≤0.001) and the age of the participants (rho=0.592, p≤0.001). The total number of complications was not correlated to any dietary parameter (energy intake, diet quality, etc.). Among the nutrients analyzed, a strong relationship was demonstrated between sodium and saturated fats intake (rho=0.521, p≤0.001).
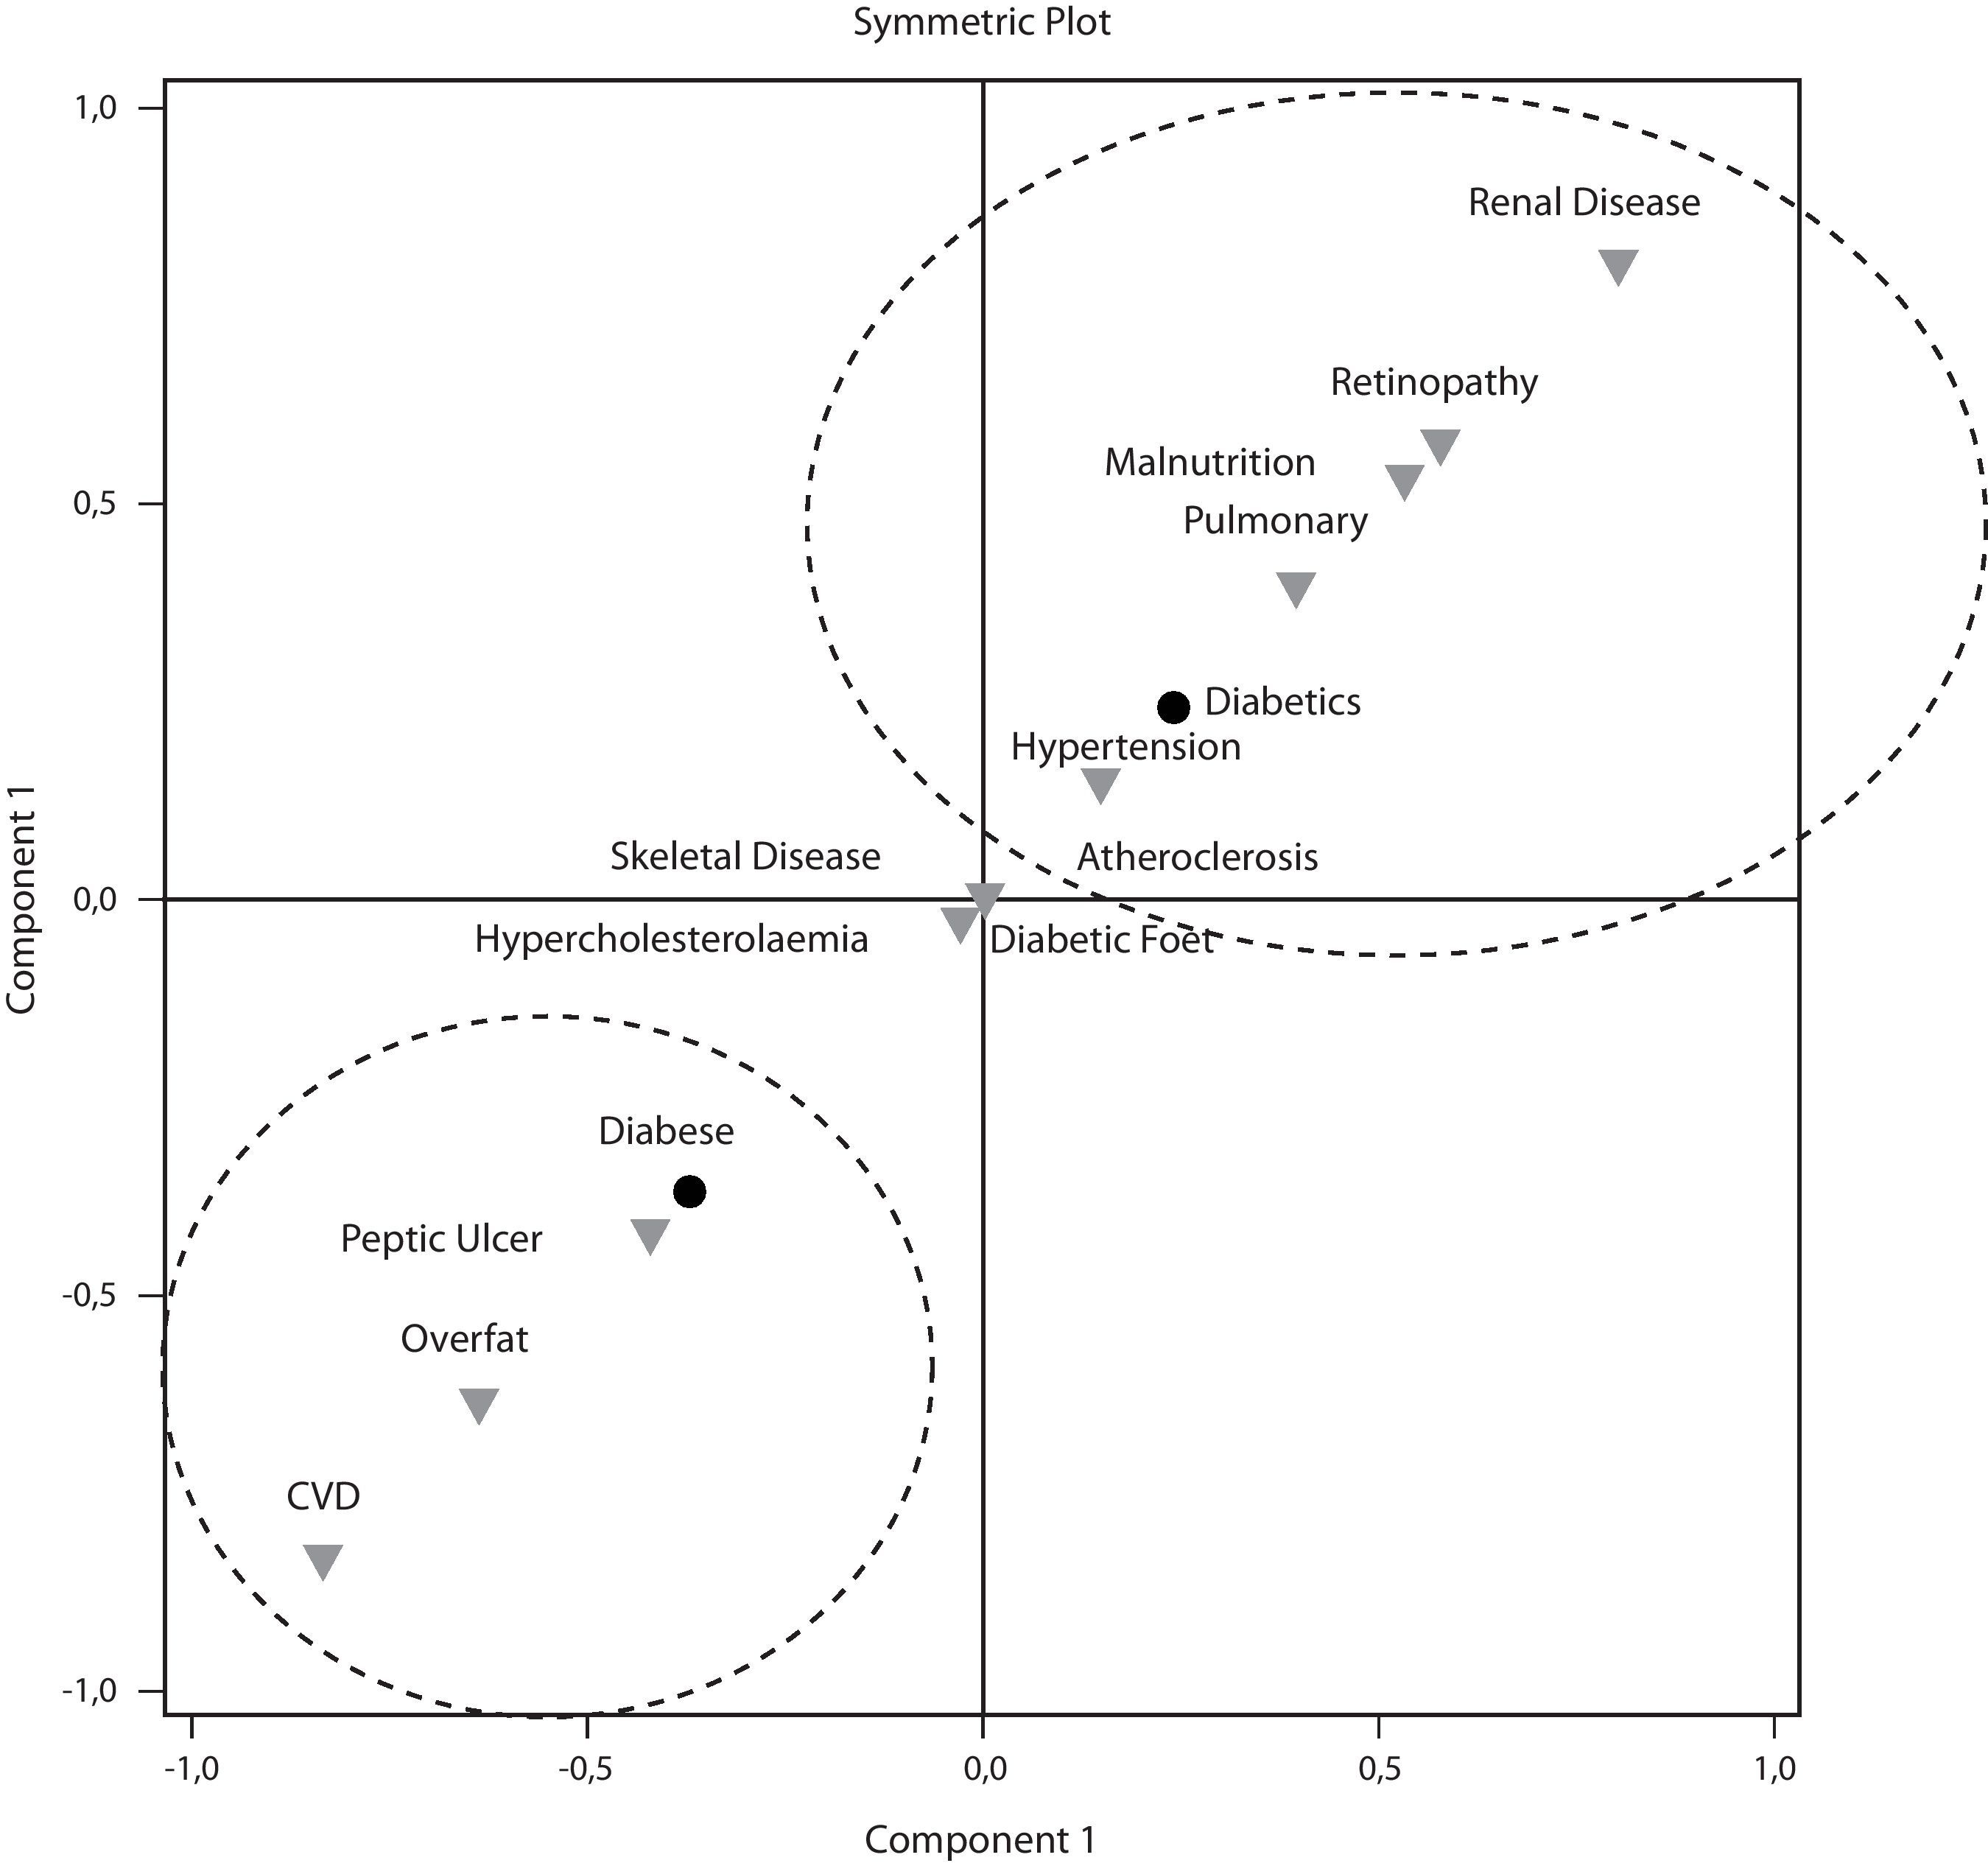
According to the interpretation of the SCA symmetric plot (Fig. 1), two general classifications emerge among the T2DM complications and comorbidities. The first dimension that displays 100% of the total inertia separates diabesity from T2DM without comorbid obesity. The class located in the lower left side of the plot associated diabesity with CVD, overfat (adiposity) and peptic ulcer. In contrast, T2DM without obesity, located on the upper right quarter of the plot was associated with malnutrition, atherosclerosis, hypertension, lung disease, diabetic retinopathy and renal disease. Musculoskeletal diseases, diabetic foot and hypercholesterolemia demonstrated similar distance between the diabese and the diabetic patients.

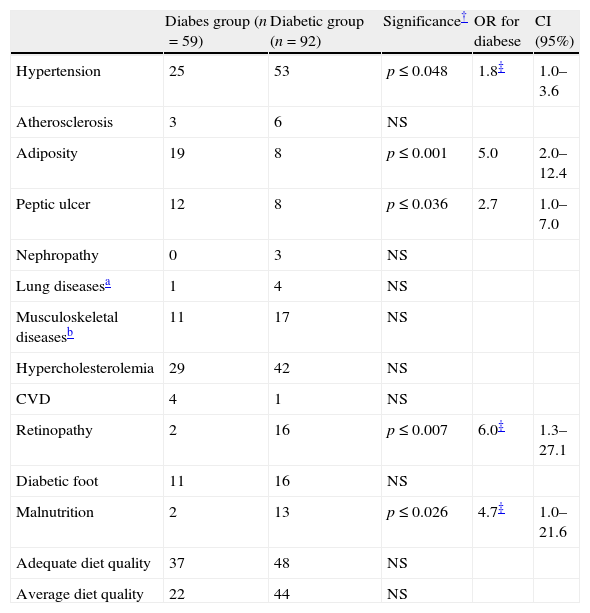
Hypertension, retinopathy and malnutrition were more prevalent among diabetic participants, whereas more diabese patients demonstrated adiposity and peptic ulcer (Table 3). None of the participants was diagnosed with sarcopenic obesity. Diabesity tripled the odds for peptic ulcer and increased the odds (fivefold) for adiposity compared to T2DM alone. On the other hand, the diabetic subjects demonstrated approximately double odds for being hypertensive and increased odds for having retinopathy and malnutrition (6 and 5 more times, respectively compared to the diabese). No difference was observed in the proportion of adequate quality dieters between the diabese and the diabetic patients, even after adjustment of HEI score for age, sex and weight status of the participants.
Odds ratios for high diet quality, diabetes comorbidities and complications among participants (n=151).
| Diabes group (n=59) | Diabetic group (n=92) | Significance† | OR for diabese | CI (95%) | |
| Hypertension | 25 | 53 | p≤0.048 | 1.8‡ | 1.0–3.6 |
| Atherosclerosis | 3 | 6 | NS | ||
| Adiposity | 19 | 8 | p≤0.001 | 5.0 | 2.0–12.4 |
| Peptic ulcer | 12 | 8 | p≤0.036 | 2.7 | 1.0–7.0 |
| Nephropathy | 0 | 3 | NS | ||
| Lung diseasesa | 1 | 4 | NS | ||
| Musculoskeletal diseasesb | 11 | 17 | NS | ||
| Hypercholesterolemia | 29 | 42 | NS | ||
| CVD | 4 | 1 | NS | ||
| Retinopathy | 2 | 16 | p≤0.007 | 6.0‡ | 1.3–27.1 |
| Diabetic foot | 11 | 16 | NS | ||
| Malnutrition | 2 | 13 | p≤0.026 | 4.7‡ | 1.0–21.6 |
| Adequate diet quality | 37 | 48 | NS | ||
| Average diet quality | 22 | 44 | NS |
OR: odds ratio; CI: confidence interval; NS: not significant; CVD: cardiovascular disease; NS: not significant.
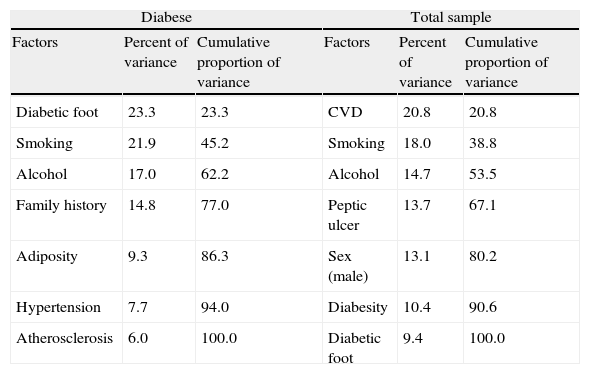
PCA of all diabetic participants (diabese and diabetic alone) with adequate diet quality extracted 7 factors explaining adequate diet quality (Table 4). CVD was the first factor, followed by smoking, alcohol, peptic ulcer, sex, diabesity and diabetic foot syndrome. An equal number of factors explained 100% of the adequate dieters among the diabese participants. The most important factors for exhibiting a high quality diet in the diabese was having diabetic foot syndrome, smoking, drinking alcohol and having a family history of diabetes. Adiposity, hypertension and atherosclerosis were the remaining contributing factors.
Principal component analysis for demonstrating a diet of adequate quality in the sample.
| Diabese | Total sample | ||||
| Factors | Percent of variance | Cumulative proportion of variance | Factors | Percent of variance | Cumulative proportion of variance |
| Diabetic foot | 23.3 | 23.3 | CVD | 20.8 | 20.8 |
| Smoking | 21.9 | 45.2 | Smoking | 18.0 | 38.8 |
| Alcohol | 17.0 | 62.2 | Alcohol | 14.7 | 53.5 |
| Family history | 14.8 | 77.0 | Peptic ulcer | 13.7 | 67.1 |
| Adiposity | 9.3 | 86.3 | Sex (male) | 13.1 | 80.2 |
| Hypertension | 7.7 | 94.0 | Diabesity | 10.4 | 90.6 |
| Atherosclerosis | 6.0 | 100.0 | Diabetic foot | 9.4 | 100.0 |
According to the results herein, adult diabetic patients attending primary health care in Greece exhibit, in their majority a diet of adequate quality. The diabese and the diabetic patients alone demonstrated similar raw HEI, but when HEI was adjusted to the age, sex and weight status of each participant the group with comorbid obesity demonstrated a better diet quality. No differences were observed in the consumed food groups/nutrients studied; however, the percentage of the daily energy intake from carbohydrates and protein intake per kg of body weight was greater in the diabetic participants alone, compared to the diabese ones. However, a greater proportion of the energy consumed from the diabese group derived from protein. Diabetes complications and comorbidities were not correlated to the diet quality, except for renal impairment, which appeared to decrease HEI. Between the diabese and the diabetic patients, different factors explained the adoption of a high quality diet. In addition, diabesity was associated with different complications and comorbidities compared with diabetes alone.
The present sample is the first to demonstrate that diabetic patients attending primary health care in Greece are adopting a high quality diet. In France, problems with dietary advice are more frequent than problems with medication10 and in the U.S. diets are usually grouped instead of individualized, a model that “has been accused to play a causal role in the obesity it is attempting to eliminate”.25 The diet quality of the participants herein was above average, indicating that type 2 diabetic patients are health conscious and follow the individualized dietary advice provided by the diabetes team. Research has showed that a personalized dietary plan can even improve metabolic control and renal function in T2DM.6 According to Puterbaugh25, dieting should not be considered the responsibility of the patient, as this would most possibly result in non-adherence to the dietary goals set by the diabetic team.25 A common problem in research assessing obstacles in effective care and adherence in diabetes guidelines, is the participation of patients from all 5 stages of the Kűbler-Ross scale, including patients in denial, anger, bargaining, depression and acceptance of the disease.12 The present sample included only patients on the 5th stage as it has been suggested that until patients reach the acceptance stage they are unable to participate in their disease management effectively.26 This might partly explain the improved diet quality of the present participants compared to previous studies. However, this is one of the few recorded attempts to evaluate diet quality of a diabetic population through a dietary index. Until now, published research only recorded problems with dietary adherence. One could argue that the self-reported dietary data might be biased since the majority of diabetic patients are aware of what they are supposed to eat. However, this problem is apparent in all dietary surveys.
The SCA plot associated different complications/comorbidities with T2DM and comorbid obesity compared with T2DM alone. Diabesity was associated with peptic ulcer, adiposity and CVD, whereas T2DM alone was related to retinopathy, chronic renal disease, hypertension, atherosclerosis and pulmonary disease. According to the SCA, less health problems appear to be associated with T2DM with comorbid obesity than with T2DM alone. This finding was further corroborated by the attenuated odds ratios demonstrated for the majority of health complications by the diabetic compared to the diabese group. Zamboni et al.27 were the first to suggest that obesity might actually act protectively against several health problems, when elderly populations are concerned. Corroborating the Zamboni et al. theory, the MNA® test revealed increased risk for malnutrition in the diabetic group compared to the diabese participants. Weight loss, a common approach in the management of T2DM might result in sarcopenia, frailty and nutrient deficiencies in the aging.28 As the majority of the present sample consisted of late middle-aged and elderly diabetic patients, it is highly possible that in those with parallel obesity, the excess in body weight conferred protection against several health problems through unknown mechanisms, as suggested by others researchers.27,28 In contrast to the first report on the prevalence of sarcopenic obesity in patients with T2DM—the Korean sarcopenic obesity study—the present results failed to demonstrate a high prevalence of sarcopenic obesity among adult diabetic patients.29
Diabetes complications and comorbidities were not correlated to the diet quality of the sample. However, between the diabese and the total sample of diabetic patients, different factors appeared to trigger the adoption of a high quality diet. In those with diabesity, having foot ulcerations was the most important factor, whereas unhealthy lifestyle habits like smoking and alcohol consumption were also pivotal contributors in adopting a healthy dietary plan. Family history of diabetes was also an important contributor explaining the adoption of a high quality diet, whereas being diagnosed with adiposity, hypertension or atherosclerosis further contributed to the increased HEI of the diabese patients. On the other hand, in the total study sample the adoption of a high quality diet was explained mainly by the prevalence of CVD, smoking, alcohol consumption, peptic ulcer and being a man. Having diabesity or foot ulcerations were also minor contributors to the HEI of the total diabetic sample. Overall, the PCA revealed that factors associated with unhealthy eating behaviors in the apparently healthy populations, are actually triggering factors for ameliorating diet quality in populations with type 2 diabetes. For example, according to the 2001–2002 U.S. National Health and Nutrition Examination Survey,30 smokers’ HEI score was significantly lower than that of nonsmokers’, a fact mainly attributed to the first being less health conscious. In opposition to this survey, the present findings suggest that when type 2 diabetic patients are concerned, cigarette smoking is associated with increased diet quality. A possible explanation might be that smokers in the present sample acknowledged the detrimental effects of smoking on diabetes control and being unable to quit, they aimed for a better diet quality in order to minimize the effects of smoking. Despite the fact that lifestyle modification is emphatically encouraged in the treatment of type 2 diabetes, patients are often defensive and refuse to surrender lifestyle preferences,26 as seen in the present sample. Another example of a defended unhealthy lifestyle factor contributing to increased diet quality in the present sample is excessive alcohol consumption. On both the diabese and the type 2 diabetic patients, excess in the alcohol consumption (>300ml/week) was a pivotal contributor in demonstrating adequate HEI, whereas in the general population alcohol beverage consumption has been associated with a decline in HEI.31 Therefore, according to the SCA, unhealthy lifestyle preferences adopted by adult diabetic patients should not be considered as indicative of their health consciousness, since in many cases they appear to trigger the adoption of a healthier diet, possibly as a mean of defending their habits. The present findings are corroborated by a recent study on American adults that demonstrated higher HEI score among those with diet-related chronic diseases, compared to the apparently healthy ones.32
Our findings demonstrate the existence of a relationship between diet quality and diabetes complications. Further evaluation of this relationship is needed in a longitudinal study assessing diet quality prior to and after the diagnosis of each comorbidity. In addition, the study herein is one of the few to assess diet quality in patients with T2DM with the use of HEI, thus the results are not easily comparable. Limitations of the study include its cross-sectional nature, the relatively small sample and the lack of waist circumference measurements. However, the sample was homogenous, recruited from one clinic only and thus diabetes education was provided by the same experienced team on all subjects. Future research could further evaluate the contribution of unhealthy lifestyle factors on the diet quality of type 2 diabetic patients and could validate HEI through biomarkers. Several issues reported in the present research warrant further investigation and validation of the present findings from larger samples is needed in order to define whether diabetes complications actually trigger better diet quality.
In conclusion, the present findings suggest that adult obese/non-obese patients with T2DM demonstrate adequate diet quality. When diet quality is adjusted to the age, sex and weight status of diabetics, those with comorbid obesity tend to exhibit better diet quality compared to those with T2DM alone. Different complications/comorbidities were associated with T2DM and comorbid obesity compared with T2DM alone and different factors appear to affect the adoption of a high quality diet between the two groups. Unhealthy lifestyle factors like cigarette smoking and alcohol consumption appear to trigger the adoption of a high quality diet, possibly as a defensive action.
FundingNo funding was received in the present study.
Conflict of interestAuthors declare no conflict of interest.
The authors would like to thank all participating patients.