


Several instruments developed to assess dietary intake of groups or populations have strengths and weaknesses that affect their specific application. No self-administered, closed-ended dietary survey was previously used in Argentina to assess current food and nutrient intake on a daily basis.
ObjectiveTo design and validate a self-administered, structured food record (NutriQuid, NQ) representative of the adult Argentine population's food consumption pattern to measure individual energy and nutrient intake.
Materials and methodsRecords were loaded onto a database using software that checks a regional nutrition information system (SARA program), automatically quantifying energy and nutrient intake. NQ validation included two phases: (1) NQ construct validity comparing records kept simultaneously by healthy volunteers (45–75 years) and a nutritionist who provided meals (reference), and (2) verification of whether NQ reflected target population consumption (calories and nutrients), week consumption differences, respondent acceptability, and ease of data entry/analysis. Data analysis included descriptive statistics, repeated measures ANOVA, intraclass correlation coefficient, nonparametric regression, and cross-classification into quintiles.
ResultsThe first validation (study group vs. reference) showed an underestimation (10%) of carbohydrate, fat, and energy intake. Second validation: 109 volunteers (91% response) completed the NQ for seven consecutive days. Record completion took about 9min/day, and data entry 3–6min. Mean calorie intake was 2240±119kcal/day (42% carbohydrates, 17% protein, and 41% fat). Intake significantly increased in the weekend.
ConclusionNQ is a simple and efficient tool to assess dietary intake in large samples.
Diferentes instrumentos para evaluar la ingesta alimentaria grupal o poblacional tienen fortalezas y debilidades que afectan a su aplicación. No existe experiencia nacional con un registro dietético auto-administrado cerrado para evaluar la ingesta actual de alimentos y nutrientes diaria de alimentos.
ObjetivoDiseñar y validar un registro de alimentos estructurado, auto-administrado (NutriQuid [NQ]), representativo del patrón de consumo alimentario de la población argentina adulta para medir la ingesta individual de energía y nutrientes.
Materiales y métodosDesarrollamos un software para incorporar registros en una base de datos y verificar información nutricional (programa SARA), cuantificando automáticamente la ingesta de energía y nutrientes. La validación de NQ incluyó 2 fases: 1) comparación simultánea de registros del NQ completado por voluntarios sanos (45-75 años) y de una nutricionista que preparó las comidas ofrecidas (referencia), y 2) verificación si el NQ reflejó el consumo diferencial de población objetivo (calorías y nutrientes) durante la semana, aceptabilidad por los encuestados y facilidad de ingreso/análisis de datos. Análisis estadístico: incluyó estadística descriptiva, ANOVA de medidas repetidas, coeficiente de correlación intraclase, regresión no paramétrica y clasificación cruzada en quintilos.
ResultadosLa primera validación (voluntarios vs. referencia): mostró una subestimación del 10% de la ingesta de carbohidratos, grasas y energía. Segunda validación: 109 voluntarios (91% de respuesta) completaron el NQ durante 7 días consecutivos. Completar los registros requirió 9min/día y la carga de datos 3-6min. La ingesta calórica promedio fue de 2.240±119kcal/día (42% carbohidratos, 17% proteína y 41% grasa) y aumentó significativamente durante el fin de semana.
ConclusiónEl NQ es una herramienta simple y eficiente para evaluar la ingesta alimentaria en grandes grupos.
Lifestyle modification is the major component of interventions for prevention of chronic diseases such as Type 2 diabetes (T2D), where positive effects on development have been shown.1–3 Thus, these changes are considered the primary therapeutic intervention for T2D prevention and treatment.4,5
Currently, the effects of implementation of a diabetes prevention program based on lifestyle changes (including dietary intake) are being evaluated in the province of Buenos Aires, Argentina.6 Therefore, we need a tool to assess country-specific nutrient and food intake of study participants at the beginning and throughout follow-up.
Measurement of dietary intake is complex and challenging, particularly at group or population level. Appropriate selection of measurement method depends on the objectives of surveillance and the type of information required.7 It also covers prerequisites such as peculiarities of the target population, retrospective/prospective modality, human and financial resources, and data processing availability.8
Different versions of food frequency questionnaires, 24-h dietary recalls, dietary records, dietary history, brief dietary assessment instruments and combinations thereof are methods commonly used. All have strengths and weaknesses affecting their specific application.8,9
For nutritional evaluation of large populations, the survey requires certain conditions to assess the effects of lifestyle change interventions accurately, namely: (1) reflect local or culture-specific eating habits, (2) allow quantitative estimation of food, total energy and specific nutrient intake, and (3) facilitate the record-keeping process, minimizing data load and use of human and economic resources.
Food frequency questionnaires (FFQs) are predominantly used in epidemiological studies with a relevant period of retrospective assessment. However, its use to estimate quantitative parameters is considered inappropriate because estimation nutrient intake is only approximate.8
The 24-hour dietary recall (24h-DR) allows quantitative results, but it also requires trained interviewers and several days of interviews to determine habitual intake involving a high load of record keeping and data coding, and processing.8
The open-ended (unstructured) food record (also known as food diary) provides quantitative results of food and nutrient intake. Data for a defined period of time are recorded, usually three to seven consecutive days.8,9 Its strength is that provides quantitative information, but record-keeping and data processing load is high. It also requires well informed and motivated respondents to register/estimate total foods and beverages consumed precisely (e.g., fat-content, form of preparation). The number of complete records and validity of information decrease as the record continues beyond 4 days, partly due to registration fatigue.8,10 Additionally, recorded foods must be interpreted by a nutritionist before entry into a database for calculation of nutrient and energy intake.11 This latter aspect excludes its use in projects involving large cohorts.
Closed-ended forms of dietary assessment methods facilitate data capture and eliminate coding by using lists of foods or food groups (checklist forms), thus becoming useful for assessments in large cohorts. However, these tools are not suited to our need to minimize record keeping and data processing. Therefore, these prerequisites permit only self-administered tools. Of the existing, validated tools for assessing food intake in Argentina12,13 and the Southern Cone of Latin America,14,15 only one is self-administered16; however, all these measures are FFQs or 24h-DR.
So far no self-administered closed-ended dietary record has been used in Argentina to assess current food and nutrient intake by recording food intake on a daily basis, concurrently with food consumption. Therefore, we attempted to validate a new country-specific, self-administered structured food diary questionnaire, developed for use in Argentina. This questionnaire might facilitate recording of daily food intake, simplify data entry/processing and optimize time, human and economic resources and even evaluate nutrient intake changes in primary health intervention studies.
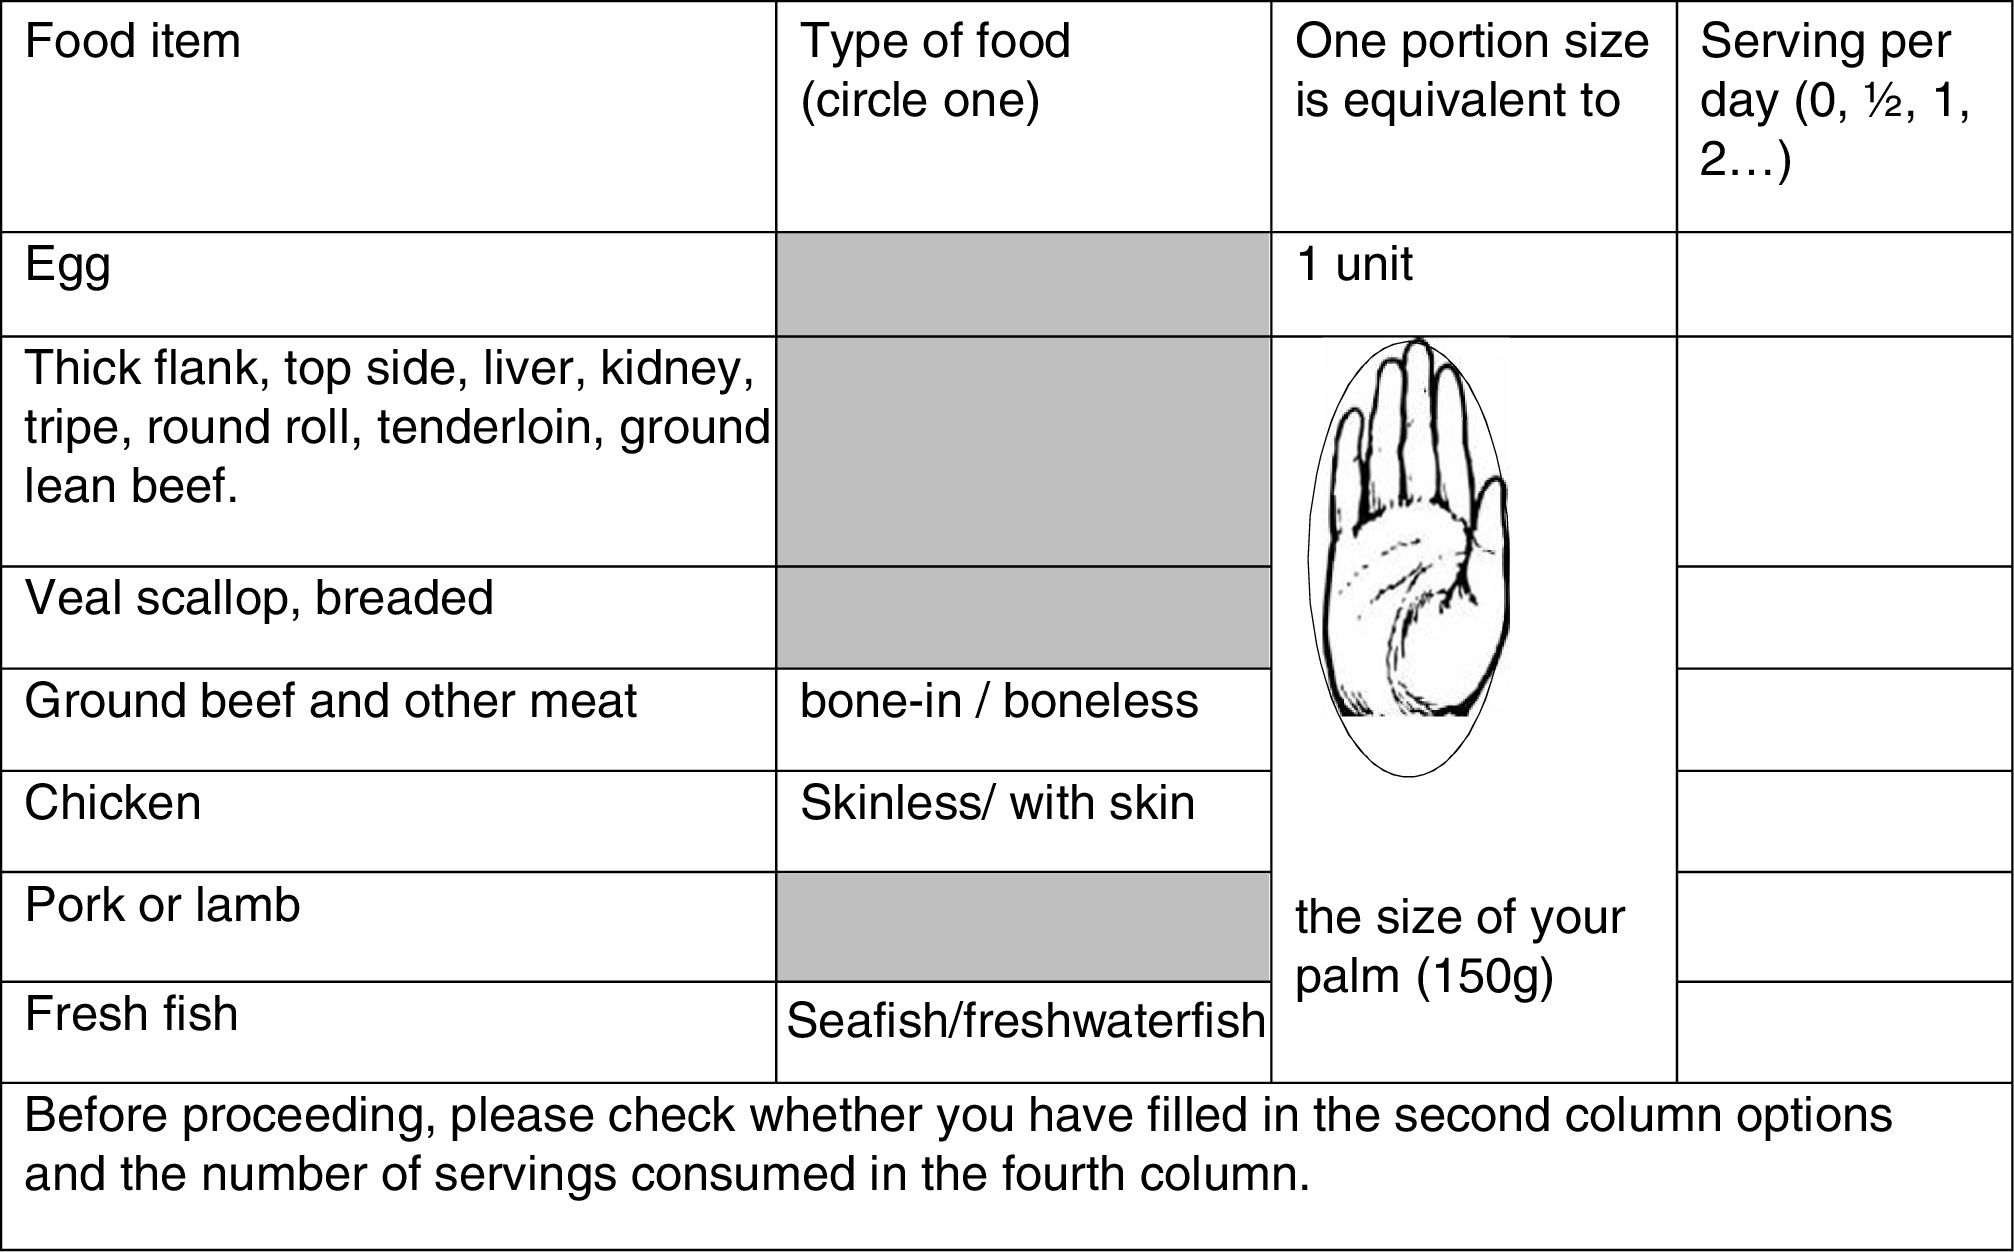
Material and methodsA structured list-based record of daily food intake was developed by an interdisciplinary team (nutritionists, physicians, computer scientists and statisticians) from the Primary Prevention Program of Diabetes of the Province of Buenos Aires (PPDBA). Usual food consumption pattern of the Argentinian population was obtained from several national documents,16–19 to prepare a list of 59 items selected and grouped according to food groups and times of day. Three additional questions were included to estimate sodium intake (Fig. 1). The complete version (2 pages) and instructions may be downloaded from http://www.ppdba.cenexa.org/nutriquid.
. Short-cut of: http://www.ppdba.cenexa.org/nutriquid.")
Fragment of the Argentine structured food record (NutriQuid). Short-cut of: http://www.ppdba.cenexa.org/nutriquid.
The NutriQuid (NQ) record consists of four vertical columns: the first left-hand column lists the selected foods; in the second column, respondents circle their choices by type of preparation or food origin (e.g. sea or freshwater fish). The third column defines the portion size of the corresponding food: the selected portion of meat, pasta and cereals, is accompanied by a drawing. For the other items household measures such as cups and spoons are used. In the fourth column, the respondent registers the total amount of servings of each item consumed daily. Each page ends with a reminder to check for any omissions. One-page printed instructions explain how to use the NQ form (Fig. 1).
The NQ recorded information was loaded into a MySQL database20 using a bespoke software developed using the Symfony 1.4 framework.21 The data loaded was thereafter run through the dietary analysis software package that calculates nutrient intakes based on the total amount of servings of each item consumed, consulting nutritional information from the SARA database.22 Thus, our system quantifies total consumption of energy, protein, carbohydrates, saturated, monounsaturated and polyunsaturated fatty acids, vegetable and animal fats, cholesterol, dietary fiber, sodium, calcium, potassium, various vitamins, and vegetable and fruit consumption.
When the item recorded was not in the SARA program (e.g. some products such as pizza, cakes and pies), the nutritionist team calculated calorie and nutrient content using information from the CENEXA food database23 and Argenfoods.24 Refined sugar content was calculated from manufacturers’ information.
NQ validationValidation included two phases:
First phase. Verification of NQ diet record accuracy: for this purpose, we compared NQ records completed by study participants to those simultaneously completed by the corresponding nutritionist who had defined the composition of foods and meals offered (reference). This activity was implemented between May and July 2014, at Interzonal Hospitals “Prof. Dr. Rossi” and Italiano of La Plata, and at the “Horacio Cestino” of Ensenada, Buenos Aires, Argentina. It included 42 individuals aged 45–69 years (20 women and 22 men) treated in those hospitals, without chronic metabolic diseases, nutritional disorders, cancer or recent surgery, and receiving standard normal diets.
On the morning of the survey, participants received the NQ and its instructions, and were asked to record all meals and drinks they received during the day at their respective hospital. Reference nutritionists simultaneously performed the same task. Although recording was anonymous, respondents wrote the last four numbers of their personal identification card on each NQ, to avoid overlapping data from different people and facilitate further analysis.
Second phase. Verification that NQ recorded data could: (1) reflect caloric and nutrient intake characteristic of our target population according to previous measurements in our region17–19; (2) identify possible differences in food consumption on different days of the week (definition of minimum number of days necessary to attain this aim); (3) be easy to keep for seven days and be well-accepted by the respondent; and (4) simplify data entry and further data processing.
This phase lasted from August to October 2014, incorporating adult volunteers aged 45–75 years living in the same geographical areas as those participating in the PPDBA.
Sample size was determined by seeking a 5% differences in total energy content (this difference considered 110kcal with an expected standard deviation of 200kcal) and assuming a 5% alpha error and a 20% beta error resulting in 106 individuals (two-tailed). We increased this number to 120, considering possible exclusion of incomplete questionnaires and dropouts.
Participants (80 women and 40 men aged 45–75) received the NQ, and were asked to record seven consecutive days of complete food and drinks consumption. The day material was given to participants varied so that the first day of recording included all seven days of the week. At the end of the recording week, food records were collected by a member of the research team.
As in phase 1, records were completed anonymously, but participants wrote the last four digits of their identification card on the NQ to avoid overlapping data from different participants and to facilitate further analysis.
Ethics statementThis study was conducted according to Helsinki Declaration guidelines, and all procedures involving human subjects were approved by the Ethics Committee of the National University of La Plata, Argentina.
Statistical analysesFirst phase: we used descriptive statistical techniques to estimate total energy consumption, carbohydrates, protein, fat and micronutrients recorded in the NQ. Subsequently, the percentage difference between values recorded by volunteers and reference nutritionist for each variable was calculated and tested for significance (for paired data). Pearson correlation coefficients and cross-classification by quintiles of intake were also determined.
Second phase (7 consecutive days individual records), ANOVA for repeated measures was used to assess differences between individual daily records; also the intra-class correlation coefficient (ICC) from a two-way mixed ANOVA model as a measure of test-retest reliability of each NQ component. ICC assessed reproducibility of daily measurements of the same person for each NQ component (total energy and different nutrients) throughout the study week. SPSS 17.0 software and CSS/Statistica (v6, Statsoft Corp) were used for descriptive statistics and for testing internal test-retest reliability. Quantitative variables were expressed as mean±standard deviation. Values of p≤0.05 (two-tailed) were considered statistically significant.
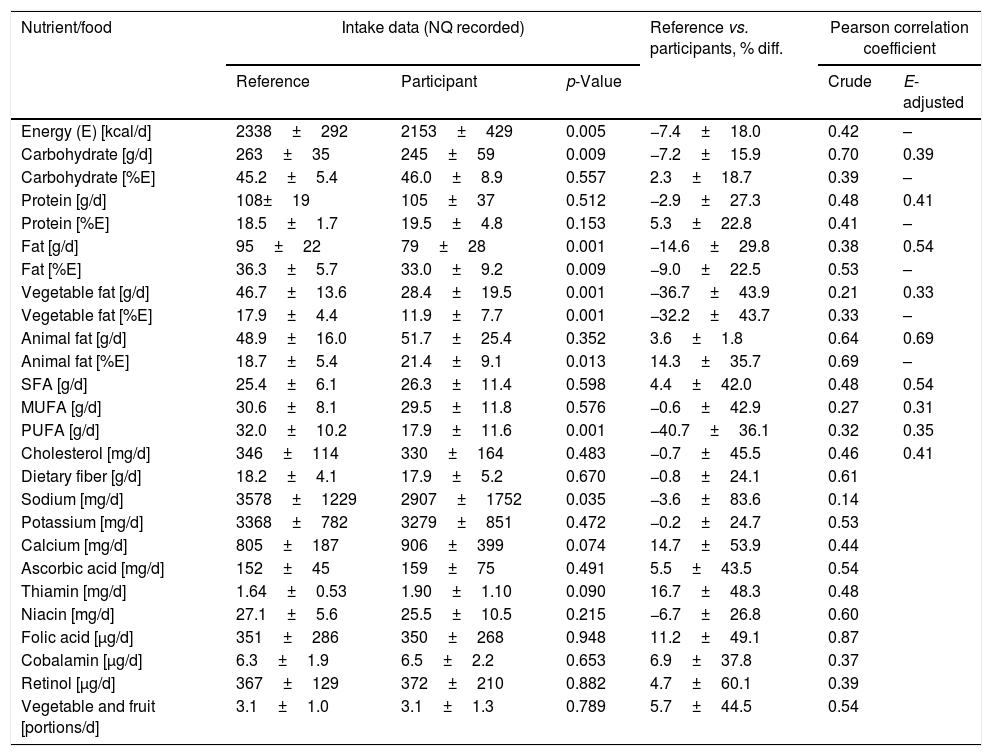
ResultsFirst validation phaseComparison between NQ of participants and those of the reference nutritionist showed no significant differences in mean protein intake (108g/day reference vs. 105g/day). A slight but significant underestimation of about 10% was observed for energy (Δ-7%), carbohydrates (Δ-7%) and total fat (Δ-14%). The third was due to a marked difference in vegetable fat affecting polyunsaturated fatty acids as well (Table 1). No significant differences were observed for other parameters except sodium (p=0.035).
Comparison of structured food record (NutriQuid) as completed by nutritionist vs. participants.
| Nutrient/food | Intake data (NQ recorded) | Reference vs. participants, % diff. | Pearson correlation coefficient | |||
|---|---|---|---|---|---|---|
| Reference | Participant | p-Value | Crude | E-adjusted | ||
| Energy (E) [kcal/d] | 2338±292 | 2153±429 | 0.005 | −7.4±18.0 | 0.42 | – |
| Carbohydrate [g/d] | 263±35 | 245±59 | 0.009 | −7.2±15.9 | 0.70 | 0.39 |
| Carbohydrate [%E] | 45.2±5.4 | 46.0±8.9 | 0.557 | 2.3±18.7 | 0.39 | – |
| Protein [g/d] | 108±19 | 105±37 | 0.512 | −2.9±27.3 | 0.48 | 0.41 |
| Protein [%E] | 18.5±1.7 | 19.5±4.8 | 0.153 | 5.3±22.8 | 0.41 | – |
| Fat [g/d] | 95±22 | 79±28 | 0.001 | −14.6±29.8 | 0.38 | 0.54 |
| Fat [%E] | 36.3±5.7 | 33.0±9.2 | 0.009 | −9.0±22.5 | 0.53 | – |
| Vegetable fat [g/d] | 46.7±13.6 | 28.4±19.5 | 0.001 | −36.7±43.9 | 0.21 | 0.33 |
| Vegetable fat [%E] | 17.9±4.4 | 11.9±7.7 | 0.001 | −32.2±43.7 | 0.33 | – |
| Animal fat [g/d] | 48.9±16.0 | 51.7±25.4 | 0.352 | 3.6±1.8 | 0.64 | 0.69 |
| Animal fat [%E] | 18.7±5.4 | 21.4±9.1 | 0.013 | 14.3±35.7 | 0.69 | – |
| SFA [g/d] | 25.4±6.1 | 26.3±11.4 | 0.598 | 4.4±42.0 | 0.48 | 0.54 |
| MUFA [g/d] | 30.6±8.1 | 29.5±11.8 | 0.576 | −0.6±42.9 | 0.27 | 0.31 |
| PUFA [g/d] | 32.0±10.2 | 17.9±11.6 | 0.001 | −40.7±36.1 | 0.32 | 0.35 |
| Cholesterol [mg/d] | 346±114 | 330±164 | 0.483 | −0.7±45.5 | 0.46 | 0.41 |
| Dietary fiber [g/d] | 18.2±4.1 | 17.9±5.2 | 0.670 | −0.8±24.1 | 0.61 | |
| Sodium [mg/d] | 3578±1229 | 2907±1752 | 0.035 | −3.6±83.6 | 0.14 | |
| Potassium [mg/d] | 3368±782 | 3279±851 | 0.472 | −0.2±24.7 | 0.53 | |
| Calcium [mg/d] | 805±187 | 906±399 | 0.074 | 14.7±53.9 | 0.44 | |
| Ascorbic acid [mg/d] | 152±45 | 159±75 | 0.491 | 5.5±43.5 | 0.54 | |
| Thiamin [mg/d] | 1.64±0.53 | 1.90±1.10 | 0.090 | 16.7±48.3 | 0.48 | |
| Niacin [mg/d] | 27.1±5.6 | 25.5±10.5 | 0.215 | −6.7±26.8 | 0.60 | |
| Folic acid [μg/d] | 351±286 | 350±268 | 0.948 | 11.2±49.1 | 0.87 | |
| Cobalamin [μg/d] | 6.3±1.9 | 6.5±2.2 | 0.653 | 6.9±37.8 | 0.37 | |
| Retinol [μg/d] | 367±129 | 372±210 | 0.882 | 4.7±60.1 | 0.39 | |
| Vegetable and fruit [portions/d] | 3.1±1.0 | 3.1±1.3 | 0.789 | 5.7±44.5 | 0.54 | |
Values represent means±SD. N=42 cases for all parameters. Means, mean differences and Pearson correlation coefficients related to intakes of energy and nutrients and two food groups (vegetable and fruit) based on data derived from Argentine food records NutriQuid (NQ) completed by untrained participants vs. those completed by nutritionists (reference).
Correlation coefficients of energy-unadjusted values for energy and macronutrients (carbohydrates, protein, total fat) recorded by participants and reference varied from 0.38 for total fat to 0.70 for carbohydrates. After energy adjustment, they ranged from 0.39 to 0.54 (Table 1).
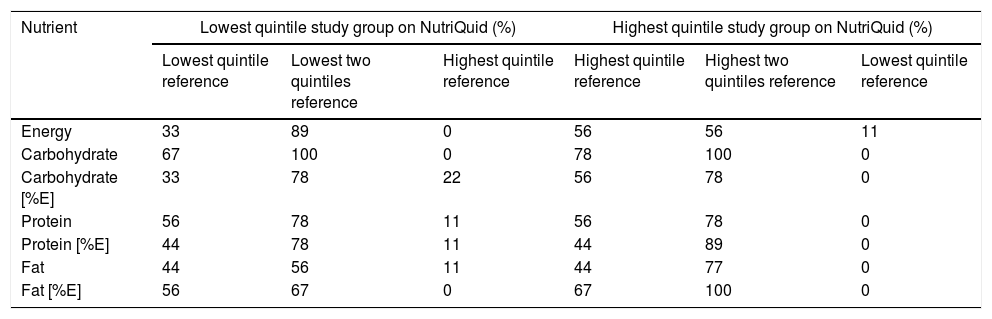
Cross-classification by quintiles of energy, carbohydrate, protein, and total fat intakes (g/day and %E) of study group participants and their reference are shown in Table 2. Overall, 78% of participants in the lowest NQ quintile were in the lowest one or two reference quintiles, and 83% of those in the highest NQ quintile were in the highest one or two reference quintiles. On average, less than 10% were misclassified into extreme quintiles.
Cross-classification by quintiles of non-energy adjusted intakes for the structured food record (NutriQuid) obtained from records completed by study group participants vs. nutrition experts (reference).
| Nutrient | Lowest quintile study group on NutriQuid (%) | Highest quintile study group on NutriQuid (%) | ||||
|---|---|---|---|---|---|---|
| Lowest quintile reference | Lowest two quintiles reference | Highest quintile reference | Highest quintile reference | Highest two quintiles reference | Lowest quintile reference | |
| Energy | 33 | 89 | 0 | 56 | 56 | 11 |
| Carbohydrate | 67 | 100 | 0 | 78 | 100 | 0 |
| Carbohydrate [%E] | 33 | 78 | 22 | 56 | 78 | 0 |
| Protein | 56 | 78 | 11 | 56 | 78 | 0 |
| Protein [%E] | 44 | 78 | 11 | 44 | 89 | 0 |
| Fat | 44 | 56 | 11 | 44 | 77 | 0 |
| Fat [%E] | 56 | 67 | 0 | 67 | 100 | 0 |
The NQ recorded data demonstrated that the one completed by the study group generated results comparable to those completed by the reference, with an underestimation in macronutrients of about 10%. Total fat difference recorded was affected by an underestimation of vegetable fat intake.
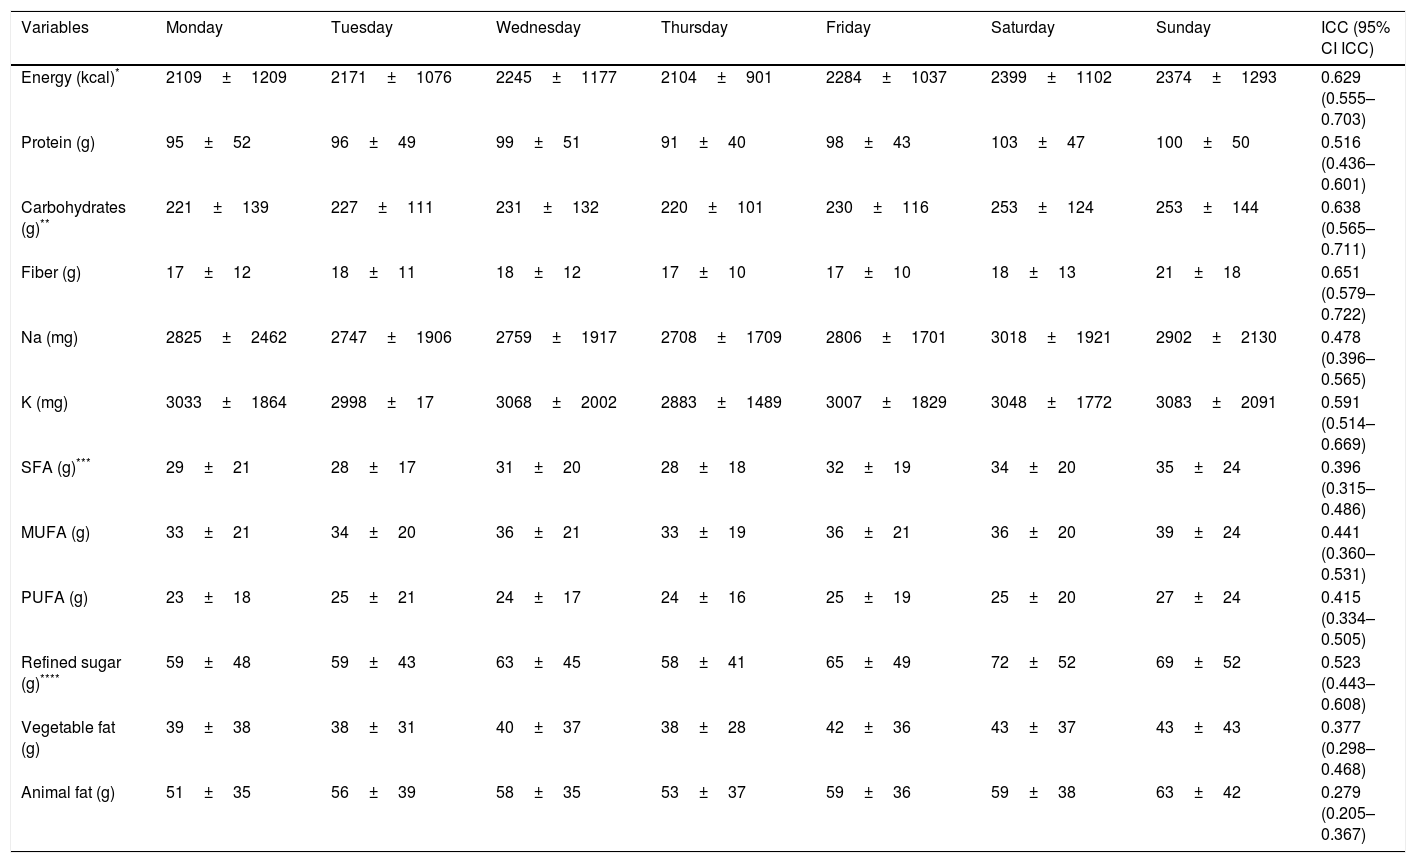
Second phaseNinety-one percent of the 120 invited participants returned their completed questionnaires, thus gathering 763 records of daily food intake over seven consecutive days (Table 3).
Daily consumption of energy and nutrients.
| Variables | Monday | Tuesday | Wednesday | Thursday | Friday | Saturday | Sunday | ICC (95% CI ICC) |
|---|---|---|---|---|---|---|---|---|
| Energy (kcal)* | 2109±1209 | 2171±1076 | 2245±1177 | 2104±901 | 2284±1037 | 2399±1102 | 2374±1293 | 0.629 (0.555–0.703) |
| Protein (g) | 95±52 | 96±49 | 99±51 | 91±40 | 98±43 | 103±47 | 100±50 | 0.516 (0.436–0.601) |
| Carbohydrates (g)** | 221±139 | 227±111 | 231±132 | 220±101 | 230±116 | 253±124 | 253±144 | 0.638 (0.565–0.711) |
| Fiber (g) | 17±12 | 18±11 | 18±12 | 17±10 | 17±10 | 18±13 | 21±18 | 0.651 (0.579–0.722) |
| Na (mg) | 2825±2462 | 2747±1906 | 2759±1917 | 2708±1709 | 2806±1701 | 3018±1921 | 2902±2130 | 0.478 (0.396–0.565) |
| K (mg) | 3033±1864 | 2998±17 | 3068±2002 | 2883±1489 | 3007±1829 | 3048±1772 | 3083±2091 | 0.591 (0.514–0.669) |
| SFA (g)*** | 29±21 | 28±17 | 31±20 | 28±18 | 32±19 | 34±20 | 35±24 | 0.396 (0.315–0.486) |
| MUFA (g) | 33±21 | 34±20 | 36±21 | 33±19 | 36±21 | 36±20 | 39±24 | 0.441 (0.360–0.531) |
| PUFA (g) | 23±18 | 25±21 | 24±17 | 24±16 | 25±19 | 25±20 | 27±24 | 0.415 (0.334–0.505) |
| Refined sugar (g)**** | 59±48 | 59±43 | 63±45 | 58±41 | 65±49 | 72±52 | 69±52 | 0.523 (0.443–0.608) |
| Vegetable fat (g) | 39±38 | 38±31 | 40±37 | 38±28 | 42±36 | 43±37 | 43±43 | 0.377 (0.298–0.468) |
| Animal fat (g) | 51±35 | 56±39 | 58±35 | 53±37 | 59±36 | 59±38 | 63±42 | 0.279 (0.205–0.367) |
Values represent means±SD.
The time required to complete the survey was about 9min per day (7–14min) and 3–6min to enter each NQ registry into the database depending on the operator. Thereafter, the software automatically converted the loaded data into values of energy and nutrient intake (see “Materials and methods” section).
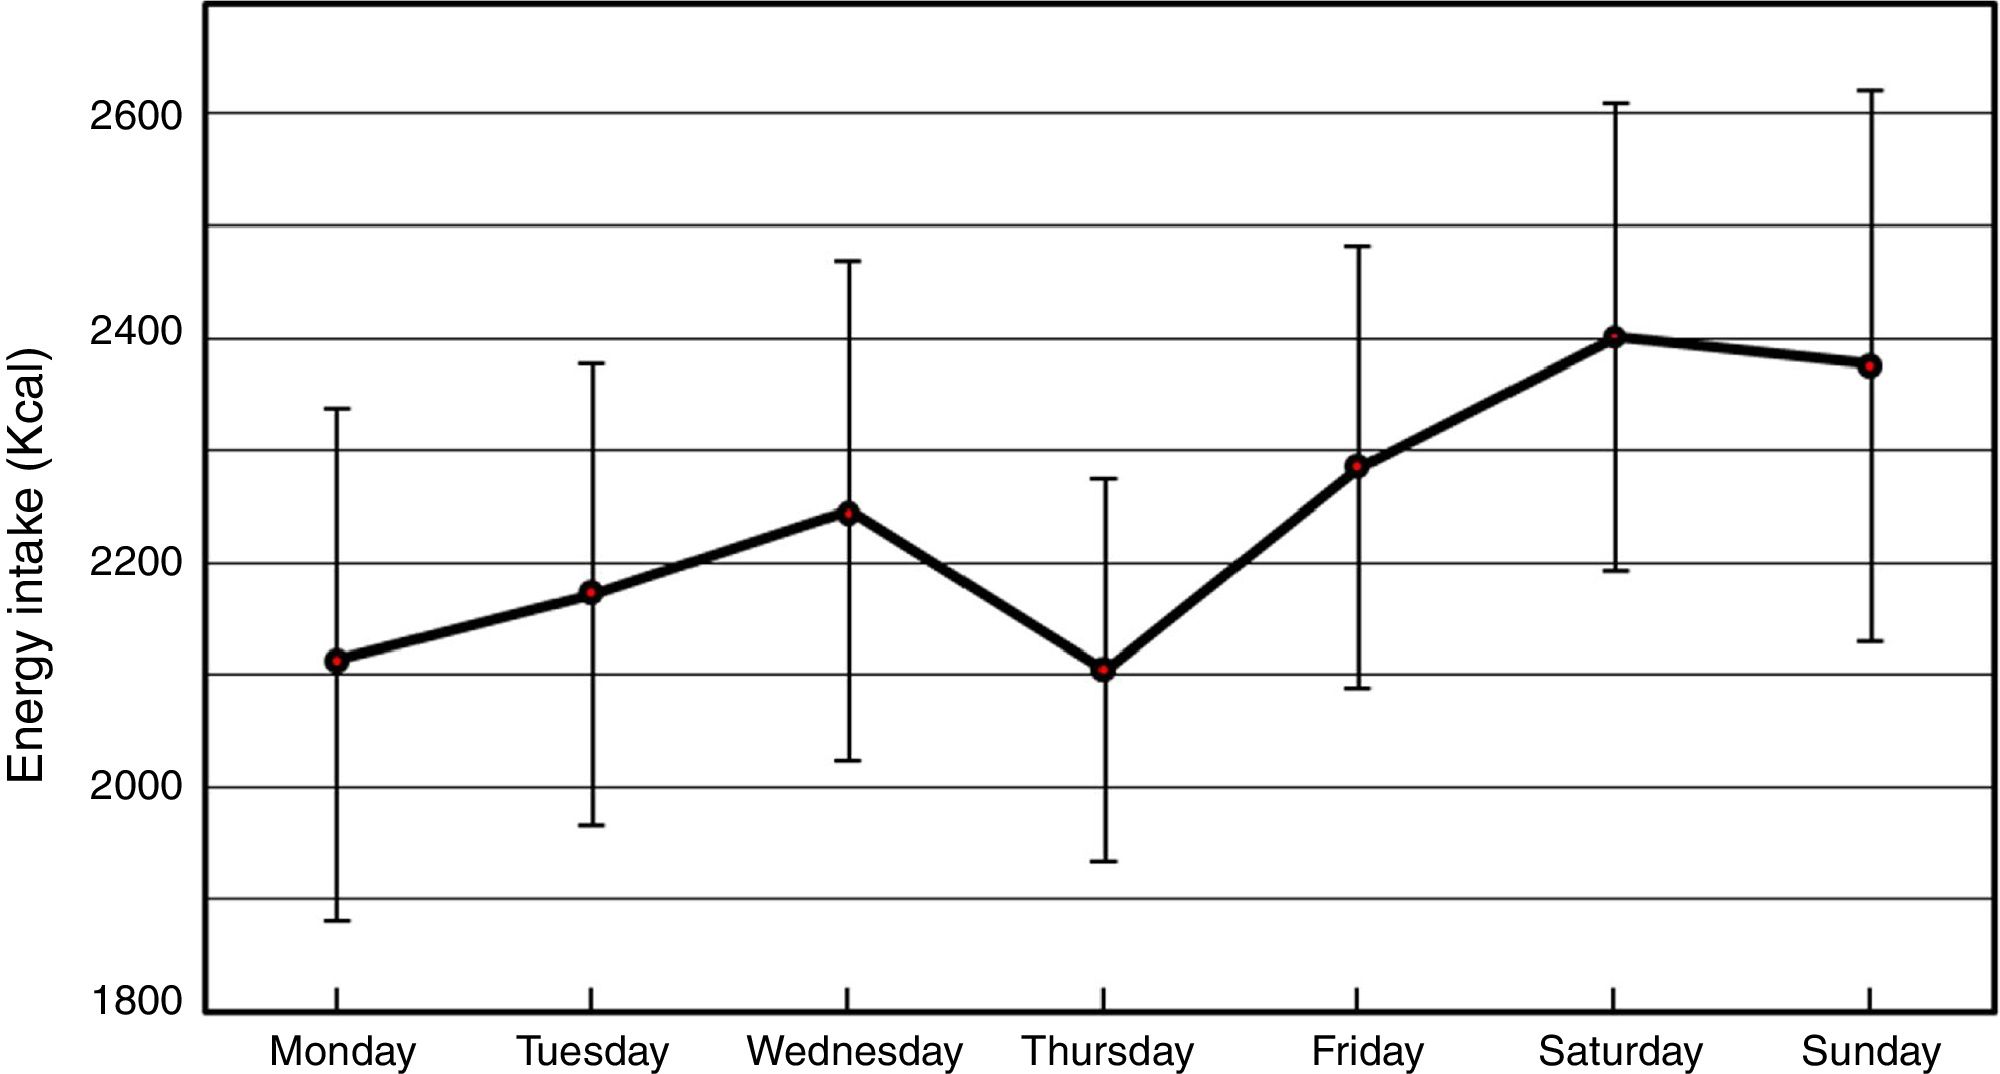
Regarding reproducibility, daily average caloric intake per week was 2240±119kcal/day. Of total daily energy consumed, protein accounted for 17%, carbohydrate for 42% and fat for 41%. Refined sugars accounted for 27% and animal fats 58% of total carbohydrates and fat, respectively (Table 3).
Energy consumption increased on Saturdays and Sundays, with a high correlation between the two weekend days (0.99) (Fig. 2).

Comparing variation in daily energy intake and in various nutrients throughout the week, we identified (Table 3):
- •
Significant differences in total energy, carbohydrates, saturated fatty acids, refined sugars, and vegetable fat but not in the remaining nutrients. These variations resulted from higher consumption over the weekend.
- •
Higher consumption over the weekend induced significant differences in total energy, carbohydrates, saturated fatty acids, refined sugars, and vegetable fat but not in the remaining nutrients.
- •
ICC values for each dietary component ranged from 0.27 to 0.64 for animal fats and carbohydrates, respectively.
We developed a self-administered-closed-ended record of daily food intake for adults in Argentina to assess individual nutrient intake in large cohort intervention studies. For economic and infrastructure considerations, we used a paper-based version rather than a computer-based tool used by others.25
We did not compare our NQ (phase 1) with other assessment methods, such as a FFQ or 24h-DR, because their specific problems/limitations would have led to a methodological biases aggregation impeding clear data interpretation. Instead, we chose an intra-methodological approach in a controlled setting: comparison of untrained respondents to a nutritionist reference (true value). In fact, this test represents a great challenge for the method because it compares data provided by a nutritionist science professional who prepared the meals with the data provided by untrained volunteers in the field of nutrition. The small difference in the data provided by the reference nutritionist and the volunteer, indicates the easy comprehension of the NutriQuid protocol.
The NQ food record showed moderate to good validity for energy, nutrient, vegetable and fruit consumption, except vegetable fat intake (p<0.001, r=0.214). We found underreporting of energy and nutrient intake, common in dietary assessment methods, specifically in fat intake.26–29 Our food records data analysis showed that a quarter of participants forgot/neglected to record oil used for salads and other dishes. This contributed greatly to the mean difference in total fat, polyunsaturated fatty acid and energy intake between participants and reference records. Consequently, to improve NQ efficiency, we will modify the instruction leaflet introducing an easy household guide to help participants to estimate portion size consumed and stressing the importance of recording oil used in meal preparation.
Calculation of sodium intake (p=0.035, r=0.144) was influenced by additional information submitted by respondents at the end of the food record, but its integration was perhaps difficult due to the data collection format. The underestimation of salt, vegetable oil (source of PUFA) and grated cheese (source of calcium) by the participants, could be ascribed to the fact that their content in the tested meals was known and thus appropriately recorded by the reference nutritionist while this knowledge was completely ignored by the participants. Other authors also reported difficulties in estimating intake of certain foods, in particular salt, oil, and added fat.26–28 Therefore, we need to change the layout and wording of the salt section; for this purpose we will add, in the guide of homemade food measurements, a paragraph emphasizing the importance of careful estimation of salt consumption. We will further add a drawing with different serving sizes using a teaspoon and its fractions.
Our NQ validity indicators are comparable to those reported by other local authors using different methodology.13,15 In fact, a validation study of FFQ vs. 24h-DR conducted in urban Rosario, Argentina, in a comparable age-group, reported similar r-values for energy and fat intake and lower levels for protein and carbohydrate intake.13 A survey in southern Latin America (Argentina, Chile, and Uruguay) using a FFQ in a 21–74-year age-group found comparable results.15
Comparison with other validation studies may be limited by their different methodological approaches. Recent studies compared two methods (new against an established method), but recording periods differed (winter and spring). Impact of seasonal differences in food availability have been identified in a recent meta-analysis.29 The advantages of our intra-methodological approach stem from the use of coincident record periods and comparison of data from the target group applying the new tool vs. estimated values from the reference experts (as opposed to another self-reported measure). This approach was only possible in a closed setting (using hospital in-patients).
Acceptability of the NQ by respondents was good, as demonstrated by the 91% response observed in the second validation phase, confirming that it offers easy record-keeping. Self-administered questionnaires are economically advantageous compared to other methods.30 It also saves time spent on interviews, thereby decreasing implementation time and cost, important elements for massive data collection. Also, the time needed to fill in the NQ (average 9min) and to upload records to the database (average 3–6min) was relatively short.
The software developed to evaluate nutrient intake from this survey by consultation with different databases enabled their immediate full identification (Table 3) and reflected the caloric and macronutrient intake characteristics of our target population (Argentinian adults, 45–75 years old).17–19
NQ sensitivity allowed to detection of small changes in energy and nutrient consumption, e.g., detection of small changes in daily intake between weekdays and weekends. The weekly NQ assessment also demonstrated highly acceptable ICC values for total energy, carbohydrates, refined sugars, protein, fiber, sodium, and potassium, but lower for vegetable and animal fat.
The test–retest examination also showed lower consistency (ICC) for fat components. Considering the high correlation between weekdays and between weekend days, three or four days (including one weekend day) instead of seven-day records would reduce record keeping and data processing, a conclusion supported by reports of registration fatigue.8,10
Despite these advantages, the NQ has some limitations: designed and validated in an adult population (45–75 years), it was intended for application in the PPDBA, targeting this age-group (http://www.ppdba.cenexa.org/el_programa). Hence, it should be validated for other age-groups. However, this limitation would be a strength when the NQ is used for similar purposes. It should also be noted that the selection of foods included in the survey was based on normative consumption of foods in Argentina17,19; therefore, adaptation to local conditions is needed for use in regions with different food habits. The comparatively low number of food items in the NQ seemed appropriate for our region and also decreased respondent burden.
In conclusion, the NQ is an easy-to-use, low-cost tool enabling reasonably accurate assessment of dietary intake in medium to large adult populations in Argentina. Further research is needed to demonstrate its benefits and applicability in different age groups and pathological conditions.
FundingThis work was partially supported by the Ministerio de Ciencia, Tecnología e Innovación Productiva of Argentina (grant number PID 0051-2012).
Conflict of interestThe authors declare that they have no conflict of interest.