


Few studies assessing the relationship between single nucleotide polymorphisms in CNR2 and obesity or its related metabolic parameters are available.
ObjectiveTo investigate the influence of polymorphism rs3123554 in the CNR2 receptor gene on obesity anthropometric parameters, insulin resistance, and adipokines in subjects with obesity.
DesignThe study population consisted of 1027 obese subjects, who were performed bioelectrical impedance analyses, blood pressure measurements, serial assessments of dietary intake during three days, and biochemical tests.
ResultsGenotypes GG, GA, and AA were found in 339 (33.0%), 467 (45.5%), and 221 (21.5%) respectively. Body mass index, weight, fat mass, waist circumference, insulin, HOMA-IR, and triglyceride and leptin levels were higher in A-allele carriers as compared to non A-allele carriers. No differences were seen in these parameters between the GA and AA genotypes. There were no statistical differences in dietary intake.
ConclusionThe main study finding was the association of the minor allele of the SNP rs3123554 in the CNR2 gene with body weight and triglyceride, HOMA-IR, insulin, and leptin levels.
Existen pocos estudios que evalúen la relación entre los polimorfismos de un único nucleótidode CNR2 y la obesidad o sus parámetros metabólicos.
ObjetivoEl objetivo de nuestro estudio fue investigar la influencia del polimorfismo rs3123554 del gen del receptor CNR2 sobre los parámetros antropométricos de la obesidad, la resistencia a la insulina y las adipocitocinas en sujetos con obesidad.
DiseñoSe analizó una población de 1.027 sujetos obesos. Se determinó la masa grasa con bioimpedancia eléctrica, se midió la presión arterial, se evaluó la ingesta nutricional durante 3 días y se realizó un análisis bioquímico.
ResultadosDel total, 339 pacientes (33,0%) tuvieron el genotipo GG, 467 pacientes GA (45,5%) y 221 pacientes AA (21,5%). El índice de masa corporal, peso, masa grasa, circunferencia de cintura, insulina, HOMA-IR, triglicéridos y niveles de leptina fueron mayores en los portadores de alelo A que en los no portadores. No se detectaron diferencias en estos parámetros entre los genotipos GA y AA. No se detectaron diferencias estadísticas en la ingesta dietética.
ConclusiónEl principal hallazgo de este estudio es la asociación del alelo menor (A) de rs3123554 SNP del gen CNR2 con el peso corporal y los triglicéridos, HOMA-IR, la insulina y los niveles de leptina.
In Western countries, the prevalence of obesity with related diseases diabetes mellitus, hypertension and dyslipemia is still growing and has reached epidemic proportions. Not only environmental, but also genetic factors contribute to the development of obesity.1
In this scenario, the important role played by the endocannabinoid system is emerging. The cannabinoid receptor system consists of two receptors (CNR1 and CNR2). CNR1 is mainly located in the brain: its role in eating behavior is well established and has already led to therapeutically approaches in the treatment of obesity.2 In contrast, CNR2 has been referred to as the peripheral cannabinoid receptor isoform that is mainly expressed in cells of the immune system. The endogenous cannabinoid system mediates and is positioned both functionally and anatomically3 to be an important modulator of normal human brain behavior. This system consists of endogenous ligands 2-arachidonoylglycerol (2-AG) and anandamide (ADA), and the above-mentioned two types of G-protein-coupled cannabinoid receptor. A greater insight into the endocannabinoid system has been derived from studies in animals with a genetic deletion of the CNR1 receptor, which have a lean phenotype and are resistant to diet-induced obesity and the associated insulin resistance induced by a high palatable high-fat diet.4 Otherwise, a single nucleotide polymorphism rs1049353 of the CNR1 gene resulting in the substitution of the G to A at nucleotide position 1359 in codon 435 (Thr), was reported as a common polymorphism in Caucasian population,5-7 with metabolic implications. Interestingly, there is few evidence of CNR2 SNPs and obesity or its related metabolic parameters.
The aim of our study was to investigate the influence of the polymorphism (rs3123554) of CNR2 receptor gene on obesity anthropometric parameters, insulin resistance and adipokines in subjects with obesity.
Subjects and methodsSubjectsA population of 1027 obese (body mass index>=30) non diabetic patients was analyzed in a prospective way. These patients were recruited in a Nutrition Clinic Unit and signed an informed consent. A Local ethical committee approved the protocol. Exclusion criteria included history of cardiovascular disease or stroke during the previous 36 months, total cholesterol >300mg/dl, triglycerides >400mg/dl, blood pressure >140/90mmHg, fasting plasma glucose >110mg/dl, as well as the use of drugs to treat diabetes mellitus, glucocorticoids, antineoplasic agents, angiotensin receptor blockers, angiotensin converting enzyme inhibitors and psychoactive medications.
Experimental designAll patients with a 2 weeks weight-stabilization period before recruitment were enrolled. Weight, blood pressure, basal glucose, c-reactive protein (CRP), insulin, insulin resistance (HOMA-IR), total cholesterol, LDL-cholesterol, HDL-cholesterol, triglycerides and adipokines (leptin, adiponectin, resistin, TNF alpha, and interleukin 6) levels were measured in all subjects. A bioimpedance and a prospective serial assessment of nutritional intake with 3 days written food records were realized. Genotype of CNR2 receptor gene polymorphism was studied.
Analytical proceduresPlasma glucose levels were determined by using an automated glucose oxidase method (Glucose analyser 2, Beckman Instruments, Fullerton, CA). Insulin was measured by RIA (RIA Diagnostic Corporation, Los Angeles, CA) with a sensitivity of 0.5mUI/L (normal range 0.5–30mUI/L)8 and the homeostasis model assessment for insulin sensitivity (HOMA-IR) was calculated using these values.9 CRP was measured by immunoturbimetry (Roche Diagnostics GmbH, Mannheim, Germany), with a normal range of (0–7mg/dl) and analytical sensitivity 0.5mg/dl. Serum total cholesterol and triglyceride concentrations were determined by enzymatic colorimetric assay (Technicon Instruments, Ltd., New York, NY, USA), while HDL cholesterol was determined enzymatically in the supernatant after precipitation of other lipoproteins with dextran sulfate-magnesium. LDL cholesterol was calculated using Friedewald formula.10
Leptin was measured by ELISA (Diagnostic Systems Laboratories, Inc., Texas, USA) with a sensitivity of 0.05ng/ml and a normal range of 10–100ng/ml.11 Resistin was measured by ELISA (Biovendor Laboratory, Inc., Brno, Czech Republic) with a sensitivity of 0.2ng/ml with a normal range of 4–12ng/ml.12 Adiponectin was measured by ELISA (R&D systems, Inc., Minneapolis, USA) with a sensitivity of 0.246ng/ml and a normal range of 8.65–21.43ng/ml.13 Interleukin 6 and TNF alpha were measured by ELISA (R&D systems, Inc., Minneapolis, USA) with a sensitivity of 0.7pg/ml and 0.5pg/ml, respectively. Normal values of IL6 was (1.12–12.5pg/ml) and TNFalpha (0.5–15.6pg/ml).14,15
GenotypingOligonucleotide primers and probes were designed with the Beacon Designer 5.0 (Premier Biosoft International®, Los Angeles, CA). The polymerase chain reaction (PCR) was carried out with 50ng of genomic DNA, 0.5μL of each oligonucleotide primer (primer forward: 5′-ACGTTGGATGATTGTACCGAGGAGGGAACT-3′ and reverse 5′-ACGTTGGATGGAGACACGTATTCTAGTCCC-3′ in a 2μL final volume (Termociclador Life Technologies, Los Angeles, CA). DNA was denaturated at 95°C for 3min; this was followed by 45 cycles of denaturation at 95°C for 15s, and annealing at 59.3°C for 45s). The PCR were run in a 25μL final volume containing 12.5μL of IQTM Supermix (Bio-Rad®, Hercules, CA) with hot start Taq DNA polymerase Hardy–Weinberg equilibrium was assessed with a statistical test (Chi-square) to compare our expected and observed counts. The variant were in Hardy–Weinberg equilibrium (p=0.03).
Anthropometric procedures and blood pressureBody weight was measured to an accuracy of 0.1kg and body mass index computed as body weight/(height2). Waist (narrowest diameter between xiphoid process and iliac crest) and hip (widest diameter over greater trochanters) circumferences to derive waist-to hip ratio (WHR) were measured, too. Tetrapolar body electrical bioimpedance was used to determine body composition with an accuracy of 5g.16 An electric current of 0.8mA and 50kHz was produced by a calibrated signal generator (Biodynamics Model 310e, Seattle, WA, USA) and applied to the skin using adhesive electrodes placed on right-side limbs. Resistance and reactance were used to calculate total body water, fat and fat-free mass. Blood pressure was measured twice after a 10min rest with a random zero mercury sphygmomanometer (Omrom, Los Angeles, CA), and averaged.
Dietary intake and habitsAll enrolled subjects received instruction to record their daily dietary intake for three days including a weekend day. Handling of the dietary data was by means of a personal computer equipped with personal software, incorporating use of food scales and models to enhance portion size accuracy. Records were reviewed by a dietitian and analyzed with a computer-based data evaluation system. National composition food tables were used as a reference.17 The exercise was recorded by each subjects as total minutes per week of physical activity.
Statistical analysisSample size was calculated to detect differences over 4kg in body weight with 90% power and 5% significance (n=1000). The results were expressed as average±standard deviation. The distribution of variables was analyzed with Kolmogorov–Smirnov test. Quantitative variables with normal distribution were analyzed with a two-tailed Student's-t test. Quantitative variables were analyzed with an ANOVA test with three groups of genotype (GG, GA, AA) and Bonferroni test as a post hoc test. Non-parametric variables were analyzed with the Mann–Whitney U test. Qualitative variables were analyzed with the chi-square test, with Yates correction as necessary, and Fisher's test. A p-value under 0.05 was considered statistically significant.
ResultsOne thousand and twenty seven obese subjects gave informed consent and were enrolled in the study. The mean age was 45.8±13.1 years and the mean BMI 36.3±5.2. All subjects were weight stable during the 2 weeks period preceding the study (body weight change, 0.18±0.1kg).
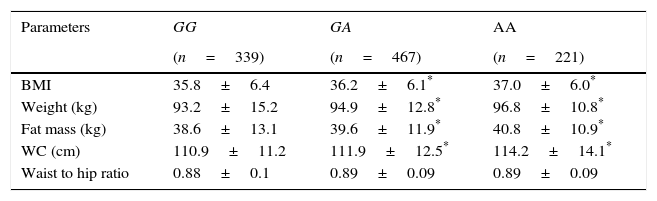
Three hundred and thirty nine patients (33.0%) had the genotype GG, 467 patients GA (45.5%) and 221 patients AA (21.5%). Age was similar in the 3 genotype groups (GG; 44.9±11.6 years vs GA; 45.9±12.8 years vs AA; 45.2±9.6 years: ns). Sex distribution was similar in different genotype groups (GG; 22.9% males vs 77.1% females vs GA; 29.9% males vs 71.0% females vs AA; 28.6% males vs 71.4% females: ns). Table 1 shows the anthropometric variables. BMI, weight, fat mass and waist circumference were higher in A allele carriers than non-A allele carriers. No differences in anthropometric parameters were detected between GA and AA genotypes.
Anthropometric variables.
| Parameters | GG | GA | AA |
|---|---|---|---|
| (n=339) | (n=467) | (n=221) | |
| BMI | 35.8±6.4 | 36.2±6.1* | 37.0±6.0* |
| Weight (kg) | 93.2±15.2 | 94.9±12.8* | 96.8±10.8* |
| Fat mass (kg) | 38.6±13.1 | 39.6±11.9* | 40.8±10.9* |
| WC (cm) | 110.9±11.2 | 111.9±12.5* | 114.2±14.1* |
| Waist to hip ratio | 0.88±0.1 | 0.89±0.09 | 0.89±0.09 |
WC: waist circumference. No statistical differences between groups.
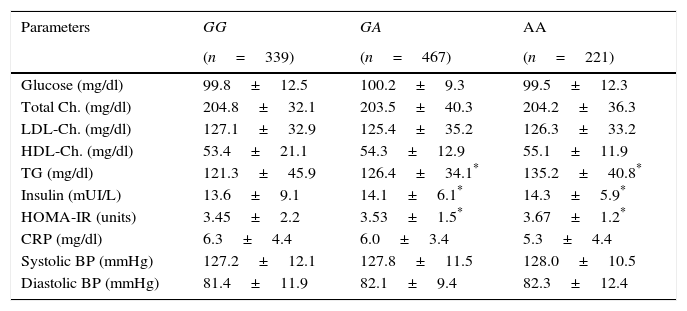
Table 2 shows the classic cardiovascular risk factors. Triglycerides, insulin and HOMA-IR values were higher in A allele carriers than non A allele carriers. No differences in biochemical parameters were detected between GA and AA genotypes.
Classical cardiovascular risk factors.
| Parameters | GG | GA | AA |
|---|---|---|---|
| (n=339) | (n=467) | (n=221) | |
| Glucose (mg/dl) | 99.8±12.5 | 100.2±9.3 | 99.5±12.3 |
| Total Ch. (mg/dl) | 204.8±32.1 | 203.5±40.3 | 204.2±36.3 |
| LDL-Ch. (mg/dl) | 127.1±32.9 | 125.4±35.2 | 126.3±33.2 |
| HDL-Ch. (mg/dl) | 53.4±21.1 | 54.3±12.9 | 55.1±11.9 |
| TG (mg/dl) | 121.3±45.9 | 126.4±34.1* | 135.2±40.8* |
| Insulin (mUI/L) | 13.6±9.1 | 14.1±6.1* | 14.3±5.9* |
| HOMA-IR (units) | 3.45±2.2 | 3.53±1.5* | 3.67±1.2* |
| CRP (mg/dl) | 6.3±4.4 | 6.0±3.4 | 5.3±4.4 |
| Systolic BP (mmHg) | 127.2±12.1 | 127.8±11.5 | 128.0±10.5 |
| Diastolic BP (mmHg) | 81.4±11.9 | 82.1±9.4 | 82.3±12.4 |
BP: blood pressure; Ch: cholesterol; TG: triglycerides; CRP: C reactive protein; HOMA-IR: homeostasis model assessment.
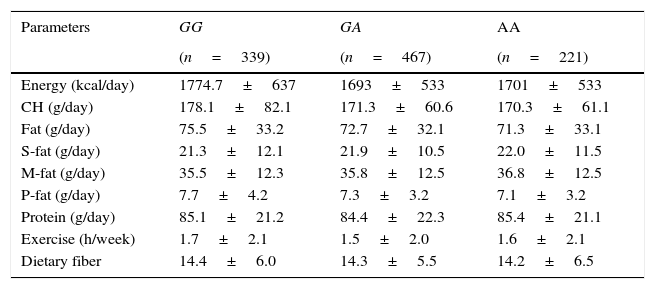
Table 3 shows nutritional intake with 3 days written food records. No statistical differences were detected in caloric, carbohydrate, fat, and protein intakes. Aerobic exercise per week was similar in all groups.
Dietary intake.
| Parameters | GG | GA | AA |
|---|---|---|---|
| (n=339) | (n=467) | (n=221) | |
| Energy (kcal/day) | 1774.7±637 | 1693±533 | 1701±533 |
| CH (g/day) | 178.1±82.1 | 171.3±60.6 | 170.3±61.1 |
| Fat (g/day) | 75.5±33.2 | 72.7±32.1 | 71.3±33.1 |
| S-fat (g/day) | 21.3±12.1 | 21.9±10.5 | 22.0±11.5 |
| M-fat (g/day) | 35.5±12.3 | 35.8±12.5 | 36.8±12.5 |
| P-fat (g/day) | 7.7±4.2 | 7.3±3.2 | 7.1±3.2 |
| Protein (g/day) | 85.1±21.2 | 84.4±22.3 | 85.4±21.1 |
| Exercise (h/week) | 1.7±2.1 | 1.5±2.0 | 1.6±2.1 |
| Dietary fiber | 14.4±6.0 | 14.3±5.5 | 14.2±6.5 |
CH: carbohydrate; S-fat: saturated fat; M-fat: monounsaturated fat; P-fat: polyunsaturated fat. No statistical differences between groups.
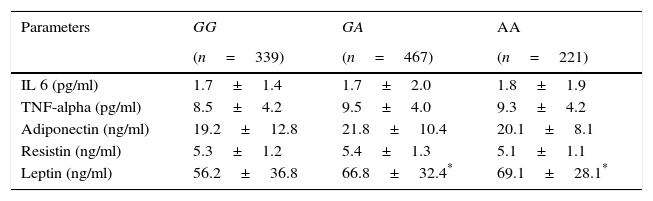
Table 4 shows levels of adipocytokines. Leptin was higher in A allele carriers than non A allele carriers. No differences in leptin levels were detected between GA and AA genotypes
Circulating adipocytokines.
| Parameters | GG | GA | AA |
|---|---|---|---|
| (n=339) | (n=467) | (n=221) | |
| IL 6 (pg/ml) | 1.7±1.4 | 1.7±2.0 | 1.8±1.9 |
| TNF-alpha (pg/ml) | 8.5±4.2 | 9.5±4.0 | 9.3±4.2 |
| Adiponectin (ng/ml) | 19.2±12.8 | 21.8±10.4 | 20.1±8.1 |
| Resistin (ng/ml) | 5.3±1.2 | 5.4±1.3 | 5.1±1.1 |
| Leptin (ng/ml) | 56.2±36.8 | 66.8±32.4* | 69.1±28.1* |
IL-6, interleukin 6.
The finding of this study is the association of the minor allele of SNP rs3123554 within the cannabinoid receptor subtype 2 (CNR2) gene with obesity parameters and higher levels of leptin, triglycerides, insulin and HOMA-IR.
The percentage of minor allele carriers over 50% was similar to other studies.7 The literature supports the notion that endocannabinoid system is positioned for regulation of endocannabinoid levels that could influence craving and reward behaviors through the relevant neuronal circuitry and metabolic parameters.18 CNR2 has long been referred to as the peripheral cannabinoid receptor isoform. Interestingly, there is now evidence of CNR2 expression in different areas of the brain,19 but the physiological role remains largely unclear. In our study, we found the significant association of the SNP with obesity and metabolic parameters in the cross sectional cohort. Recently, a potential role of cerebral CNR2 receptors in the modulation of body weight was found in the animal model. Central CNR2 over expression leads to a lean phenotype in mice.20 Moreover, CNR2 activation in humans also seems to influence eating behavior.21 Our finding of an association of a SNP rs3123554 within the CNR2 gene and altered insulin resistance and body weight gives evidence of a metabolic role of the CNR2 in humans.
Insulin action is an important regulator of energy homeostasis and body weight.22 Ketterer et al.7 have found that carriers of minor allele of this SNP showed lower cerebral insulin sensitivity. One could speculate that altered cerebral insulin sensitivity in carriers of the minor allele of rs3123554 may be responsible for higher weight than non carriers.
A second hypothesis could be the possibility that the body weight effect in this cross-sectional study is due to peripheral metabolic mechanisms, because CNR2 has been isolated in organs important for the control of metabolism like adipose tissue, liver and skeletal muscle.23 The study of Ketterer et al.7 showed an inverse relation of minor allele of this SNP with body weight. However, this relationship was described only in females and in a population of obese subjects for high risk with diabetes mellitus type 2 or diagnosis of impaired fasting glycemia. Our sample has males and females without diabetes/impaired glycemia, these two parameters could explain the differences between both studies.
The inconsistencies between these studies may reflect the complex interactions between multiple population-specific genetic and environmental factors. Perhaps, these different results could be explained by inclusion criteria for subjects in other studies (diabetic vs non diabetic patients). This previous study7 would require composition analysis of the diet to determine whether dietary components could be responsible for the metabolic profiles. In our study dietary intake did not show statistical differences between groups, in this way we have controlled for dietary intake.
In our patients, insulin, HOMA-IR, leptin and triglycerides levels were higher in obese patients carrying the minor allele. As far as we known, this is the first time in the literature that this association has been reported and we considered that it could be explained with the association of A allele with higher body weight.
Recently, the CNR2 rs35761398 polymorphism, which leads to the CNR2 Q63R variant, revealed a significantly earlier age of menarche in subjects carrying the Q63 allele, which was also found after adjusting for BMI z-score. Logistic regression analysis demonstrated that patients homozygous for the Q allele had a 2.2-fold higher risk of presenting with an early menarche (age at menarche <12 years).24 Finally, rs3003336, rs2501431, rs2502992, rs2501432 SNPs of CNR2 genes are related in the etiology of osteoporosis and suggest that it may be a genetic risk factor for bone density and osteoporosis in postmenopausal women.25
In conclusion, the novel finding of this study is the association of the minor allele of rs3123554 SNP within CNR2 gene with body weight and triglyceride, HOMA-IR, insulin and leptin levels. Further studies are needed to elucidate this complex relationship independently of body mass index and to explore potentially therapeutical implications such other SNPs in CNR1 pathway.26,27
Ethical approvalAll procedures performed in studies involving human participants were in accordance with the ethical standards of the institutional and/or national research committee and with the 1964 Helsinki declaration and its later amendments or comparable ethical standards.
Informed consentInformed consent was obtained from all individual participants included in the study.
FundingNone.
Conflict of interestThe authors declare that they have no conflicts of interest.