


Randomized clinical trials on the cardiovascular effects of hypoglycemic drugs on people with type 2 diabetes mellitus began more than fifty years ago. In the last decade, the emergence of new classes of hypoglycemic drugs has led to the development of randomized clinical trials to assess their cardiovascular safety. Known as Cardiovascular Outcome Trials, they have provided a lot of new information that needs to be critically appraised if the knowledge obtained is to be applicable in clinical practice. To this end, the current article first comments on the guidelines to which these trials have adhered, then reviews some concepts for improving their interpretation (such as different types of analyses, the definition of objectives and the evaluation of their results), and concludes by mentioning the new guidelines to which future trials designed to evaluate the safety of new hypoglycemic drugs should adhere.
Hace más de cincuenta años que empezaron los ensayos clínicos aleatorizados sobre los efectos cardiovasculares de los fármacos hipoglucemiantes en personas con lo que hoy se conoce como diabetes mellitus tipo 2. Este proceso se ha acelerado en la última década con la aparición de nuevas categorías de fármacos hipoglucemiantes, lo que ha llevado al desarrollo de ensayos clínicos aleatorizados para evaluar su seguridad cardiovascular. Los denominados Cardiovascular Outcome Trials han proporcionado una ingente cantidad de información que debería analizarse críticamente para poderla transformar en conocimiento aplicable a la práctica clínica. Para ello, tras comentar las guías a las que se han adherido esos ensayos, se comentan una serie de conceptos para interpretarlos mejor (desde los tipos de análisis hasta la definición de objetivos y la evaluación crítica de los resultados), y se finaliza con una mención a las nuevas guías a las que se adherirán los futuros ensayos que se diseñen para evaluar la seguridad de los nuevos fármacos hipoglucemiantes.
The first randomised clinical trial (RCT) on the cardiovascular effects of antidiabetic drugs in what today would be considered type 2 diabetes mellitus (T2DM) began in the 1960s. The results of that trial, the University Group Diabetes Program, suggested that insulin was safer than tolbutamide or phenformin, and sparked an intense debate for years.1 In the late 1970s, the United Kingdom Prospective Diabetes Study (UKPDS) started in that country. It recruited 4,209 people with T2DM of recent onset, and its first phase ended in 1997. From a cardiovascular perspective, the study concluded that, for an endpoint made up of 12 sundry components (sudden death, death due to hypoglycaemia or hyperglycaemia, fatal or non-fatal myocardial infarction [MI], angina, heart failure, cerebrovascular accident [CVA], kidney failure, amputation of at least one finger, vitreous haemorrhage, laser-treated retinopathy, amaurosis fugax in one eye or cataract removal), more intensive blood glucose control with a mean HbA1c of 7.0% was better than standard blood glucose control with a mean HbA1c of 7.8%, with a relative risk (RR) of 0.88 (95% CI: 0.78-0.99).2 In a context of an absolute lack of this type of study, we would like to point out the following limitations:
- 1
It had a long recruitment period (from 1977 to 1991) and the initial design was repeatedly changed.3
- 2
The diagnostic criteria for T2DM in that time required higher blood glucose levels than they do today.
- 3
HbA1c was not available in the first few years.
- 4
The composite endpoint mentioned included procedures (e.g. cataract removal); whether participants underwent these procedures depended on their corresponding sites.
- 5
The upper limit of the 95% CI for the result of this endpoint was 0.99 — that is, at the limit of statistical significance.
- 6
In the analysis, dozens of comparisons were made without adjusting the p value.2
- 7
The evaluation of the components of this endpoint did not take into account the time when the events appeared. It only considered whether or not they had appeared by the end of the study; hence, the results were given in terms of RR (see the following section).
- 8
From the results in the 342 people with overweight who received metformin, this drug was inferred to have beneficial cardiovascular effects;4 this has yet to be demonstrated.
At that time, benefits of intensive treatment for an endpoint consisting of fatal or non-fatal MI and sudden death were not detected (p = 0.052), but benefits 10 years later for MI were indeed reported, especially for those who received metformin (p = 0.005).5 To summarise, the UKPDS did not show intensification of treatment of hyperglycaemia to have cardiovascular benefits. Neither did three other multicentre RCTs6–8 conducted after the UKPDS, in the 2000s. In fact, one of them had to be cancelled prematurely due to an increase in total mortality [TM] in the intensive treatment group.6 This did not prevent it from being included with the other two and the UKPDS in a meta-analysis that concluded that intensive blood glucose control was associated with a hazard ratio (HR) of 0.91 (95% CI: 0.78-0.99) for an endpoint consisting of cardiovascular mortality [CVM], non-fatal MI and non-fatal CVA, later termed "3-point major adverse cardiovascular events" (3P-MACE).9 Here, again, the result was at the limit of statistical significance.
Questions on cardiovascular safety of thiazolidinedionesAfter the first thiazolidinediones were placed on the market, the PROspective pioglitAzone Clinical Trial In macroVascular Events (PROactive) RCT showed no benefits of pioglitazone versus placebo for its primary endpoint [PE] (MT, non-fatal [including silent] MI, non-fatal CVA, acute coronary syndrome, revascularisation and amputation), but did show benefits for a secondary endpoint which included only the first three components of the primary endpoint and excluded silent infarctions (HR: 0.84; 95% CI: 0.72-0.98).10 It was concluded that the PE had not been significant as it included procedures (e.g. revascularisation), which could have had different indications at the different participating sites. After muraglitazar did not manage to secure marketing approval due to its deleterious cardiovascular adverse effects,11 a meta-analysis with 42 RCTs at least 24 weeks long showed an odds ratio (OR) of 1.43 (95% CI: 1.03-1.98) for MI against rosiglitazone.12 Controversy ensued, rosiglitazone was taken off the market and, in 2008, the United States Food and Drug Administration (FDA) issued guidelines on how to evaluate the cardiovascular risk of newer oral antidiabetic drugs (NOADs) for the treatment of T2DM. These guidelines can be summarised as follows:13,14
- 1
The evaluation of cardiovascular risk should involve at least one PE including examination of the three components of the 3P-MACE (CVM, MI and CVA), although other events can also be included, such as hospitalisation for acute coronary syndrome, hospitalisation for heart failure (HfHF) and emergency revascularisation.
- 2
All those events had to be defined in advance and determined by an independent committee.
- 3
That evaluation requires the NOAD development programme to include phase-2 and phase-3 RCTs sufficient size in size and duration for meta-analysis thereof to duly reflect the recommendations in the guidelines. In place of this, a specific RCT called a cardiovascular outcome trial (CVOT) can be conducted to evaluate the cardiovascular risk of NOADs. In practice, all NOADs have had their own CVOTs.
- 4
Newer insulins are not subject to these recommendations.
- 5
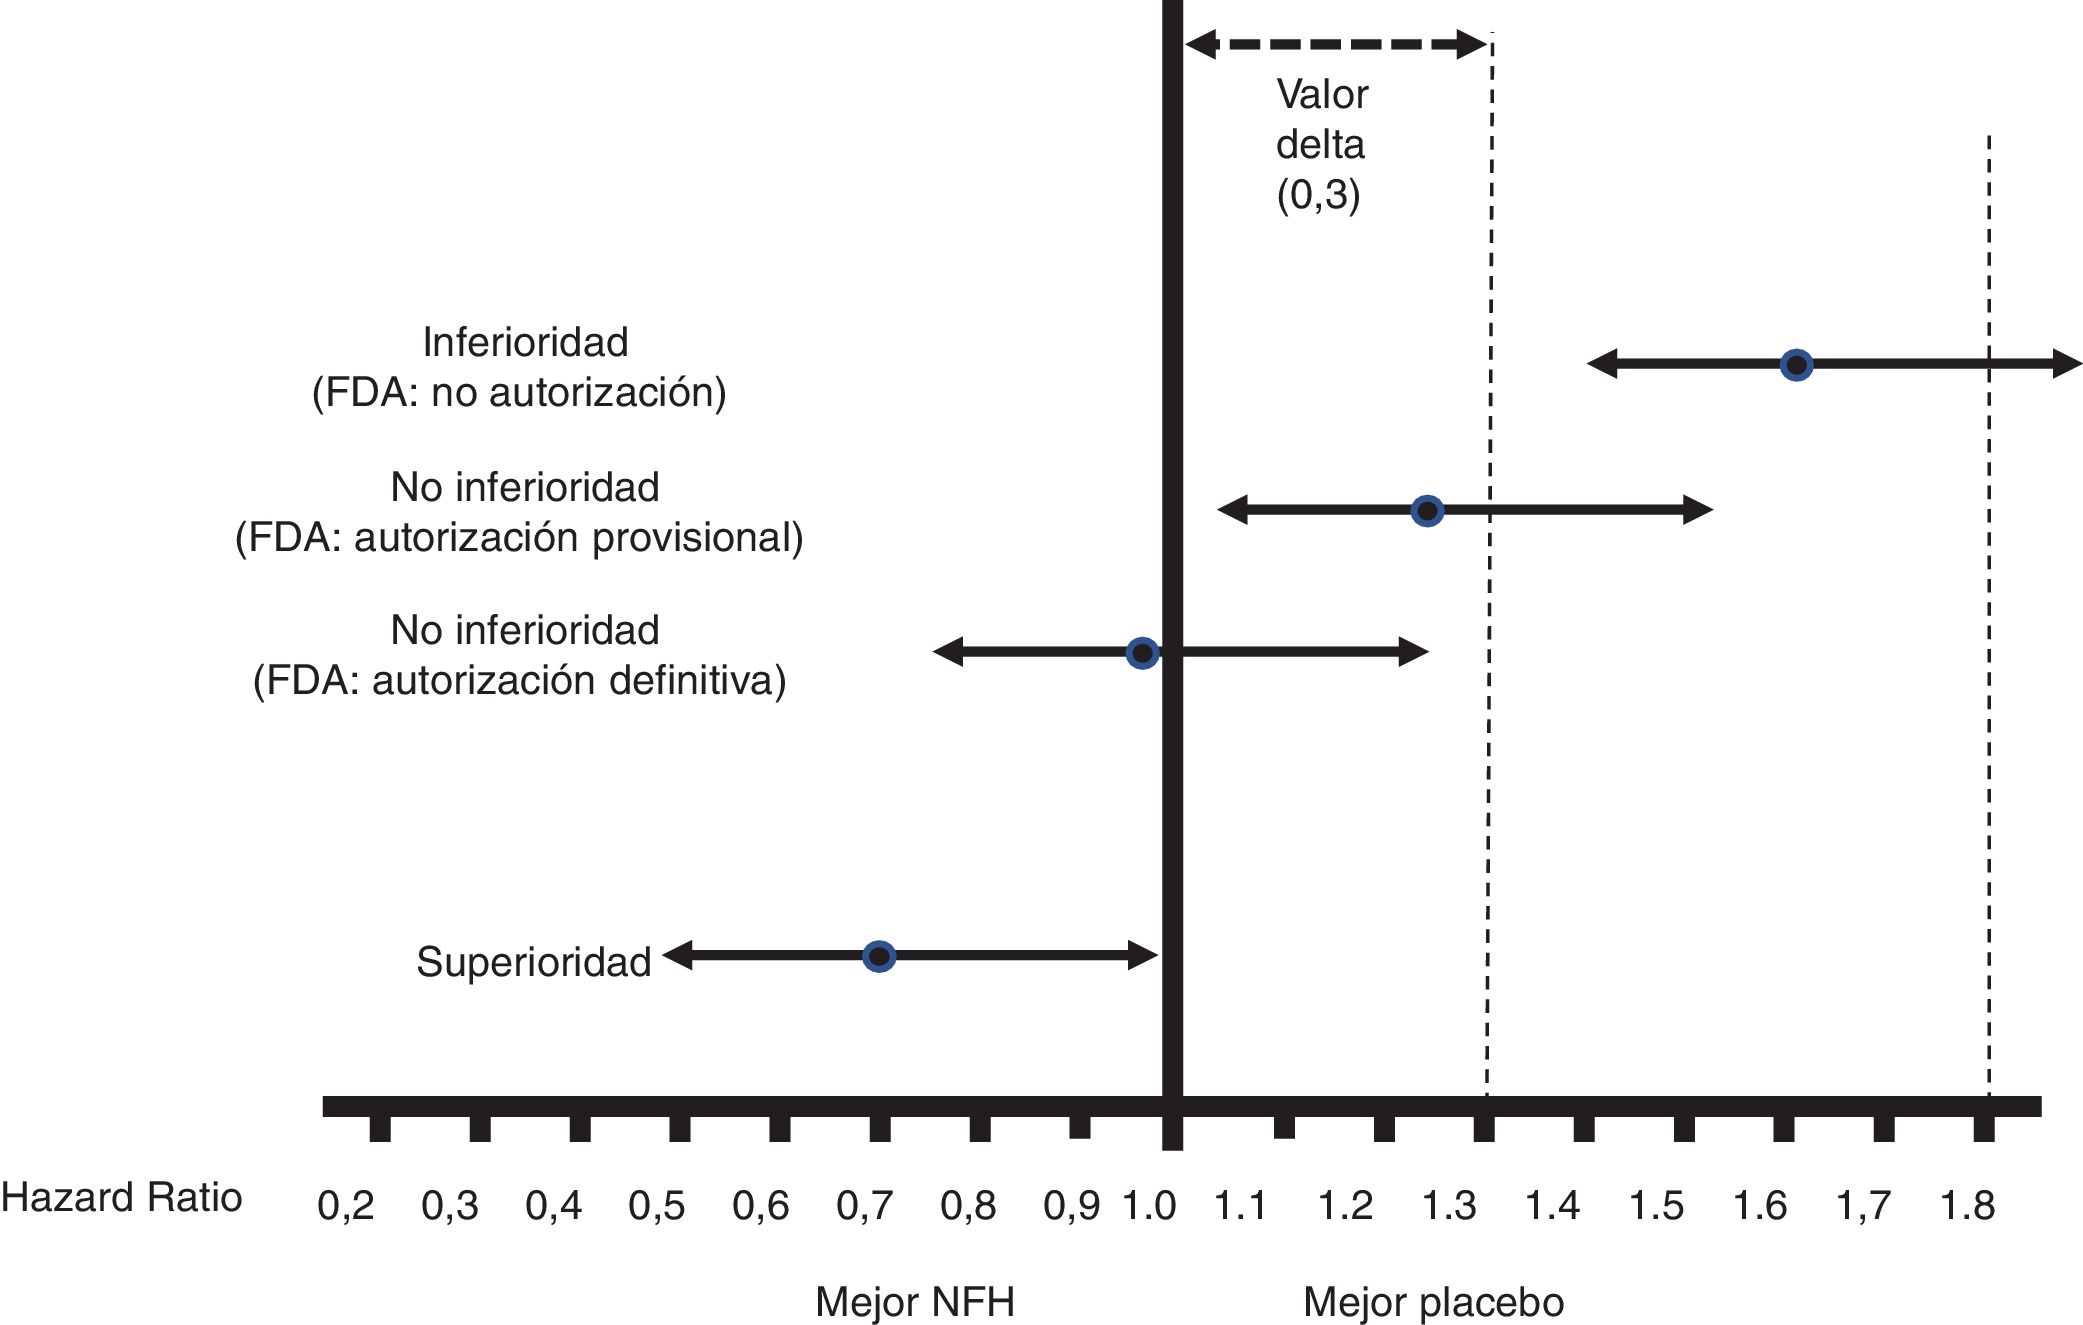
Fig. 1 shows the interpretation of the PE results of these CVOTs.
 Acceptance of a delta value <0.3 to accept a NOAD as safe (or non-inferior). 2) Attention to the upper limit of the 95% CI (bilateral p) for the difference between people who received the NOAD and people who did not, in relation to the PE (in general 3P-MACE): If it is ≥1.8, the NOAD will not be authorised due to its high cardiovascular risk; if it is <1.3, it will be assumed to be safe and authorised to be marketed; if it is ≥1.3 and <1.8, it will be provisionally authorised to be marketed (or not suspended), pending more results confirming that this upper limit of the difference is <1.3. The guidelines do not recommend that the NOAD show cardiovascular benefits, or in other words that this upper limit of the difference be <1.0 (superiority); they only recommend demonstrating non-inferiority (cut-off point <1.3).") Figure 1.
Figure 1.Interpretation of the results for the PE of the CVOTs according to the 2008 FDA guidelines.13 This interpretation is based on: 1) Acceptance of a delta value <0.3 to accept a NOAD as safe (or non-inferior). 2) Attention to the upper limit of the 95% CI (bilateral p) for the difference between people who received the NOAD and people who did not, in relation to the PE (in general 3P-MACE): If it is ≥1.8, the NOAD will not be authorised due to its high cardiovascular risk; if it is <1.3, it will be assumed to be safe and authorised to be marketed; if it is ≥1.3 and <1.8, it will be provisionally authorised to be marketed (or not suspended), pending more results confirming that this upper limit of the difference is <1.3. The guidelines do not recommend that the NOAD show cardiovascular benefits, or in other words that this upper limit of the difference be <1.0 (superiority); they only recommend demonstrating non-inferiority (cut-off point <1.3).
(0.1MB).
 Acceptance of a delta value <0.3 to accept a NOAD as safe (or non-inferior). 2) Attention to the upper limit of the 95% CI (bilateral p) for the difference between people who received the NOAD and people who did not, in relation to the PE (in general 3P-MACE): If it is ≥1.8, the NOAD will not be authorised due to its high cardiovascular risk; if it is <1.3, it will be assumed to be safe and authorised to be marketed; if it is ≥1.3 and <1.8, it will be provisionally authorised to be marketed (or not suspended), pending more results confirming that this upper limit of the difference is <1.3. The guidelines do not recommend that the NOAD show cardiovascular benefits, or in other words that this upper limit of the difference be <1.0 (superiority); they only recommend demonstrating non-inferiority (cut-off point <1.3).")
All CVOTs conducted since these guidelines were issued have met the criterion of a non-inferiority margin of <1.3. In some cases, as with empagliflozin, canagliflozin and semaglutide (subcutaneous or oral), the RCT was designed to exceed a cut-off point of 1.8, and the follow-up period (empagliflozin)15 or the sample size (canagliflozin)16 was later extended to exceed the cut-off point of <1.3, or no additional steps were taken as the cut-off point of <1.0 had already been exceeded with the initial design (semaglutide).17
Interpretation of CVOTsUp to 5 August 2020, 15 CVOTs were published. The comparator used was a placebo in 14 cases and another NOAD in one case. The latter will not be analysed;18 those conducted after an acute coronary event19,20 and those with NOADs not yet placed on the market in Spain were also not included.21Tables 1 and 2 show the 11 remaining CVOTs that will be analysed: three with sodium/glucose cotransporter 2 (SGLT2) inhibitors,15,16,22, five with glucagon-like peptide 1 receptor analogues (GLP1RAs)17,23–26 and three with dipeptidyl peptidase-4 (IDDP4) inhibitors.27–29 In them, the following points will be considered:
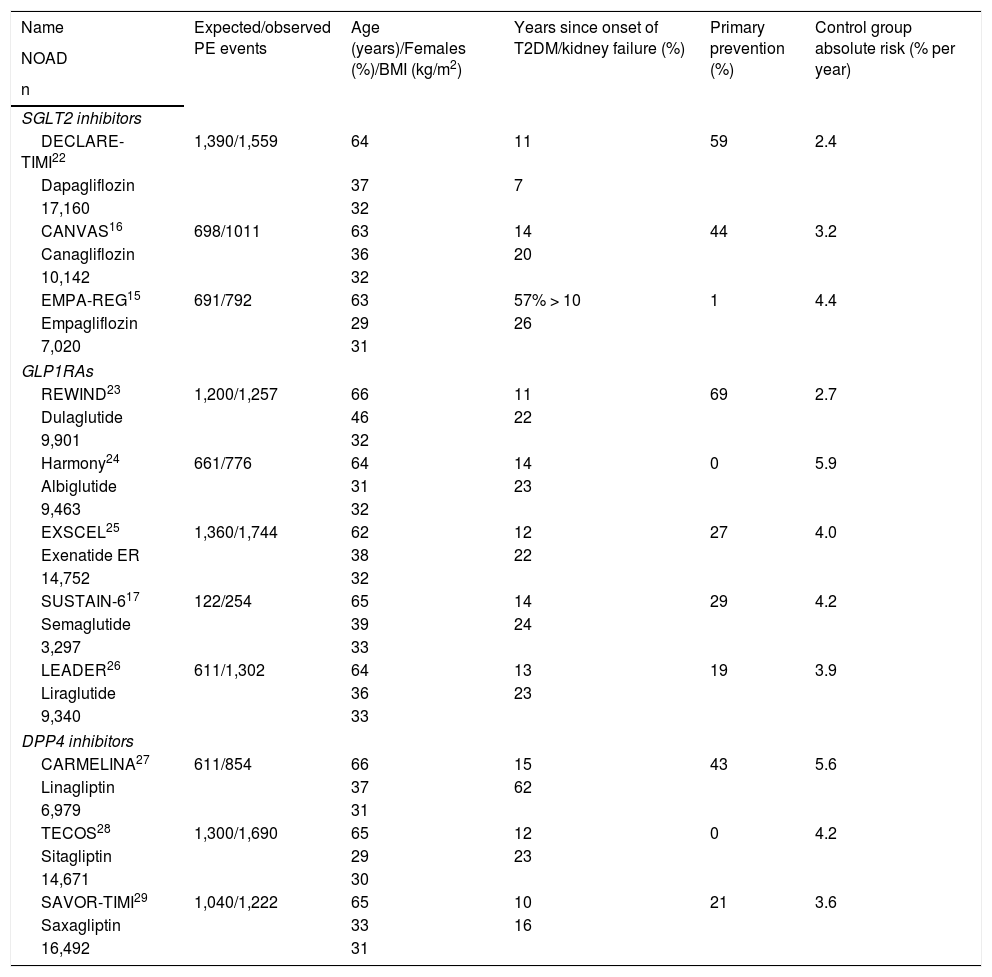
Characteristics of the CVOTs analysed.
| Name | Expected/observed PE events | Age (years)/Females (%)/BMI (kg/m2) | Years since onset of T2DM/kidney failure (%) | Primary prevention (%) | Control group absolute risk (% per year) |
|---|---|---|---|---|---|
| NOAD | |||||
| n | |||||
| SGLT2 inhibitors | |||||
| DECLARE-TIMI22 | 1,390/1,559 | 64 | 11 | 59 | 2.4 |
| Dapagliflozin | 37 | 7 | |||
| 17,160 | 32 | ||||
| CANVAS16 | 698/1011 | 63 | 14 | 44 | 3.2 |
| Canagliflozin | 36 | 20 | |||
| 10,142 | 32 | ||||
| EMPA-REG15 | 691/792 | 63 | 57% > 10 | 1 | 4.4 |
| Empagliflozin | 29 | 26 | |||
| 7,020 | 31 | ||||
| GLP1RAs | |||||
| REWIND23 | 1,200/1,257 | 66 | 11 | 69 | 2.7 |
| Dulaglutide | 46 | 22 | |||
| 9,901 | 32 | ||||
| Harmony24 | 661/776 | 64 | 14 | 0 | 5.9 |
| Albiglutide | 31 | 23 | |||
| 9,463 | 32 | ||||
| EXSCEL25 | 1,360/1,744 | 62 | 12 | 27 | 4.0 |
| Exenatide ER | 38 | 22 | |||
| 14,752 | 32 | ||||
| SUSTAIN-617 | 122/254 | 65 | 14 | 29 | 4.2 |
| Semaglutide | 39 | 24 | |||
| 3,297 | 33 | ||||
| LEADER26 | 611/1,302 | 64 | 13 | 19 | 3.9 |
| Liraglutide | 36 | 23 | |||
| 9,340 | 33 | ||||
| DPP4 inhibitors | |||||
| CARMELINA27 | 611/854 | 66 | 15 | 43 | 5.6 |
| Linagliptin | 37 | 62 | |||
| 6,979 | 31 | ||||
| TECOS28 | 1,300/1,690 | 65 | 12 | 0 | 4.2 |
| Sitagliptin | 29 | 23 | |||
| 14,671 | 30 | ||||
| SAVOR-TIMI29 | 1,040/1,222 | 65 | 10 | 21 | 3.6 |
| Saxagliptin | 33 | 16 | |||
| 16,492 | 31 | ||||
CARMELINA: Cardiovascular and Renal Microvascular Outcome Study with LINAgliptin; DPP4 inhibitors: dipeptidyl-peptidase 4 inhibitors; GLP1RAs: glucagon-like peptide 1 receptor analogues; NOAD: newer oral antidiabetic drug; PE: primary endpoint; SGLT2 inhibitors: sodium/glucose cotransporter 2 inhibitors; T2DM: type 2 diabetes mellitus.
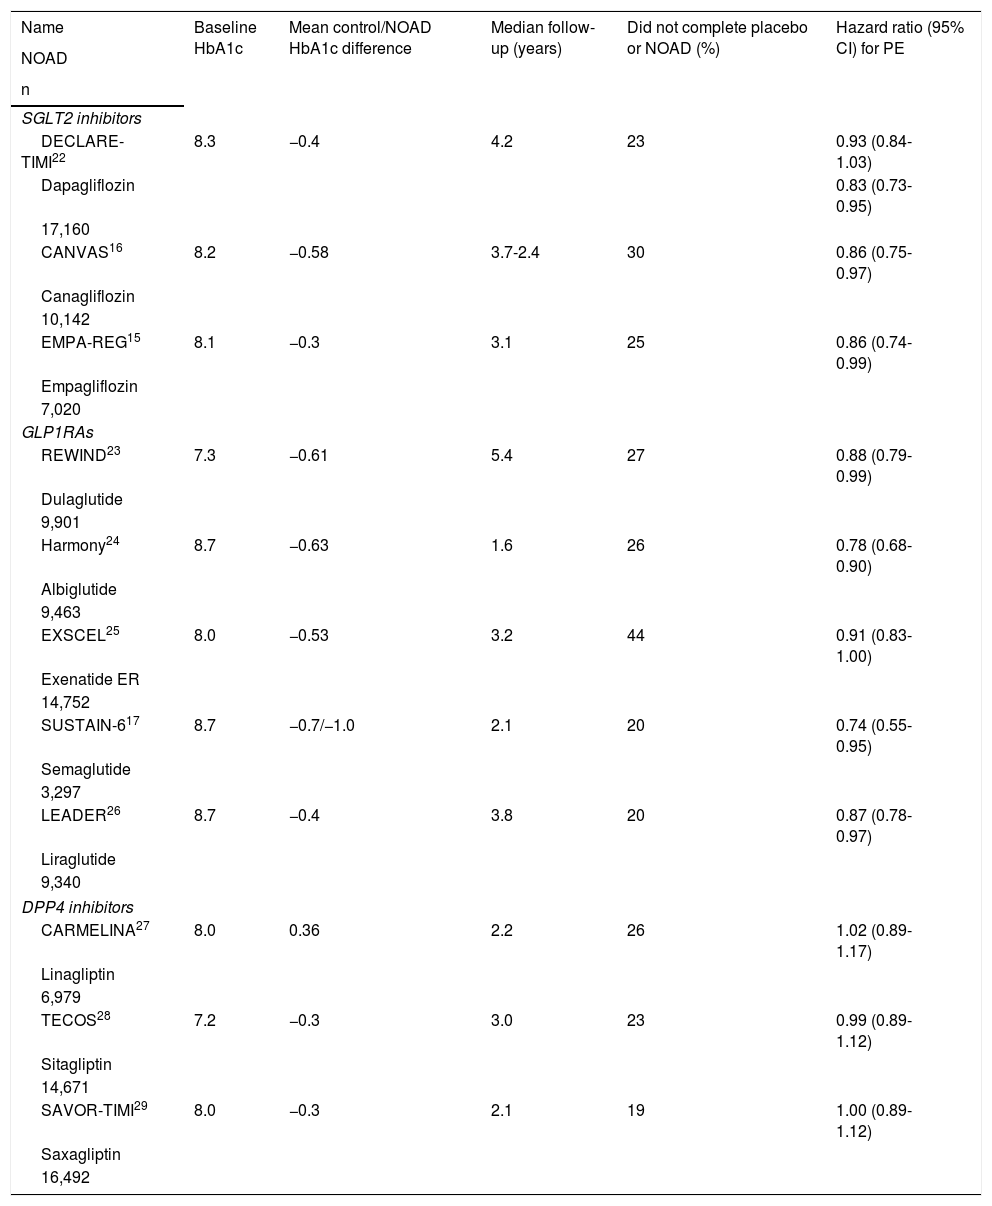
Characteristics of the CVOTs analysed.
| Name | Baseline HbA1c | Mean control/NOAD HbA1c difference | Median follow-up (years) | Did not complete placebo or NOAD (%) | Hazard ratio (95% CI) for PE |
|---|---|---|---|---|---|
| NOAD | |||||
| n | |||||
| SGLT2 inhibitors | |||||
| DECLARE-TIMI22 | 8.3 | −0.4 | 4.2 | 23 | 0.93 (0.84-1.03) |
| Dapagliflozin | 0.83 (0.73-0.95) | ||||
| 17,160 | |||||
| CANVAS16 | 8.2 | −0.58 | 3.7-2.4 | 30 | 0.86 (0.75-0.97) |
| Canagliflozin | |||||
| 10,142 | |||||
| EMPA-REG15 | 8.1 | −0.3 | 3.1 | 25 | 0.86 (0.74-0.99) |
| Empagliflozin | |||||
| 7,020 | |||||
| GLP1RAs | |||||
| REWIND23 | 7.3 | −0.61 | 5.4 | 27 | 0.88 (0.79-0.99) |
| Dulaglutide | |||||
| 9,901 | |||||
| Harmony24 | 8.7 | −0.63 | 1.6 | 26 | 0.78 (0.68-0.90) |
| Albiglutide | |||||
| 9,463 | |||||
| EXSCEL25 | 8.0 | −0.53 | 3.2 | 44 | 0.91 (0.83-1.00) |
| Exenatide ER | |||||
| 14,752 | |||||
| SUSTAIN-617 | 8.7 | −0.7/−1.0 | 2.1 | 20 | 0.74 (0.55-0.95) |
| Semaglutide | |||||
| 3,297 | |||||
| LEADER26 | 8.7 | −0.4 | 3.8 | 20 | 0.87 (0.78-0.97) |
| Liraglutide | |||||
| 9,340 | |||||
| DPP4 inhibitors | |||||
| CARMELINA27 | 8.0 | 0.36 | 2.2 | 26 | 1.02 (0.89-1.17) |
| Linagliptin | |||||
| 6,979 | |||||
| TECOS28 | 7.2 | −0.3 | 3.0 | 23 | 0.99 (0.89-1.12) |
| Sitagliptin | |||||
| 14,671 | |||||
| SAVOR-TIMI29 | 8.0 | −0.3 | 2.1 | 19 | 1.00 (0.89-1.12) |
| Saxagliptin | |||||
| 16,492 | |||||
CARMELINA: Cardiovascular and Renal Microvascular Outcome Study with LINAgliptin; DPP4 inhibitors: dipeptidyl-peptidase 4 inhibitors; GLP1RAs: glucagon-like peptide 1 receptor analogues; NOAD: newer oral antidiabetic drug; PE: primary endpoint; SGLT2 inhibitors: sodium/glucose cotransporter 2 inhibitors.
When the CVOT is designed, or at least before any results are obtained, its statistical analysis plan, in which p (statistical significance) values proportionate to the degree of uncertainty at that time are assumed, should be made known. This happened in each CVOT for its PE. When the results are known, they can undergo post hoc analyses, but such analyses will always be exploratory and hypothesis-generating, as they are based on the observed behaviour of the results reported.
2. Non-inferiority versus superiority30,31All CVOTs are non-inferiority RCTs that adhere to the 2008 FDA guidelines, except for the Researching cardiovascular Events with a Weekly Incretin in Diabetes (REWIND) trial, which was initially proposed as a superiority trial.23 Unlike superiority RCTs, non-inferiority RCTs establish a delta value corresponding to the maximum acceptable difference between the NOAD and its comparator in the PE (almost always 3P-MACE) to consider whether the NOAD is non-inferior. The FDA guidelines fixed that delta value at <0.3, and therefore the cut-off point to deem a NOAD safe was <1.3 (Fig. 1). Non-inferiority does not mean equivalence, but it does mean interchangeability. In addition, it cannot be established with an RCT to demonstrate the superiority of a NOAD to its comparator, when such superiority is not demonstrated, or with multiple small-scale RCTs (e.g. n <800) showing no differences between a NOAD and its comparator in a meta-analysis. Non-inferiority RCTs require a larger sample size than superiority RCTs (see point 4); hence, within a single CVOT, it is permissible to first evaluate non-inferiority and, if confirmed, later evaluate superiority, provided that all this is specified in advance; this was common in the CVOTs analysed. If superiority is not demonstrated in a superiority RCT, possible non-inferiority cannot be evaluated afterwards, as this would require a larger sample size.
3. Per-protocol or as-treated analysis or intention-to-treat analysis32Per-protocol analysis only evaluates participants who complied with the entirety of the treatment assigned, whether a NOAD or a comparator. This number is always lower than that corresponding to the intention-to-treat population, since the latter includes all participants randomised to receive a NOAD or a comparator, regardless of whether they have fully complied with it. The intention-to-treat analysis would dilute the potential effect of the NOAD and thus favour non-inferiority. According to Pocock et al.32, both types of analysis should be performed in CVOTs to confirm that they are congruent.
4. Sample sizeWhen evaluating a NOAD versus a comparator, two types of error are defined: a) Type I error (alpha): the NOAD is thought to increase cardiovascular risk, but it actually does not (false positive). The alpha value in CVOTs is 0.05 (bilateral). b) Type II error (beta): the NOAD is thought not to increase cardiovascular risk, but it actually does (false negative). The power is (1 − beta) × 100, and is usually 90% in CVOTs.
Five factors increase sample size in non-inferiority RCTs:33 a) A lower rate of PE events in the control group. b) A lower rate of events in the PE with the NOAD (a lesser effect of the NOAD on the PE). c) A lower alpha risk. d) A lower delta value; the FDA recommended a delta value of <0.3 (which meant recognising NOADs that could increase the risk of the PE by up to <30% as safe) for pragmatic reasons, because for example for delta values of <0.1, CVOTs with more than 50,000 participants would be needed. e) A higher statistical power; this depends on the number of expected events in the PE, which for a HR of 1.3 is usually >700. CVOTs are designed to stop when a prespecified number of those events is reached (they are said to be event-driven trials). All the CVOTs analysed exceeded that number (Table 1).
5. Inclusion/exclusion criteriaThe inclusion/exclusion criteria determine the external validity of the CVOT (extrapolation of its results to all people with T2DM). In addition to the demographic characteristics of the participants, one very important criterion is the percentage of participants who have not yet experienced cardiovascular events (primary prevention), since they have a lower absolute risk (AR) of experiencing them than the participants who have already had them (secondary prevention) (Table 1). When comparing CVOTs, it must be taken into consideration that their criteria for selecting participants in primary prevention are usually not identical. For example, in the CANagliflozin cardiovascular Assessment Study (CANVAS),16 the group in primary prevention had a higher AR of 3P-MACE due to its members' clinical characteristics than the group in primary prevention from the Dapagliflozin Effect on CardiovascuLAR Events-Thrombolysis In Myocardial Infarction 58 (DECLARE-TIMI) trial.22 The REWIND trial criteria23 are also not comparable to the criteria of the Trial to Evaluate Cardiovascular and Other Long-term Outcomes with Semaglutide in Subjects with Type 2 Diabetes (SUSTAIN-6)17or the Liraglutide Effect and Action in Diabetes: Evaluation of Cardiovascular Outcome Results (LEADER) trial.26 Furthermore, initial cardiovascular events may be asymptomatic. Thus it seems most reasonable to compare CVOTs according to the AR of the PE in the control group.34 The DECLARE-TIMI trial22 was the CVOT with the lowest AR (2.4% per year or 2.4 per 100 patient-years), and the Harmony Outcome (Harmony) trial was the one with the highest (5.9% per year) (Table 1).24
When the groups are compared it is interesting to observe the changes over time in the cumulative percentage of participants with any PE event with Kaplan–Meier curves. In the Empagliflozin Cardiovascular Outcome Event Trial in Type 2 Diabetes Mellitus Patients (EMPA-REG), the curves started to diverge within a matter of months in favour of NOADs,15 whereas they diverged after almost two years in the LEADER trial.26 Consequently, it was suggested that the NOAD in the first study might have beneficial effects through a more haemodynamic mechanism, while the NOAD in the second study might have beneficial effects through a more antiarteriosclerotic mechanism.
6. Run-in periodThis is a period prior to randomisation intended to ensure that the participants to be randomised adhere well to the trial treatments, though at the expense of reducing the trial’s external validity. The best way to assess it is by examining the participant flow chart that appears in these publications. It is a good idea to then evaluate both the percentage of potential participants who did not get past the run-in phase and the reason why, although sometimes this is not specified in large numbers of cases.23
7. Interventions, randomisation and blindingIn all CVOTs, the intervention consisted of randomly adding the NOAD or its placebo to participants' regular treatment for T2DM, thus minimising between-group differences in blood glucose control — in other words, pursuing glycaemic equipoise. This is because the goal is to evaluate the cardiovascular safety of the NOAD independently of its antidiabetic effects. To achieve this equilibrium, other antidiabetic drugs tend to be used, the use of which is usually not authorised until several weeks/months after randomisation. This means that the mean HbA1c level is always somewhat lower in participants with the NOAD (Table 2). Some CVOTs have used two different NOAD doses but have specified in advance that those doses would be considered jointly to evaluate the PE.15–17 The CVOT with the greatest between-group difference in HbA1c was the SUSTAIN-6,17 consistent with its NOADs having the greatest effects on HbA1c compared to all the other antidiabetic drugs with which it has been compared to date.35–37
All the CVOTs had another three characteristics:33 a) The investigator did not know in advance which treatment would be assigned to the participant if included (allocation concealment). b) Both the investigator and the participant, at a minimum, did not know whether the product that the participant received was a NOAD or a placebo (double blinding). c) NOADs and placebos were randomly assigned, thus ensuring that the participants in the different treatment groups were comparable in terms of cardiovascular risk factors, whether known or unknown.
8. Follow-up and exposureCVOTs are long-term studies in which it is essential to evaluate exposure to the NOAD — i.e. to determine how many participants received it and for how long (Table 2). The CVOT with the most participants was the DECLARE-TIMI trial.22 The one with the fewest was the SUSTAIN-6.17 The one with the longest mean follow-up period was the REWIND trial,23 and the one with the shortest was the Harmony trial.24 The one with the lowest rate of treatment dropout was the Saxagliptin Assessment of Vascular Outcomes Recorded in patients with diabetes mellitus-Thrombolysis in Myocardial Infarction (TIMI) 53 (SAVOR-TIMI) trial,29 and the one with the highest was the Exenatide Study of Cardiovascular Event Lowering (EXSCEL).25 The best way to report exposure is in participant-years, although this is often not reported or difficult to find in publications. Low exposure to the NOAD should be taken into consideration in assessing the effects on the PE. The percentage of randomised patients with information on their vital status should also be evaluated at the end of the trial, although it was very high in all the CVOTs.
9. Primary endpointAll the CVOTs had as a PE time to onset of one of the events comprising that PE, usually 3P-MACE, except in the Trial Evaluating Cardiovascular Outcomes with Sitagliptin (TECOS), which added hospitalisation for unstable angina to the 3P-MACE in its PE,28 and the DECLARE-TIMI trial, which ultimately evaluated a co-primary endpoint of 3P-MACE and a composite endpoint of CVM or HfHF.22 For each participant: a) Both whether and when the event appears are evaluated. b) Only the first PE component to appear, if any, is considered. For example, if a participant first has an MI and then has a CVA or CVM, he or she will only be considered to have had an MI. Between-group comparison is always done with Cox regression (or proportional risk) models, which provide results in terms of HR. Although HR is similar to RR, they are not exactly the same, as the time when the event occurs is used to calculate HR, whereas RR is calculated at a particular point in follow-up (e.g. at two years) considering the ratio of the proportion of events between the two groups at that time but not considering when the events occurred.38 In evaluating HR it is also necessary to consider the upper limit of its 95% CI, as it is a measure of its statistical significance (i.e. its p value). This limit was 0.99 in two of the CVOTs, indicating a result at the limit of statistical significance (Table 2).15,23
Another less common way of reporting the beneficial cardiovascular effects of a NOAD is to provide the number of participants who must be treated in order to prevent a PE event (number needed to treat). This is of great clinical interest. It cannot be easily calculated as the inverse of the reduction in the AR that the NOAD achieves,39 and it should be provided by the authors. In addition, it should only be calculated for the PE of the CVOT. It should not be calculated for the secondary endpoints. It should also not be calculated for the results of subgroup analyses, as was recently done in one of the CVOTs analysed.23
All the CVOTs have composite PEs. This enables detection of a larger number of events in a shorter period of time, thus increasing the study's power. It also allows the effects of the NOAD to be better captured, although the milder components (such as hospitalisation for unstable angina in the TECOS)28 tend to appear earlier, thus diluting the effects of the NOAD and favouring non-inferiority.32 In any case, the results for each of the components of the PE should be shown to see whether they all have the same meaning. The only CVOT in which that did not happen was the EMPA-REG, which with its NOADs found a non-significant increase in non-fatal CVA with a non-significant drop in non-fatal MI and a significant drop in CVM, thus rendering its results less sound.15
10. Sensitivity analyses and subgroup analysesTo increase the robustness of the results for the PE, it is advisable to perform sensitivity analyses that confirm it.40 This means performing analyses considering only the per-protocol or intention-to-treat population, or evaluating the data based on the participants lost. If these analyses yield the same results as the initial analysis, they would confirm that initial analysis. In the EMPA-REG, the per-protocol results were not significant, but the intention-to-treat results were significant.15
It is also a good idea to perform subgroup analyses.32 These analyses explore the possible heterogeneity of the effects of the NOAD on the PE in different participant subgroups defined by their baseline characteristics, such as age group, sex, geographic origin or lack of prior cardiovascular events (primary prevention). They are performed by calculating a p for interaction: if significant, it would indicate that the participants would behave differently depending on the subgroup-defining characteristic. This happened, for example, in the EMPA-REG when the PE was analysed based on the geographic origin of the participants.15 This type of analysis is exploratory only and raises the problem of multiple comparisons. When 10 analyses of this type are performed in a single study considering a p for interaction <0.05 to be significant, the risk of obtaining at least one false positive is >40%.41 The management of this problem is described in point 12. As it is exploratory, if, for example, the subgroup of patients in primary prevention is confirmed to exhibit behaviour equal to the subgroup of patients in secondary prevention, this does not mean that it can be affirmed that the beneficial effects on the PE detected when the two subgroups are analysed at the same time can be extrapolated to the subgroup in primary prevention (in which it is always more difficult to demonstrate any cardiovascular benefits). This occurred in the REWIND trial, the CVOT with the highest percentage of participants in primary prevention out of all those conducted, which noted that its NOADs significantly improved the PE in the subgroup in primary prevention.23 A subsequent meta-analysis analysed the cardiovascular effects of all the CVOTs with GLP1RAs according to whether the participants were in primary prevention (the majority were from the REWIND trial) or secondary prevention, and concluded that there were no benefits in primary prevention and that there were benefits in secondary prevention.42
11. Adaptive designsAdaptive designs can improve the efficiency of RCTs, with potential benefits for participants, as they reduce costs and increase the chances of finding any potential benefits. There are various types, but they must always be specified in advance or, if the RCT is already in progress, used without knowing the trial's results.43 This type of design was used in the EMPA-REG, when silent infarctions were removed from the PE before the results were published. Silent infarctions were more common the NOAD groups than in the placebo group (7.0 versus 5.4 per 1,000 participants per year), but it cannot be known whether not having made that change would or would not have modified the end result of the study, which was at the limit of statistical significance, as the amount of time they took to appear was not reported.15 The DECLARE-TIMI trial represents another example; it was initially proposed with the PE of non-inferiority for 3P-MACE.22 During the trial, in view of the results of the EMPA-REG in terms of HfHF, without knowing its results, a composite endpoint of CVM or HfHF was added as a co-primary endpoint to the initial 3P-MACE. To adjust the alpha error, its initial value of 0.05 was halved, such that, at the end of the trial, both co-primary endpoints were going to need a p value <0.0231 to be considered significant, and both were going to have to be significant to hierarchically analyse the effects on a number of secondary endpoints specified in advance at the start of the trial (with p < 0.05).44 In this trial, 3P-MACE was not significant (p = 0.17), but the other co-primary endpoint of CVM or HfHF was significant (p = 0.005).
12. Secondary and exploratory endpointsAll the CVOTs included secondary endpoints. All are exploratory and hypothesis-generating, although if analyses thereof yielded a very low p value (e.g. < 0.001), they would have to be considered potentially significant. Both in the EMPA-REG15 and in the CANVAS,16 HfHF was a secondary endpoint in which substantial benefits of the respective NOAD were seen, leading to specific trials for the treatment of heart failure.45
It is recommended that all of the components of the PE be included as secondary endpoints. For agencies like the FDA to consider their results sufficient to amend the package insert/summary of product characteristics (as occurred for example with CVM and the EMPA-REG), two strategies can be employed:32 a) Prespecify a hierarchy for evaluation of secondary endpoints without modifying the initial p value, but such that, to move from one endpoint to the next, the first of them must be significant; this is the strategy most commonly used in CVOTs. b) Do not prepare this hierarchy but do adjust the p value downwards based on the number of secondary endpoints (multiple comparisons) that are specified in advance. For example, if the initial p value is <0.05 and there are five secondary endpoints, for any of them to be accepted as significant, its p value should be <0.01. This strategy would probably be the most neutral one.44
13. Evaluation of adverse eventsCVOTs can confirm known adverse effects of the NOADs evaluated, such as genital infections with SGLT2 inhibitors and gastrointestinal intolerance with GLP1RAs. In addition, as they include thousands of participants, they can also aid in detecting potential new adverse effects, which may or may not be confirmed later on, such as the development of retinopathy17 or an increase in amputations.16 Their onset must also be analysed in the placebo group, since if for example an increase in episodes of hypoglycaemia is seen in the NOAD group, such analysis could help to partly explain the results.26
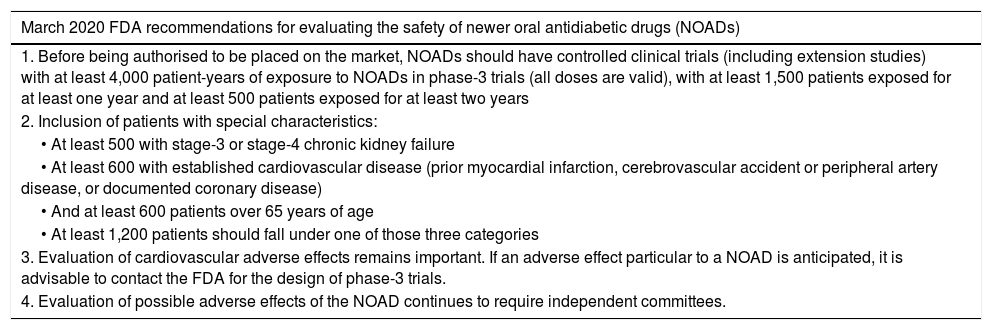
The new FDA proposalAfter a meeting of an expert committee in October 2018, which determined that none of the CVOTs conducted with the 2008 guidelines detected an increase in cardiovascular risk with NOADs, as well as the need to evaluate people with T2DM with a higher risk of adverse effects and other types of adverse effects (not just cardiovascular ones), in March 2020, the FDA issued new recommendations on how to evaluate the safety of NOADs; they are summarised in Table 3.46 These new recommendations replace the 2008 ones. They do not propose cut-off points for establishing the safety of the NOAD and they indicate that the safety assessment should be adaptive. These recommendations establish as a fulcrum a minimum exposure of participants to the NOAD of 4,000 patient-years, which in general would be lower than that recorded in the above-mentioned CVOTs; however, they call for the participation of minimum numbers of people with kidney failure, cardiovascular disease and age over 65 years. With those recommendations, new clinical trials could accurately evaluate fewer cardiovascular events to obtain authorisation of their respective NOADs.47 Surprisingly, the HR cut-off points for the PE have been abandoned, and the conduct of pragmatic trials (trials that preserve randomisation but are embedded in routine clinical practice) have not been recommended as a strategy for including participants as similar as possible to potential candidates for receiving the NOAD.48
March 2020 FDA proposal for studying the safety of NOADs, replacing the 2008 guidelines for studying the cardiovascular safety of NOADs.46.
| March 2020 FDA recommendations for evaluating the safety of newer oral antidiabetic drugs (NOADs) |
|---|
| 1. Before being authorised to be placed on the market, NOADs should have controlled clinical trials (including extension studies) with at least 4,000 patient-years of exposure to NOADs in phase-3 trials (all doses are valid), with at least 1,500 patients exposed for at least one year and at least 500 patients exposed for at least two years |
| 2. Inclusion of patients with special characteristics: |
| • At least 500 with stage-3 or stage-4 chronic kidney failure |
| • At least 600 with established cardiovascular disease (prior myocardial infarction, cerebrovascular accident or peripheral artery disease, or documented coronary disease) |
| • And at least 600 patients over 65 years of age |
| • At least 1,200 patients should fall under one of those three categories |
| 3. Evaluation of cardiovascular adverse effects remains important. If an adverse effect particular to a NOAD is anticipated, it is advisable to contact the FDA for the design of phase-3 trials. |
| 4. Evaluation of possible adverse effects of the NOAD continues to require independent committees. |
In summary, to better assess the potential impact on clinical practice of CVOTs, it must be considered that:
- 1
All analyses must be specified in advance; post hoc analyses are always exploratory.
- 2
A larger sample size is needed to demonstrate non-inferiority than to demonstrate superiority.
- 3
It is more important to know the rate of events in the control (placebo) group than the percentage of participants in primary prevention, and it is also important to assess NOAD exposure.
- 4
Run-in periods detract from the external validity of the study results.
- 5
CVOTs always attempt to minimise between-group differences in HbA1c, and are not suitable for measuring the efficacy of NOADs in relation to blood glucose.
- 6
All end when a prespecified number of events is reached.
- 7
The PE always has multiple components, and in each participant only the first component to occur and the timing of its occurrence are taken into account. In assessing the HR of the PE, if the upper limit of its 95% CI is close to 1.0 (e.g. 0.99), this indicates that the result was at the limit of statistical significance. Clinically, it is very interesting to know the number of participants who should be treated to prevent a component of the PE.
- 8
Sensitivity analyses can lend robustness to the results obtained for the PE; subgroup analyses in relation to the PE and analyses of secondary endpoints are exploratory and hypothesis-generating.
- 9
It is important to confirm whether changes occurred in the PE over the course of the trial. These considerations may aid in more objective evaluation of CVOTs, a task that remains dependent on human critical thinking and cannot be assumed by artificial intelligence.49
This study was funded by PI15/00567 (PI: JMCG) from the Fondo de Investigación Sanitaria [Healthcare Research Fund] (FIS), in turn co-funded by the Instituto de Salud Carlos III [Carlos III Health Institute]/General Evaluation Branch (Spanish Ministry of Economics and Competitiveness) and the European Regional Development Fund (ERDF).
Conflicts of interestAR: none. GL has received funding for lectures and attendance at medical conferences/courses since 2018 from Abbott, Janssen and Sanofi. JMGC has received funding for lectures as well as attendance at medical expert committees and conferences/courses since 2018 from AstraZeneca, Janssen, Menarini, MSD, Novo Nordisk and Sanofi. JMGC participated in the CANVAS as an investigator.
Please cite this article as: Romero A, Llauradó G, González-Clemente J-M. Interpretación de los ensayos clínicos sobre efectos cardiovasculares de los fármacos hipoglucemiantes en personas con diabetes tipo 2. Endocrinol Diabetes Nutr. 2021;68:741–750.