


In the hospitalized patient, Diabetes mellitus type 2 (DM2) may result in a worse nutritional status due to its pathophysiology and dietary treatment.
ObjectivesThe aim of this study was to know if a hospitalized diabetic patient has a worse nutritional status, and to establish the influence of DM2 on the hospital length of stay in patients with malnutrition.
Material and methodsThis was a transveral study from January 2014 to October 2016; 1017 patients were included who were assessed by the Endocrinology and Nutrition Department. The data collected included anthropometry, plasma albumin, delay in performing the nutrition interconsultation and hospital length of stay. Nutritional status was evaluated using the Mini Nutritional Assesment (MNA) questionnaire and the nutritional risk score (NRS).
Results24.4% of the patients were diabetic and 75.6% were not. Diabetic patients had a higher body mass index (BMI) [23.18 (20.78–25.99) kg/m2 vs. 22.31 (19.79–25.30) kg/m2, p<0.01], a lower total score in the MNA questionnaire [16.5(13.12–19) points vs. 17(14–20) points, p<0.01], and a lower NRS score [83.09(77.72–91.12) points vs. 85.78(79.27–92.83) points, p=0.03]. According to the MNA and the NRS, diabetic patients had an increased risk of malnutrition (<17.5 points) [OR=1.39, IC95%(1.04–1.86), p=0.02]; and NRS (<85 points) [OR=1.65, IC 95% (1.07–2.54) p=0.02], respectively. When adjusted for age these significant results disappeared. Diabetes combined with malnutrition showed that diabetic patients with malnutrition (MNA<17.5) spent longer in hospital [21(12–36) days vs. 17(9–30) days, p=0.01].
ConclusionsDiabetic patients have a worse nutritional status than non-diabetic patients. Diabetic patients with a poor nutritional status spend a longer period in hospital.
En el paciente hospitalizado la diabetes mellitus tipo 2 (DM2) puede condicionar una peor situación nutricional debido a su fisiopatología y tratamiento dietético prescrito.
ObjetivosValorar si el paciente con DM2 hospitalizado tiene peor situación nutricional que el no diabético. Determinar la influencia de la DM2 en la estancia media en pacientes con mala situación nutricional.
Material y métodosEstudio transversal desde enero de 2014 hasta octubre de 2016, en 1.017 pacientes en los que se solicitó valoración nutricional al servicio de endocrinología y nutrición. Se recopilaron datos de antropometría, albúmina plasmática, demora en la realización de la interconsulta a nutrición y tiempo de estancia hospitalaria. Se analizó el estado nutricional mediante el cuestionario Mini Nutritional Assesment (MNA) y el índice de riesgo nutricional (IRN).
ResultadosDel total de pacientes el 24,4% eran pacientes con DM2 y 75,6% no lo eran. Los pacientes con DM2 presentaban mayor índice de masa corporal (23,18 [20,78-25,99] kg/m2 vs. 22,31 [19,79-25,30] kg/m2, p<0,01], menor puntuación total del cuestionario MNA (16,5 [13,12-19]) puntos vs. 17 [14-20] puntos, p<0,01), menor puntuación del índice IRN (83,09[77,72-91,12] puntos vs. 85,78 [79,27-92,83] puntos, p=0,03). El paciente con DM2 tiene un riesgo aumentado de padecer malnutrición según el cuestionario MNA (<17,5 puntos) (OR=1,39, IC 95% [1,04-1,86], p=0,02); e IRN [<85 puntos]) (OR=1,65, IC 95%: 1,07-2,54 p=0,02). Estos resultados significativos desaparecieron al ajustar por edad. Al valorar la desnutrición combinada con la diabetes, los pacientes con DM2 y malnutrición (MNA<17,5) tienen una estancia media hospitalaria mayor (21 [12-36] días vs. 17 [9-30] días=0,01).
ConclusionesLos pacientes con DM2 tienen peor situación nutricional que los pacientes sin DM2. Los pacientes con diabetes con peor situación nutricional presentan mayor estancia media hospitalaria.
Type 2 diabetes mellitus (DM2) is a chronic, complex and progressive disease characterized by chronic hyperglycemia together with alterations of carbohydrate, lipid and protein metabolism, all as a result of deficient insulin secretion or action, or both.1
The prevalence of DM2 is increasing as a result of aging of the population, lifestyle changes and an increased prevalence of obesity.2,3
According to the most recent data from the International Diabetes Federation, the estimated prevalence of DM2 worldwide is 463 million people; this figure may reach 700 million by 2045, and the prevalence of the disease is higher in urban areas than in the rural setting.4 In Europe, it is estimated that there are at least 59.8 million cases of known diabetes, and that over 23 million remain undiagnosed. As regards hospitalized patients, the incidence of hyperglycemia due to different disorders may be as high as 21.5%, if not higher.5
Type 2 diabetes mellitus is currently one of the leading causes of premature morbidity and mortality, as a result of its complications. The direct and indirect costs of DM2 and its complications account for a very important part of healthcare expenditure in different countries. According to data from the International Diabetes Federation in 2015, DM2 is the disorder with the greatest economic impact in both developed and developing countries, representing 5–20% of their global healthcare expenditure.5
In Spain, the Costs, outcomes and challenges for diabetes care in Spain study concluded that in 2009, patients with DM2 accounted for 8% of the total national healthcare expenditure, representing direct costs of 5100 million euros, costs attributed to complications totalling 1500 million euros, and indirect costs of 2800 billion euros derived from basal productivity losses.5
The disease is related to an increased risk of malnutrition. It is therefore important to determine whether DM2 influences patient nutritional status. In hospitalized individuals, DM2 may result in poorer nutritional status due to the underlying physiopathology and the prescribed dietary treatment. In the VIDA study, which evaluated nutritional status in more than 1000 hospitalized elderly subjects with DM2, 39.1% of the patients were found to be at risk of malnutrition, while 21.2% already had established malnutrition.6,7
In addition, it must be taken into account that malnutrition is a major problem in hospitalized patients, resulting in the prolongation of hospital stay, an increased reinfection rate, a greater percentage of readmissions and, consequently, an increase in healthcare costs.8,9
The PREDyCES study, conducted in several Spanish hospitals, analyzed the prevalence of malnutrition in national hospital centers and secondarily the costs derived from it.10 The study concluded that up to one out of every three patients with DM2 in hospital suffered malnutrition or were at risk of malnutrition. The main risk factors were age, associated disease, and DM2. Malnutrition was more prevalent in women, in diabetic patients over 70 years of age, and also in those admitted through the emergency room. The mentioned study also found malnutrition in hospitalized patients to prolong mean stay and increase the direct and indirect costs. Of note was the fact that up to 73.3% of all patients with diabetes and malnutrition did not receive any type of nutritional support during their stay - this underscoring the importance of adequate nutritional screening.11–13
On the other hand, diabetic patients with malnutrition have increased calorie and protein requirements, with high glycemic variability, which complicates management. This situation may be associated to poorer metabolic control, an increased frequency of gastrointestinal complications, and altered bowel motility.13,14
It is therefore necessary to determine whether appropriate nutritional assessment can influence the selection of a more adequate nutritional regimen and the patient outcome.
The present study was carried out to determine whether patients with DM2 have poorer nutritional status, and whether the mean hospital stay in patients with poor nutritional status is influenced by the presence of DM2.
Material and methodsStudy designA cross-sectional observational cohort study was carried out at Hospital Clínico Universitario de Valladolid (Valladolid, Spain). The sample size was calculated considering an estimated prevalence of diabetes in hospitalized patients of 20%, as well as the number of admissions per year in the study center. The calculated sample size was 373 patients. Data were collected to establish a control for each diabetic patient, resulting in an overall total of 746 patients.
A total of 1017 subjects were recruited, in which assessment of nutritional status was requested on the part of the Department of Endocrinology and Nutrition of the hospital. This study was approved by the Clinical Research Ethics Committee of Hospital Clínico Universitario de Valladolid (Ref. PI 16-490).
Patient selectionWe selected patients admitted to medical and surgical departments of Hospital Clínico Universitario de Valladolid for whom evaluation by the Nutrition Section had been requested for specialized support between January 2014 and October 2016.
The subjects were stratified into patients with and without DM2. The diagnosis of DM2 was established according to the diagnostic criteria of the American Diabetes Association.15
Study variablesAge and gender data were collected.
The anthropometric evaluation of the subjects was based on the determination of weight, height and body mass index (BMI). This evaluation was made by the nursing staff of the Department of Endocrinology and Nutrition. The nursing staff received training in order to reduce possible inter-individual variability.
Body weight was measured with an accuracy of ±0.1kg using a scale yielding values to the nearest 0.1kg (SECA, Birmingham, UK). Height was measured with the patient standing, using a stadiometer (SECA, Birmingham, UK). Body mass index was calculated using the formula: weight (kg)/height×height (m2).
Percentage weight loss (%WL) was used to assess relative differences in weight.
If the patient could not be weighed, a body weight estimate was made according to the Malnutrition Universal Screening Tool. This tool is designed to detect malnutrition or risk of malnutrition based on three criteria: BMI, unintentional weight loss, and the existence of acute disease causing decreased food intake.16 In our study, BMI was estimated from the brachial circumference; if the latter was <23.5cm, a BMI of <20kg/m2 was estimated; in contrast, if the brachial circumference was >32cm, a BMI of >30kg/m2 was estimated.17
Serum albumin was measured using a colorimetric test (g/dl).
We recorded the time delay between interconsultation with Nutrition and mean hospital stay.
The assessment of nutritional status was made using the Mini-Nutritional Assessment (MNA) tool, in which the patient answers a questionnaire addressing 6 food intake items, two items referred to anthropometric data (recent weight loss and BMI), and three questions on general parameters such as morbidity, emotional stress, and neuropsychological aspects. The sum of the different items yields a score that allows us to distinguish between individuals with an adequate nutritional status (MNA ≥24), those at risk of malnutrition (MNA 23.5–17.5), and those with malnutrition (MNA <17).18
The Nutritional Risk Index (NRI) was used to assess the risk of developing complications related to nutritional status. This tool applies the formula established by Buzby et al.: 1.59×serum albumin (g/l)+41.7×(current body weight [kg]/usual body weight [kg]). This is a useful tool, since it indicates the risk of developing complications related to malnutrition. An NRI score of over 100 indicates good nutritional status, while scores below 83.5 indicate severe malnutrition.19
Statistical analysisThe data were entered in a database of the SPSS version 15.0 statistical package (SPSS Inc., Chicago, IL, USA), with an official license of the University of Valladolid. Normal distribution of continuous variables was assessed using the Kolmogorov–Smirnov test.
Continuous variables were reported as the mean (standard deviation [SD]) and non-continuous variables as the median (p25-p75). Parametric variables were analyzed using the unpaired and paired Student t-test, while nonparametric variables were analyzed using the Friedman, Wilcoxon, K Kruskal and Mann–Whitney U tests.
Qualitative variables were expressed as percentages (%) and analyzed using the chi-square test (with Fisher and Yates corrections where necessary). Statistical significance was considered for p<0.05.
ResultsA first descriptive analysis found 24.4% of all patients to have diabetes, while 75.6% did not.
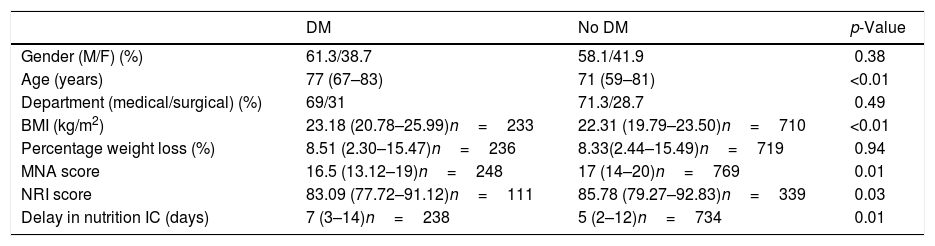
A total of 58.9% of the patients were males. The mean patient age was 73.01 years (61–82), and the delay in interconsultation with Nutrition was 6.01 days.2–12 A total of 29.3% of the patients were admitted to surgical departments, while 70.7% were admitted to medical departments. Table 1 shows the differences in these parameters between patients with and without DM2.
Differences in the study variables in patients with and without diabetes (DM).
| DM | No DM | p-Value | |
|---|---|---|---|
| Gender (M/F) (%) | 61.3/38.7 | 58.1/41.9 | 0.38 |
| Age (years) | 77 (67–83) | 71 (59–81) | <0.01 |
| Department (medical/surgical) (%) | 69/31 | 71.3/28.7 | 0.49 |
| BMI (kg/m2) | 23.18 (20.78–25.99)n=233 | 22.31 (19.79–23.50)n=710 | <0.01 |
| Percentage weight loss (%) | 8.51 (2.30–15.47)n=236 | 8.33(2.44–15.49)n=719 | 0.94 |
| MNA score | 16.5 (13.12–19)n=248 | 17 (14–20)n=769 | 0.01 |
| NRI score | 83.09 (77.72–91.12)n=111 | 85.78 (79.27–92.83)n=339 | 0.03 |
| Delay in nutrition IC (days) | 7 (3–14)n=238 | 5 (2–12)n=734 | 0.01 |
Mann–Whitney U-test.
M: males; IC: interconsultation; BMI: body mass index; NRI: nutritional risk index; F: females; MNA: Mini-Nutritional Assessment.
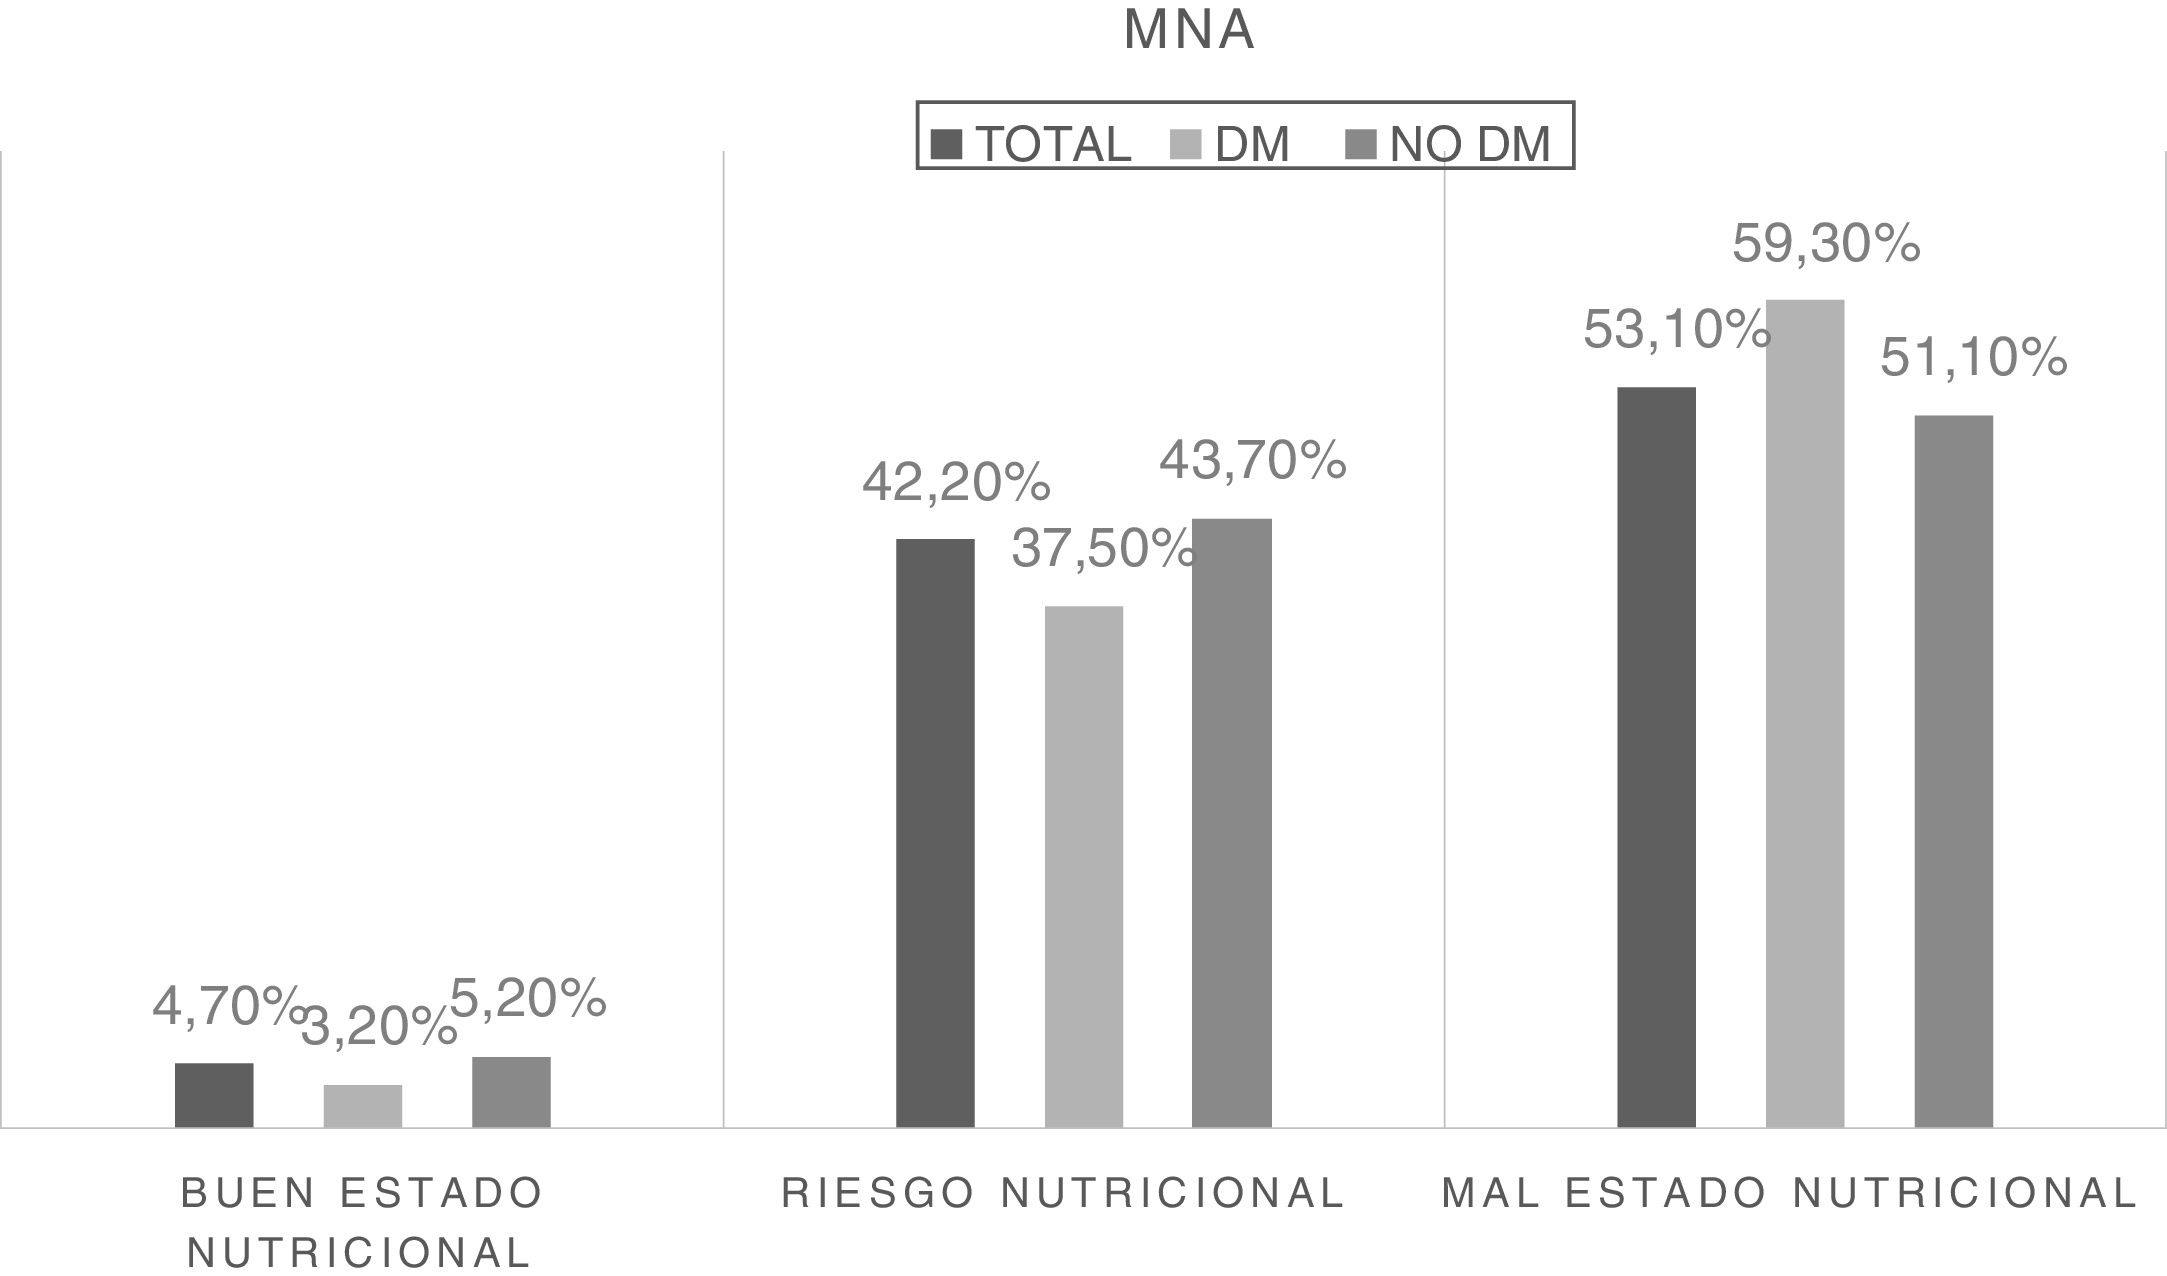
The nutritional status of the sample was analyzed based on the numerical score obtained from the MNA questionnaire, and three groups were established based on that score. Fig. 1 shows the difference in frequency of malnutrition according to the presence of diabetes.
 tool, according to the presence or absence of type 2 diabetes mellitus (DM2) (Mann–Whitney U-test; p=0.06).")
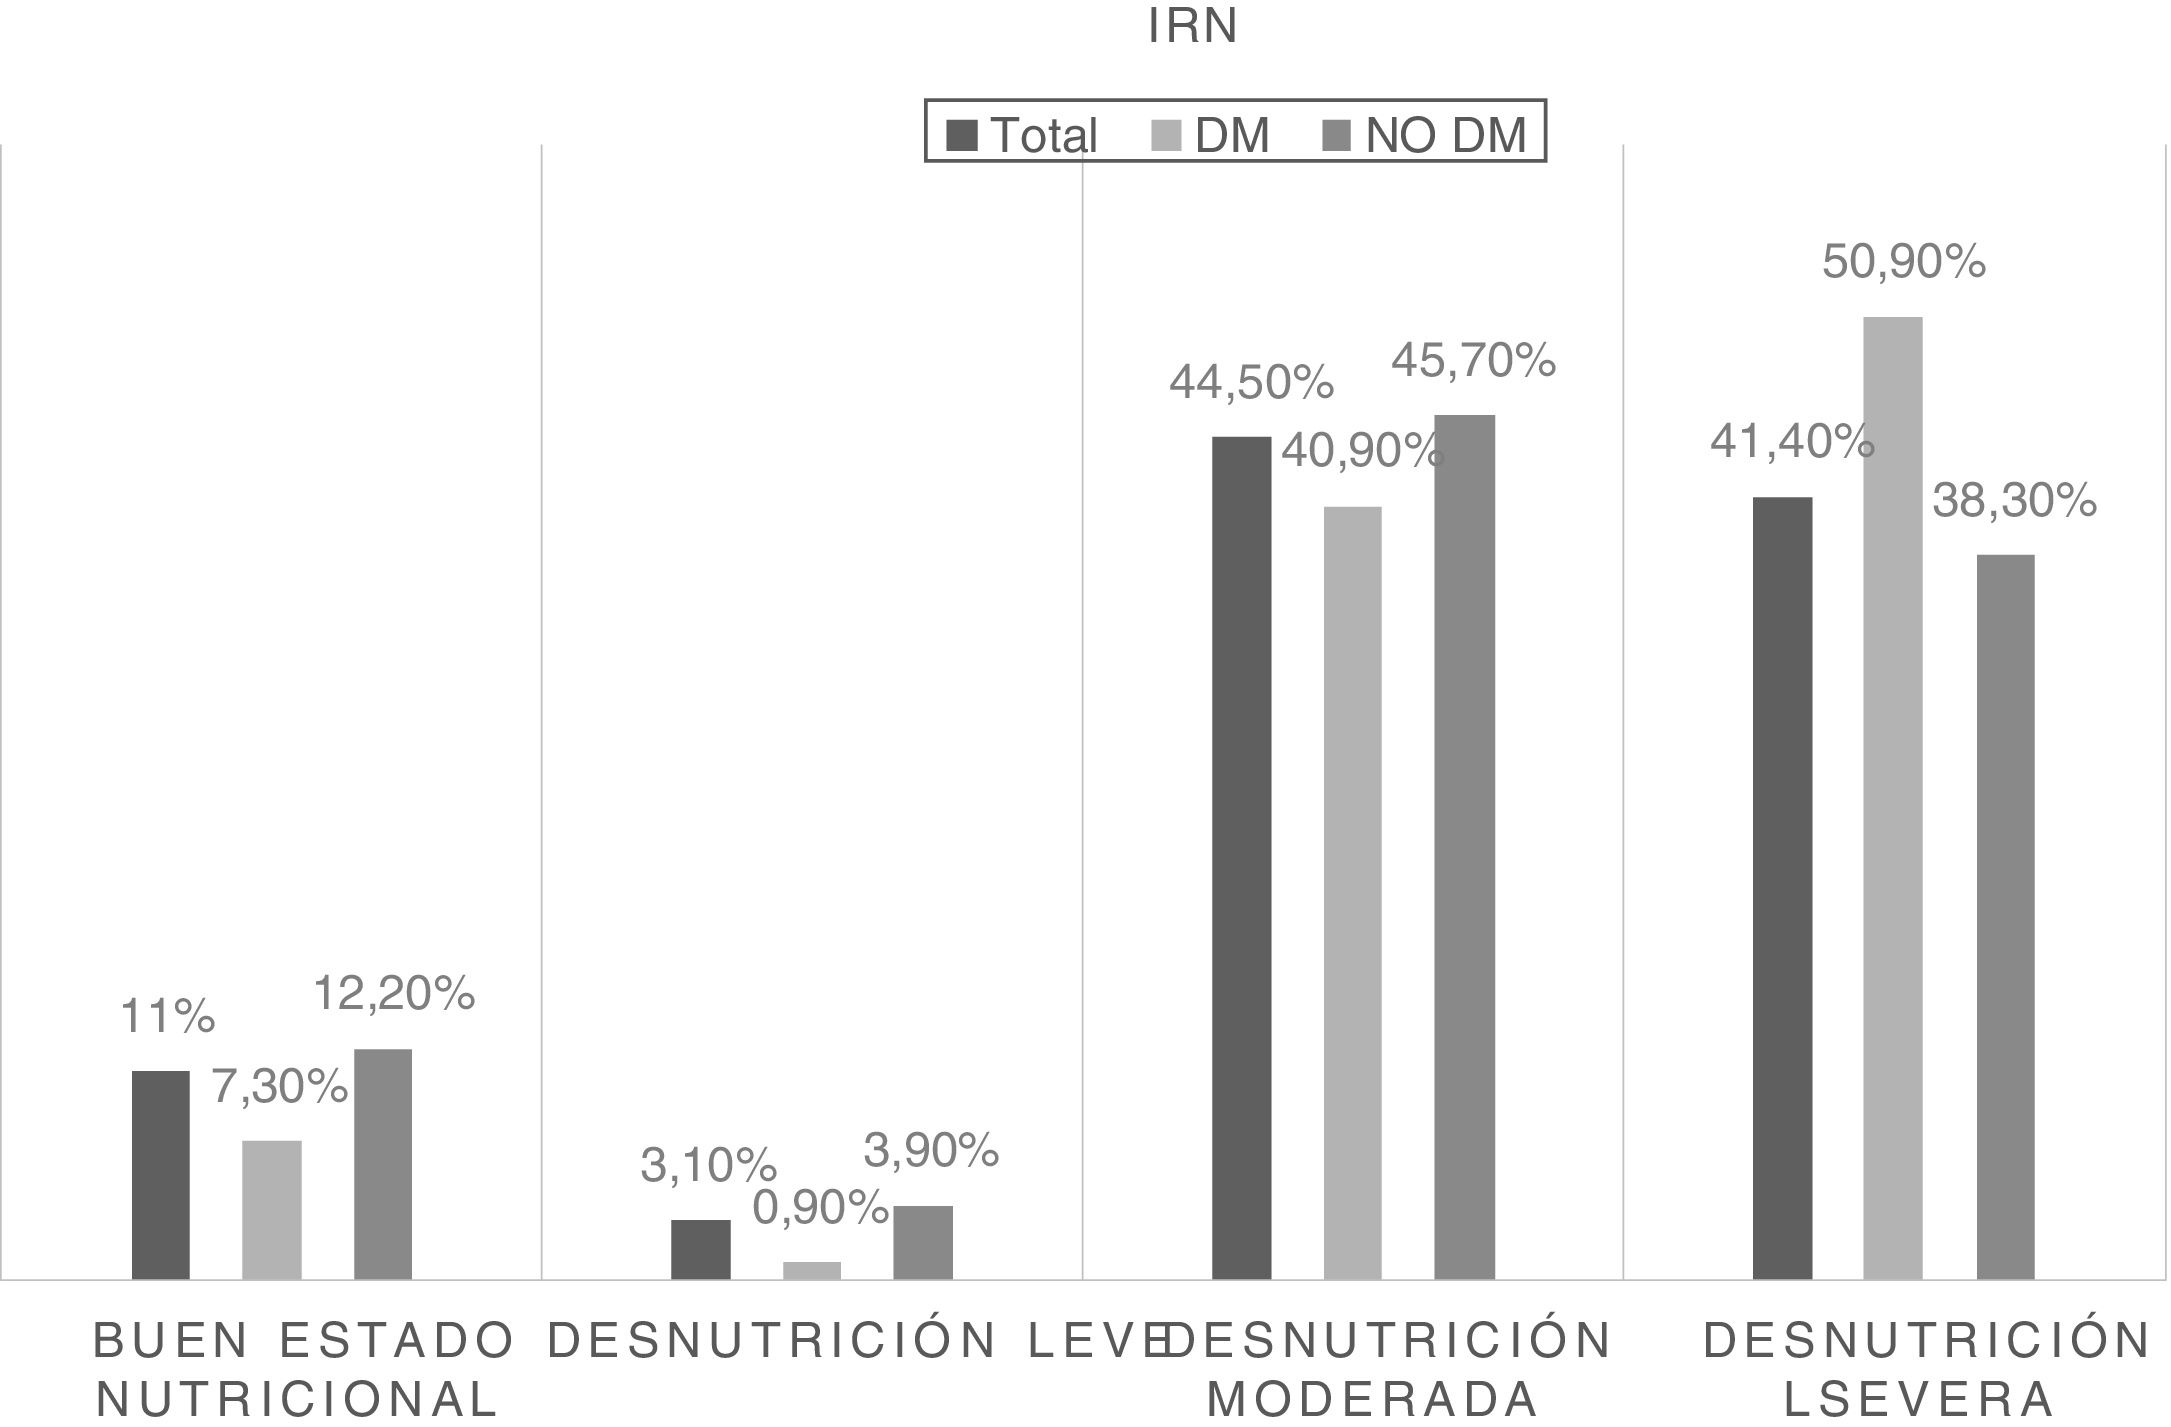
On the other hand, risk related to malnutrition was stratified by NRI score into four categories. Fig. 2 shows the frequency of patients at risk according to nutritional status and its differences between patients with and without diabetes.
, according to the presence or absence of type 2 diabetes mellitus (DM2) (Mann–Whitney U-test; p=0.05).")
The mean stay was longer in patients with DM2 than in patients without diabetes (20.01 days [10.25–34] vs. 16.01 days),9–29 the difference being statistically significant (p=0.02).
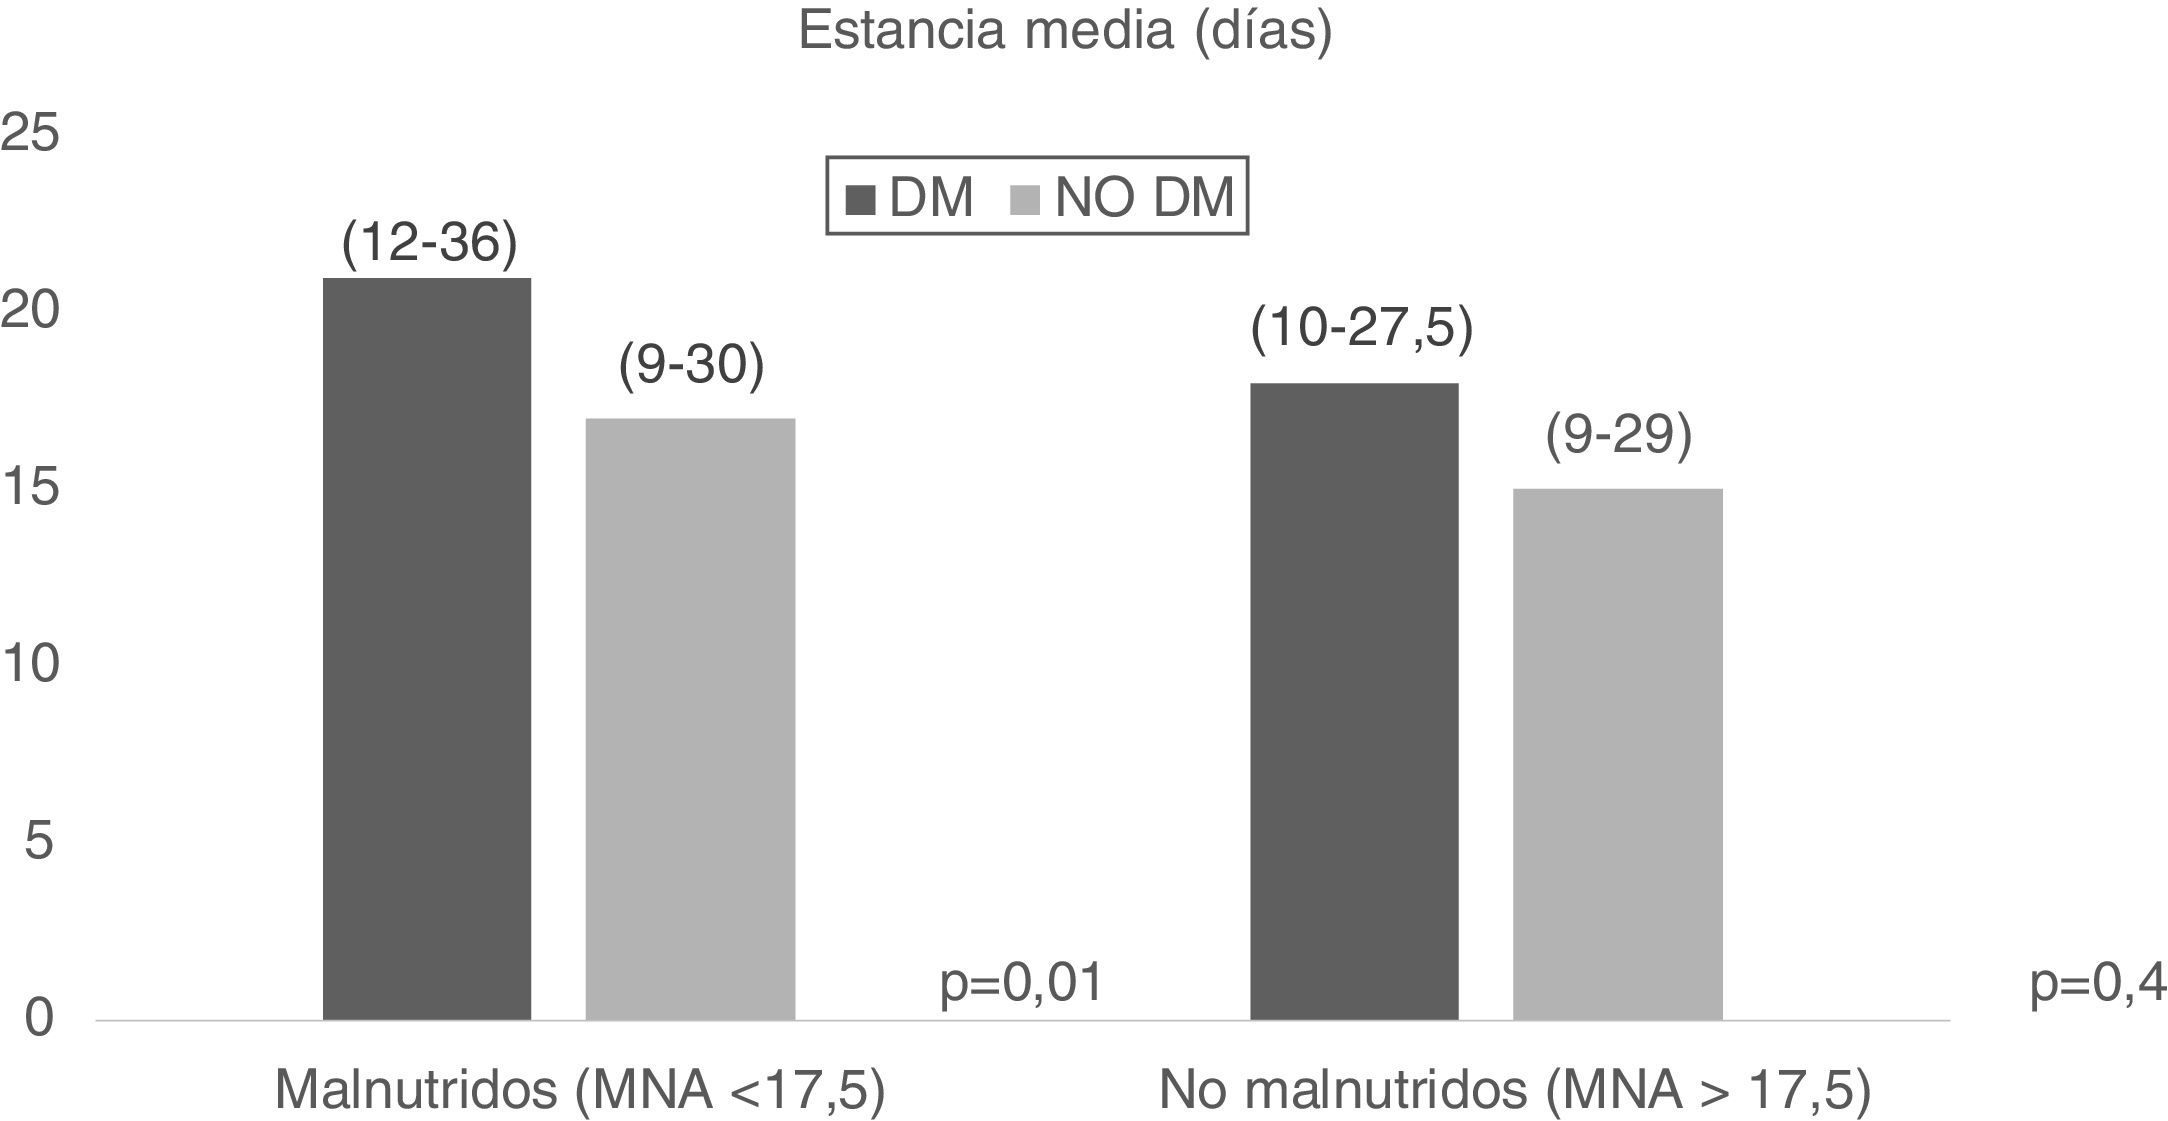
On the other hand, malnutrition combined with DM2 was evaluated, and it was seen that patients with DM2 and malnutrition (MNA<17.5) had a longer mean stay (21.01 days [12–36] vs. 17.01 days [9–30], p=0.01), with no significant results in the case of patients with malnutrition according to the MNA (MNA>17.5) (Fig. 3).
 according to nutritional status. Mann–Whitney U-test.")
The univariate analysis showed the presence of DM2 to be associated to an increased risk of suffering malnutrition according to the MNA score (<17.5 points) (odds ratio [OR]=1.39, 95% confidence interval [95%CI]: 1.04–1.86; p=0.02) and the NRI score (<85 points) (OR=1.65, 95%CI: 1.07–2.54; p=0.02).
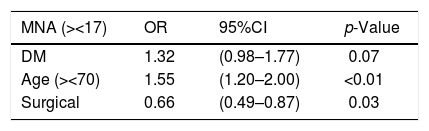
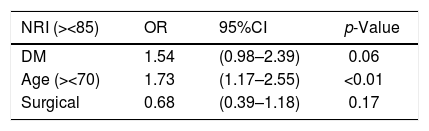
The multivariate analysis, after adjusting for age (over/under 70 years) and department of admission (surgical/medical), showed no significant results according to either the MNA or the NRI scores (Tables 2 and 3).
Risk of malnutrition according to the Mini-Nutritional Assessment (MNA) in patients with diabetes mellitus (DM) adjusted for age and department of admission (surgical/medical).
| MNA (><17) | OR | 95%CI | p-Value |
|---|---|---|---|
| DM | 1.32 | (0.98–1.77) | 0.07 |
| Age (><70) | 1.55 | (1.20–2.00) | <0.01 |
| Surgical | 0.66 | (0.49–0.87) | 0.03 |
Binary logistic regression analysis.
Risk of malnutrition according to the Nutritional Risk Index (NRI) in patients with diabetes mellitus (DM) adjusted for age and department of admission (surgical/medical).
| NRI (><85) | OR | 95%CI | p-Value |
|---|---|---|---|
| DM | 1.54 | (0.98–2.39) | 0.06 |
| Age (><70) | 1.73 | (1.17–2.55) | <0.01 |
| Surgical | 0.68 | (0.39–1.18) | 0.17 |
Binary logistic regression analysis.
The most relevant findings of our study include statistically significant differences in mean stay, which was seen to be longer in hospitalized patients with DM2. The influence of nutritional status on mean hospital stay was also assessed, with an increase in days of stay being observed in patients with malnutrition and MNA<17.5.
The proportion of patients with DM2 in our study was 24.4%. This figure is slightly higher than in other studies where patients with diabetes represented 17.5% of the hospitalized population.20
Mean age was greater in the group of patients with DM2 than in the group without diabetes. This finding is similar to the data reported by other studies, and may be correlated to the fact that the prevalence of DM2 increases due to several causes, including aging of the population.2–4
Patients with DM2 had poorer nutritional status when assessed using the MNA questionnaire, and among the patients with poor nutritional status, those with DM2 had a greater risk of complications according to the INR. It is difficult to compare the results of different studies, not only because of differences between the analyzed populations, but also because of the different assessment tools employed. There are multiple nutritional screening systems with different sensitivities and specificities, and they are not equally applicable to all patients.21,22
Several Spanish series have evaluated the prevalence of malnutrition in hospitalized elderly patients. The most important national study on the prevalence of hospital malnutrition is the PREDyCES trial, which evaluated the prevalence of malnutrition and its associated costs in a total of 1707 patients from 31 randomly selected public hospitals. Among the patients over 70 years of age, 37% were seen to be at nutritional risk upon admission – this figure being similar to that recorded in our own study. On the other hand, according to the PREDyCES trial, the presence of DM was associated to a 40% higher risk of malnutrition.10
This increase in malnutrition in patients with DM2 may be related to the characteristics of the diets provided during admission, since the use of restrictive therapeutic diets is common practice, and these diets generally do not meet the nutritional needs of hospitalized patients. A study evaluating the diet specifications of a Spanish hospital found that they did not meet the energy needs of the patients.23 We also should take into account the decreased appetite experienced by patients during hospital stay – with the resultant decrease in food intake.24 It is therefore important to adjust the prescribed diet to the hospitalized patient and also consider palatability issues.
On analyzing the anthropometric data in both study groups, patients with DM2 had a higher BMI, with a notoriously higher prevalence of malnutrition in this group. The VIDA study, conducted in Spanish hospitals, also observed a high percentage of obesity in hospitalized patients with DM2, presenting BMI >30kg/m2, and with 39.50% of the patients being at risk of malnutrition.6,7
These data may be related to the existence of sarcopenic obesity in hospitalized patients. This term was coined to define the observed decrease in muscle mass associated to aging, and which in turn is associated to a simultaneous increase in fat mass.25 In 2011, within the EXERNET multicenter project, the prevalence of sarcopenic obesity in Spain was estimated to be 15% among the population over 65 years of age. This proportion was seen to rise with increasing age, reaching over 20% in people aged 70 and 75 years, and sarcopenic obesity moreover occurred earlier in men than in women.26
Sarcopenia is a syndrome characterized by progressive and generalized loss of skeletal muscle mass and strength, and is related to an increased risk of complications.27 There is a close relationship among diabetes mellitus, sarcopenia and frailty. Insulin resistance is associated to loss of muscle mass secondary to decreased mitochondrial function leading to impaired glucose transport to muscles, resulting in selective atrophy of fast muscle fibers and decreased muscle regeneration.28 A study in patients with DM2 designed to assess the relationship between sarcopenia and quality of life, diet and glycemic control identified a negative relationship between the degree of sarcopenia and nutritional status and quality of life.29
Mean stay was longer in the patients with DM2 than in those without diabetes. On assessing the influence of nutritional status combined with the presence of DM2, we found patients with diabetes and poorer nutritional status (MNA<17.5) to have a longer mean stay – thus confirming the impact of nutritional status upon the healthcare costs. This has also been observed in other Spanish national studies, such as the VIDA trial, conducted in an older hospitalized population with DM2, in which malnutrition increased mean stay by two days in the group of patients with malnutrition, regardless of age or gender. A higher mortality rate was moreover observed in the group of patients with malnutrition.7 The PREDyCES trial recorded an increase in mean hospital stay in patients with poorer nutritional status – this in turn being associated to an increase in direct and indirect healthcare costs.10 Other studies in geriatric hospitals have also evidenced an increase in hospital stay in patients with malnutrition.30
Another important finding was the delay in interconsultation with the Nutrition Department. In effect, the delay was seen to be 7 days in patients with DM2 versus 5 days in patients without diabetes. This could be related to the erroneously perceived better nutritional status of diabetic individuals with elevated BMI. This situation leads to a delay in nutritional screening and in the start of adequate treatment.
In the univariate analysis, DM2 was related to an increased risk of malnutrition, regardless of whether the latter was measured according to the MNA or the NRI. However, on stratifying the sample according to age (over and under 70 years of age), no significant results were obtained. This observation is similar to that reported by Solorzano et al. in Mexico, who found patients with DM2 to exhibit up to two-fold poorer nutritional status than patients without diabetes, according to the MNA and the subjective global assessment (SGA) tool.31
Lastly, mention must be made of the limitations of our study. In effect, this is an observational, cross-sectional trial conducted in a single hospital, and extrapolation of the results therefore should be made with caution. On the other hand, due consideration must be made of the age of the patients in the sample as a confounding factor that prevents us from firmly concluding that diabetes mellitus increases the risk of malnutrition. Finally, we do not have data referred to the HbA1c levels of the patients with DM2, nor to the associated comorbidities, which could represent confounding factors.
Prospective studies would be advisable, assessing whether there are differences in nutritional treatment in patients with DM2 versus those without. On the other hand, it would be important to conduct studies assessing the possible risk factors related to the poorer nutritional status of hospitalized patients with DM2, with a view to preventing malnutrition. In addition, we would need to know whether there are nutritional therapeutic measures allowing us to address malnutrition in these patients and reduce the impact of the complications.
ConclusionsHospitalized patients with DM2 have poorer nutritional status than patients without diabetes as assessed by the Mini-Nutritional Assessment (MNA) tool.
In hospitalized patients with DM2, those with poorer nutritional status present a longer mean hospital stay.
Conflicts of interestThe authors declare that they have no conflicts of interest.
Please cite this article as: Serrano Valles C, López Gómez JJ, García Calvo S, Jiménez Sahagún R, Torres Torres B, Gómez Hoyos E, et al. Influencia del estado nutricional sobre la estancia media hospitalaria en el paciente con diabetes mellitus tipo 2. Endocrinol Diabetes Nutr. 2020;67:617–624.