


Type 2 diabetes mellitus (T2DM) is an inflammatory condition associated to obesity and increased oxidative stress. Haptoglobin (Hp) is an acute phase reactant that scavenges extracorpuscular hemoglobin from circulation and prevents heme-iron oxidative damage.
ObjectiveTo assess the association between Hp levels and Hp1–Hp2 gene polymorphism and clinical and laboratory parameters in patients with T2DM.
MethodsThe study sample consisted of 102 T2DM patients and 62 controls. Hp plasma levels were measured using an ELISA assay, and Hp genotyping was performed using a specific two-step allelic polymerase chain reaction.
ResultsHp levels were higher in T2DM patients as compared to controls (p=0.005). T2DM patients with high blood pressure had higher Hp levels than patients without this comorbidity (p=0.021). Obese T2DM patients had higher Hp levels as compared to obese controls (p=0.009) and to non-obese T2DM patients (p=0.003). The Hp1–Hp1 genotype was showed to be associated to T2DM according to additive (OR=3.038, 95% CI 1.127–8.192; p=0.036) and dominant model (OR=0.320, 95% CI 0.118–0.839; p=0.010), but Hp2 allele carriers contributed with higher Hp levels in T2DM as compared to controls. Waist circumference (p=0.002), BMI (p=0.001), and IL-6 (p=0.012), and hs-CRP (p=0.001) levels positively correlated with Hp levels in the T2DM group.
ConclusionThese results suggest that Hp levels are influenced by Hp1–Hp2 polymorphism, obesity, inflammatory status, and high blood pressure in T2DM.
La diabetes mellitus tipo 2 (DM2) es una afección inflamatoria asociada con la obesidad y el aumento del estrés oxidativo. La haptoglobina (Hp) es un reactante de fase aguda que elimina la hemoglobina extracorpuscular de la circulación y previene el daño oxidativo del hierro hemo.
ObjetivoEvaluar la asociación entre los niveles de Hp y el polimorfismo del gen Hp1-Hp2, y los parámetros clínicos y de laboratorio en individuos con DM2.
MétodosCiento dos pacientes con DM2 y 62 controles se incluyeron en este estudio. Los niveles plasmáticos de Hp se cuantificaron por ELISA y el genotipado de Hp se llevó a cabo mediante una PCR alelo-específica en dos pasos.
ResultadosLos niveles de Hp fueron más altos en pacientes con DM2 en comparación con los controles (p=0,005). Los pacientes con DM2 con hipertensión arterial mostraron niveles más altos de Hp en comparación con los pacientes sin hipertensión (p=0,021). Los pacientes obesos con DM2 mostraron niveles más altos de Hp en comparación con los controles obesos (p=0,009) y con los pacientes con DM2 no obesos (p=0,003). El genotipo Hp1-Hp1 mostró asociación con DM2 según el modelo aditivo (OR=3,038; IC 95%: 1,127-8,192; p=0,036) y el modelo dominante (OR=0,320; IC 95%: 0,118-0,839; p=0,010), pero entre los portadores del alelo Hp2, las concentraciones de Hp eran más altas en T2DM que en controles. La circunferencia de la cintura (p=0,002), el IMC (p=0,001), IL-6 (p=0,012) y la hs-CRP (p=0,001) se correlacionaron positivamente con los niveles de Hp en el grupo DM2.
ConclusiónEstos resultados sugieren que los niveles de Hp están influenciados por el polimorfismo Hp1-Hp2, la obesidad, el estado inflamatorio y la hipertensión en DM2.
Type 2 diabetes mellitus (T2DM) is a chronic disease and the most prevalent form of diabetes.1 The pathogenesis of T2DM has been associated with a subclinical chronic inflammation and activation of the immune system.2–4
Haptoglobin (Hp) is an acute-phase reactant α2-glycoprotein (54kDa) that primarily scavenges the hemoglobin (Hb) released into circulation either by hemolysis or by normal red blood cell turnover, preventing Hb-related oxidative damage.5–7 The Hp-Hb soluble complex is not filtered through the glomeruli, but is transported to the liver to be degraded by Hp–Hb scavenger receptors, such as the CD163 receptor found on the surface of monocytes, macrophages, and Kupffer cells.8,9 The Hp–Hb–CD163 complex induces the production of several anti-inflammatory and antioxidative mediators.10
Hp levels increase several fold (3–8-fold) in response to local or systemic inflammatory stimuli.11 The major inducers are proinflammatory cytokines such as IL-1, IL-6, and TNF-α,12 since there are binding sites for cytokines on the regulatory regions of the Hp gene promoter, with control of transcription rates and subsequent protein synthesis.13 One study demonstrated in an 8-week follow-up streptozotocin-induced diabetes model that changes in Hp expression are strongly associated with TNF-α and IL-6 serum levels and TNF-α/IL-6 ratio.14
The Hp gene is located on the long arm of chromosome 16 (16q22.2) and presents polymorphism characterized by two alleles: Hp1 and Hp2. The Hp1 allele has five exons and is conserved among species. The Hp2 allele is human-specific and has seven exons that likely arose from a duplication (non-homologous crossing over) involving exons 3 and 4 of the Hp1 allele.9
Hp is synthesized as a single chain, which is cleaved in an amino-terminal α-chain and a carboxy-terminal β-chain, linked by disulfide bonds. The α-chain encoded by Hp1 allele (α1 – 9kDa) is smaller than that produced by Hp2 allele (α2 – 16–20kDa). The β-chain (40kDa) is identical for both Hp alleles and contains the main domains involved in Hp-Hb binding. Therefore, the stoichiometry of the mature Hp protein is genotype-dependent: Hp1–Hp1 individuals produce a single linear homodimer, Hp2–Hp2 produce cyclic polymers, and in heterozygous subjects, the Hp protein can be found as linear homodimer and/or multimers.15–17 Besides the structural differences, Hp1 and Hp2 protein products presents other functional differences: the ability to bind the Hb, the capacity to bind the Hp–Hb complex to the CD163 receptor, the clearance rates of the Hp–Hb complex from circulation, and the inhibitory effect on prostaglandin synthesis (Hp anti-inflammatory action), which are markedly greater in Hp1–Hp1 than Hp2 carrier.18
The frequencies of Hp alleles and genotypes vary worldwide. Previous studies have indicated that Hp1 allele is most frequent in Africa and South America and less frequent in Southeast Asia. In western countries, the average distribution of Hp genotypes is 16% Hp1–Hp1, 48% Hp2–Hp1, and 36% Hp2–Hp2, which correspond to allele frequencies about 40% Hp1 and 60% Hp2.9,19
Since T2DM and its complications have been associated with increased oxidative stress induced primarily by hyperglycaemia,20 Hp can present an important role in this context due to its antioxidant activity by scavenging extracorpuscular Hb, which can initiate a free radical reaction by releasing heme iron.17,20
In spite of the existence of some reports examining the association between T2DM and Hp20–30 in different populations, the results are still controversial. Therefore, in this study we intended to evaluate the association between Hp levels and Hp1–Hp2 gene polymorphism, as well as clinical and laboratory parameters in a group of T2DM Brazilian patients.
Material and methodsEthical aspectsThis study was approved by the ethics committees of Federal University of Minas Gerais (Minas Gerais, Brazil) – ETIC 0062.0.203.000-11 – and of Santa Casa Hospital (Minas Gerais, Brazil) – 059/2011 – according to the ethical guidelines of the Declaration of Helsinki. All participants provided written informed consent prior to entering the study.
Experimental designThis cross-sectional, case–control study was conducted with 164 subjects aged 32–70 years. The case group included 102 patients with clinical and laboratory diagnosis of T2DM, according to the criteria established by the American Diabetes Association (ADA),31 while 62 gender-, age- and body mass index (BMI)-matched non-diabetic individuals were classified as the control group. A 2:1 case/control proportion was adopted, according to a sample calculation based on the mean values of Hp levels from a sample of the groups (power=0.95; significance level=0.05). T2DM patients were recruited at the Clinic of Endocrinology (Santa Casa Hospital, Minas Gerais, Brazil) from June 2012 to September 2013. Control group subjects were recruited from the local community during the same period. The exclusion criteria included the following parameters: age over 70 years, pregnancy, cancer, autoimmune diseases, recent history of cardiovascular disease (e.g. heart attack, stroke, thrombosis in the last five years), and current or recent infections and/or inflammatory processes. Interviews and medical records were utilized to obtain clinical and laboratory data for all T2DM patients. Presence or absence of hypertension was defined by the clinical staff at the Clinic of Endocrinology (Santa Casa Hospital, Minas Gerais, Brazil), conforming to the criteria adopted by ADA31: systolic blood pressure≥140mmHg or diastolic blood pressure≥80mmHg, or use of antihypertensive drugs. Controls presented normal fasting blood glucose levels (60–99mg/dL) and they did not use hypoglycemic drugs.
Blood samplingVenous blood samples were collected from each participant in EDTA and anticoagulant-free tubes, allowed to clot for 30min, and centrifuged at 1100×g for 20min at 25°C. The supernatant fractions obtained (plasma and serum) were aliquoted in microtubes and stored at −80°C until biochemical analysis. An aliquot of whole blood collected in EDTA was also stored for later genomic DNA extraction and Hp genotyping analysis.
Biochemical measurementsSubjects in the control group had their fasting glucose blood levels measured immediately after centrifugation of serum samples obtained after 8h of fasting. The tests were performed with an enzyme-colorimetric method, using Glicose-PP kit (Gold Analisa, Minas Gerais, Brazil) following the manufacturer's instructions, and BTR 811 spectrophotometer (Biotron, Brazil).
The high-sensitivity C reactive protein levels (hs-CRP) were measured in serum samples using the immunoturbidimetric method, hsCRP VITROS Chemistry Products (Ortho Clinical Diagnostics, New York, USA) following the manufacturer's instructions, and System Vitros Chemistry 5.1 FS (Ortho Clinical Diagnostics, New York, USA). HbA1c levels were determined in plasma samples using high performance liquid chromatography (HPLC) method in D10 – Hemoglobin A1C Testing System (Bio Rad®, France). This method is certified by National Glycohemoglobin Standardization Program (NGSP).
The plasma levels of cytokines TNF-α, IL-10, and IL-6 were determined by the cytometric bead array (CBA) method using human enhanced sensitivity flex set systems (BD Biosciences Pharmingen, California, USA), following the manufacturers’ instructions. Data acquisition and analysis were performed in LSRFortessa™ flow cytometer (BD Biosciences Pharmingen, California, USA) using FCAP Array Software version 1.0.1.
Hp plasma levels were quantified using an enzyme linked immunosorbent assay (ELISA) – Quantikine® ELISA Human Haptoglobin Immunoassay (R&D Systems, Minneapolis, USA), which equally detect both human forms Hp1–Hp1 and Hp2–Hp2, following the manufacturer's protocol. hs-CRP, cytokines, and Hp levels were measured at the same time for all samples.
Haptoglobin genotypingGenomic DNA was obtained using Biopur Mini Spin Kit (Biometrix Biotecnologia®, Curitiba, Brazil). Hp genotyping was performed with a specific two-step allelic polymerase chain reaction (PCR) technique as described by Koch et al.32. In the first reaction, the 1757bp allele 1 specific fragment and the 3481bp allele 2 specific fragment were amplified with primer A (5′-GAGGGGAGCTTGCCTTTCCATTG-3′) and primer B (5′-GAGATTTTTGAGCCCTGGCTGGT-3′). In the second reaction, only the 349bp allele 2 specific sequence was amplified, using primer C (5′-CCTGCCTCGTATTAACTGCACCAT-3′) and primer D (5′-CCGAGTGCTCCACATAGCCATGT-3′). PCR conditions were as follow: initial denaturing at 95°C for 2min, followed by 35 cycles of 95°C for 1min, 69°C for 2min (1min for reaction 2), 69°C for 2min (1min for reaction 2) and final extension of 7min at 72°C. PCR products were visualized in 1% agarose gel electrophoresis later stained with ethidium bromide solution (10mg/mL – Sigma–Aldrich, Missouri, USA).
Statistical analysisThe data were tested for normality by Shapiro–Wilk test. Parametric variables were presented as mean±standard deviation (SD), non-parametric variables as median (interquartile range – IQR), and percentage of total for categorical variables.
Comparisons for parametric variables were performed with Student's t-test or analysis of variance (ANOVA) followed by LSD post hoc test; and for non-parametric variables was used Mann–Whitney test or Kruskal–Wallis and Bonferroni's correction when necessary.
Hardy–Weinberg equilibrium (HWE) was evaluated using exact tests by GENEPOP and OEGE on-line softwares (available at: http://genepop.curtin.edu.au/genepop_op1.html and http://www.oege.org/software/hardy-weinberg.html, respectively). Differences in genotypic and allelic frequencies between the groups were tested with chi-square (χ2) test with residual analysis.
Correlation analyses between Hp levels, clinical and biochemical parameters in T2DM group were performed with Spearman's correlation test.
All statistical analyses were performed with the Statistical Package of the Social Sciences (SPSS) version 17.0, and a p-value ≤0.05 was considered statistically significant.
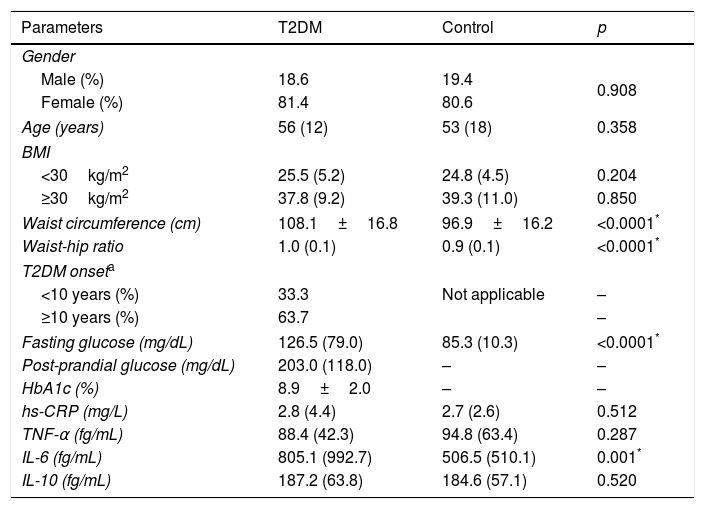
ResultsTable 1 presents the clinical and laboratory characteristics of case (T2DM) and control groups. The groups were matched by gender, age, and BMI (p>0.05 for all). T2DM patients displayed higher waist circumference (p<0.0001), waist-hip ratio (p<0.0001), fasting glucose (p<0.0001), and IL-6 levels (p=0.001) when compared to non-diabetic controls.
Clinical and laboratory characteristics of T2DM patients and controls.
| Parameters | T2DM | Control | p |
|---|---|---|---|
| Gender | |||
| Male (%) | 18.6 | 19.4 | 0.908 |
| Female (%) | 81.4 | 80.6 | |
| Age (years) | 56 (12) | 53 (18) | 0.358 |
| BMI | |||
| <30kg/m2 | 25.5 (5.2) | 24.8 (4.5) | 0.204 |
| ≥30kg/m2 | 37.8 (9.2) | 39.3 (11.0) | 0.850 |
| Waist circumference (cm) | 108.1±16.8 | 96.9±16.2 | <0.0001* |
| Waist-hip ratio | 1.0 (0.1) | 0.9 (0.1) | <0.0001* |
| T2DM onseta | |||
| <10 years (%) | 33.3 | Not applicable | – |
| ≥10 years (%) | 63.7 | – | |
| Fasting glucose (mg/dL) | 126.5 (79.0) | 85.3 (10.3) | <0.0001* |
| Post-prandial glucose (mg/dL) | 203.0 (118.0) | – | – |
| HbA1c (%) | 8.9±2.0 | – | – |
| hs-CRP (mg/L) | 2.8 (4.4) | 2.7 (2.6) | 0.512 |
| TNF-α (fg/mL) | 88.4 (42.3) | 94.8 (63.4) | 0.287 |
| IL-6 (fg/mL) | 805.1 (992.7) | 506.5 (510.1) | 0.001* |
| IL-10 (fg/mL) | 187.2 (63.8) | 184.6 (57.1) | 0.520 |
T2DM (type 2 diabetes mellitus), BMI (body mass index), HbA1c (glycated hemoglobin), hs-CRP (high sensitivity C reactive protein), TNF-α (tumor necrosis factor alpha), IL (interleukin).
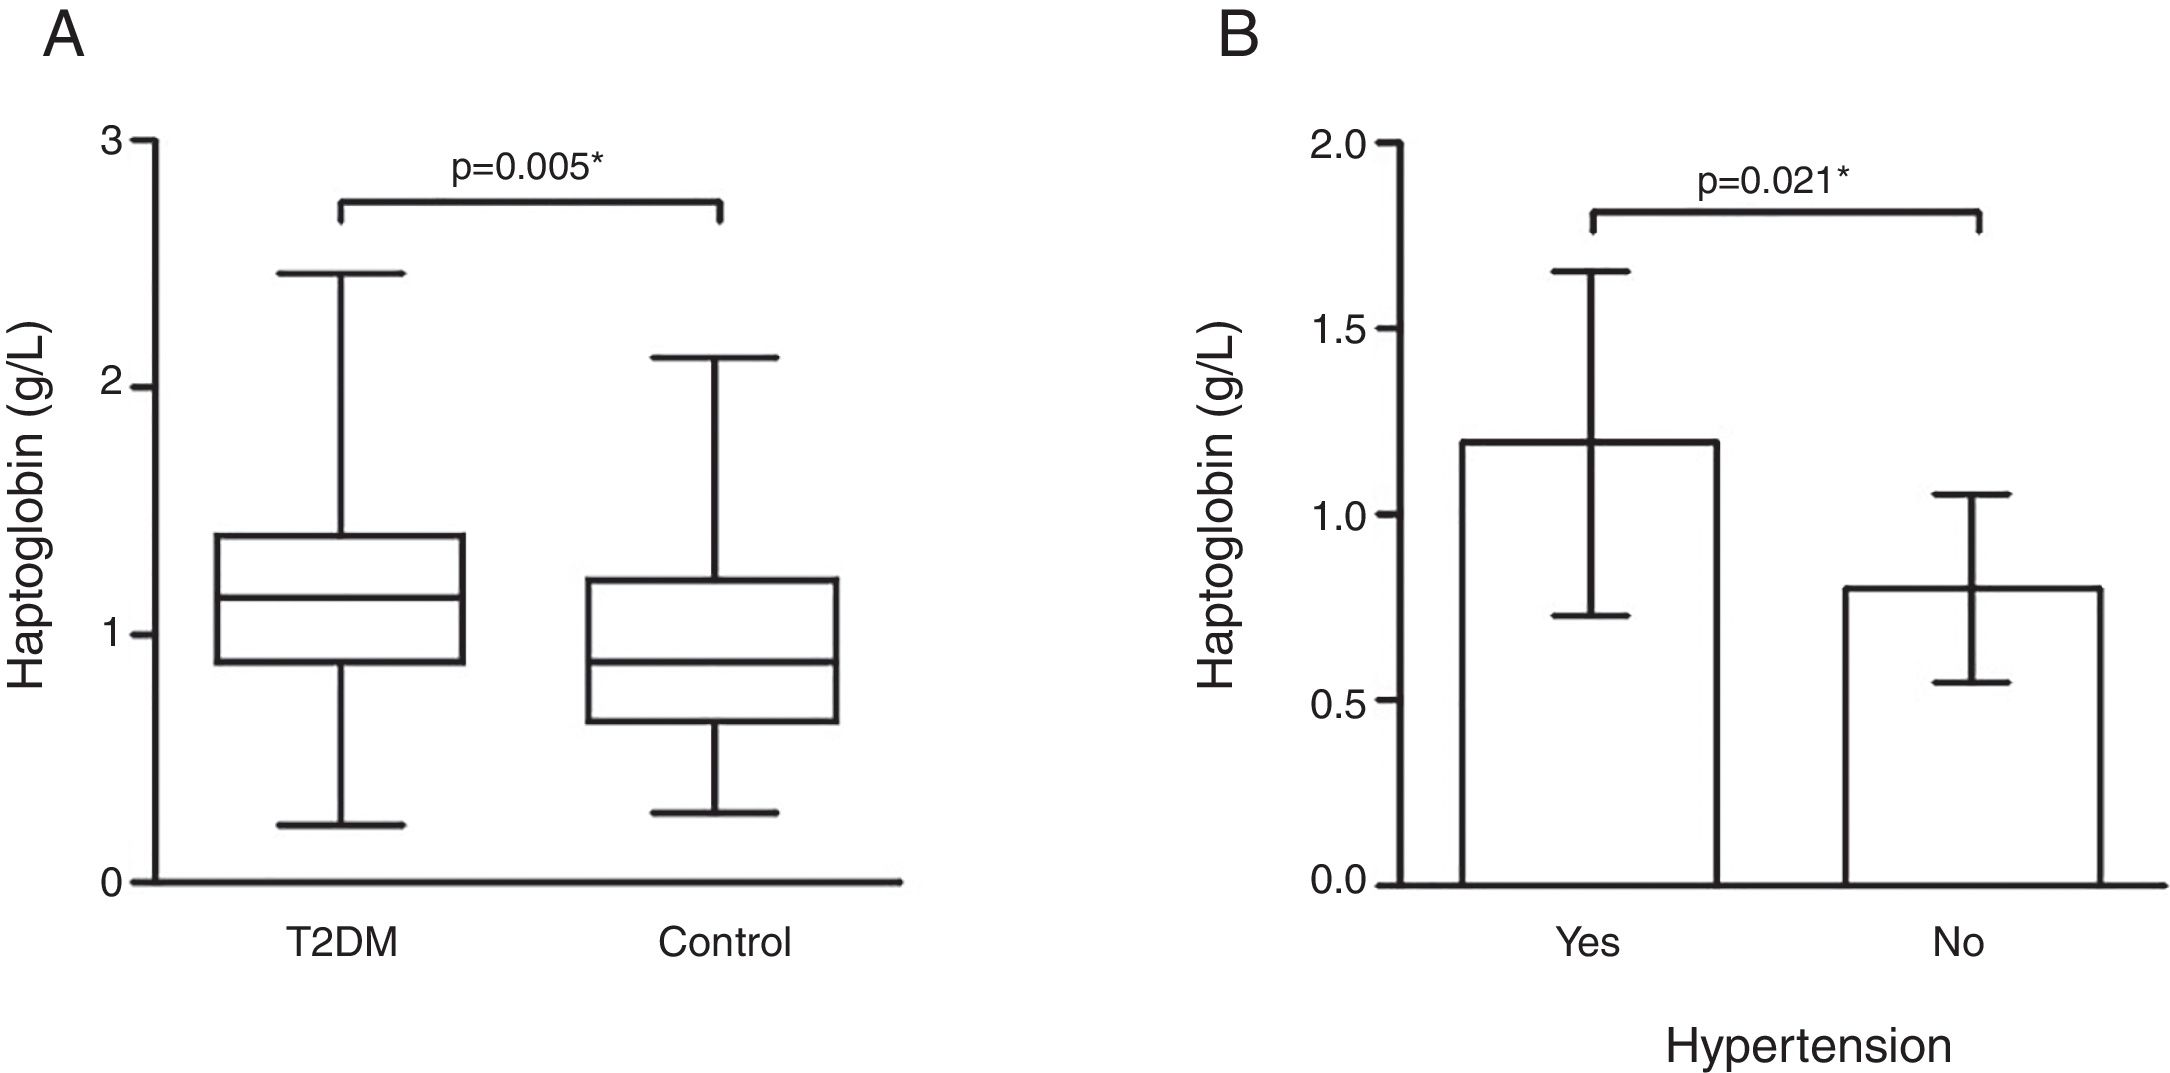
Hp plasma levels were higher in the T2DM group [1.15 (0.52)g/L] than controls [0.88 (0.58)g/L] (p=0.005 – Fig. 1). Interestingly, T2DM patients with hypertension (n=94) showed higher Hp levels [1.19±0.46g/L] when compared to those patients without hypertension (n=8) [0.80±0.26g/L] (p=0.021 – Fig. 1).
, and only in T2DM group considering presence/absence of arterial hypertension (B). (A) Mann–Whitney test; (B) Student's t test; *p<0.05 was considered statistically significant.")
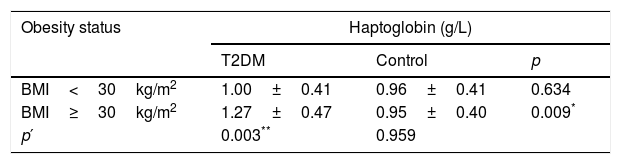
Analyses of Hp levels were performed considering obesity status: BMI<30kg/m2 (non-obese) and BMI≥30kg/m2 (obese). Obese T2DM patients had higher Hp levels when compared with obese controls (p=0.009) and non-obese T2DM patients (p=0.003 – Table 2). Hp levels no exhibited differences when compared case and control groups considering BMI<30kg/m2 (p=0.634). The control group also showed no difference among Hp levels and BMI categories (p=0.959).
Haptoglobin levels in T2DM and control groups according to obesity status.
| Obesity status | Haptoglobin (g/L) | ||
|---|---|---|---|
| T2DM | Control | p | |
| BMI<30kg/m2 | 1.00±0.41 | 0.96±0.41 | 0.634 |
| BMI≥30kg/m2 | 1.27±0.47 | 0.95±0.40 | 0.009* |
| p′ | 0.003** | 0.959 | |
T2DM (type 2 diabetes mellitus) and BMI (body mass index).
Student's t-test.
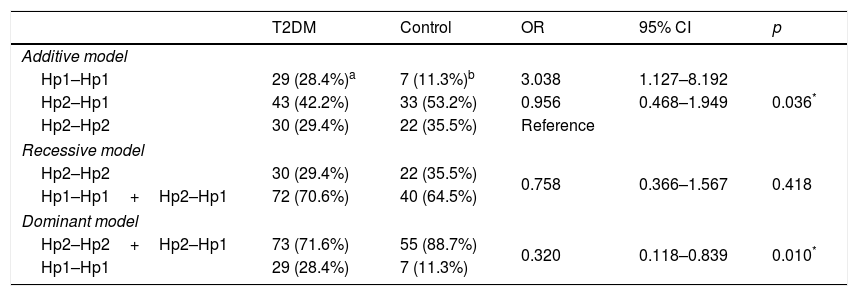
We performed the association analysis of the Hp gene polymorphism with T2DM comparing to control group (Table 3). The polymorphism is in Hardy–Weinberg equilibrium (p>0.025) for either group. The genotypic frequencies were different between cases and controls subjects (p=0.036), and residual analyses revealed that the Hp1–Hp1 genotype was more frequent in T2DM patients when compared to non-diabetic controls. The frequencies of Hp1 allele (T2DM: 0.49; control: 0.38) and Hp2 allele (T2DM: 0.51; control: 0.62) were different between the groups (OR=1.606; 95% CI 0.994–2.599; p=0.041). The dominant model for inheritance (Hp2–Hp2+Hp2–Hp1 vs. Hp1–Hp1) showed a significant association (OR=0.320; 95% CI 0.118–0.839; p=0.010) with T2DM, which was not observed in the recessive model (p=0.418).
Analysis of haptoglobin gene polymorphism in different inheritance models in T2DM and control individuals.
| T2DM | Control | OR | 95% CI | p | |
|---|---|---|---|---|---|
| Additive model | |||||
| Hp1–Hp1 | 29 (28.4%)a | 7 (11.3%)b | 3.038 | 1.127–8.192 | 0.036* |
| Hp2–Hp1 | 43 (42.2%) | 33 (53.2%) | 0.956 | 0.468–1.949 | |
| Hp2–Hp2 | 30 (29.4%) | 22 (35.5%) | Reference | ||
| Recessive model | |||||
| Hp2–Hp2 | 30 (29.4%) | 22 (35.5%) | 0.758 | 0.366–1.567 | 0.418 |
| Hp1–Hp1+Hp2–Hp1 | 72 (70.6%) | 40 (64.5%) | |||
| Dominant model | |||||
| Hp2–Hp2+Hp2–Hp1 | 73 (71.6%) | 55 (88.7%) | 0.320 | 0.118–0.839 | 0.010* |
| Hp1–Hp1 | 29 (28.4%) | 7 (11.3%) | |||
T2DM (type 2 diabetes mellitus).
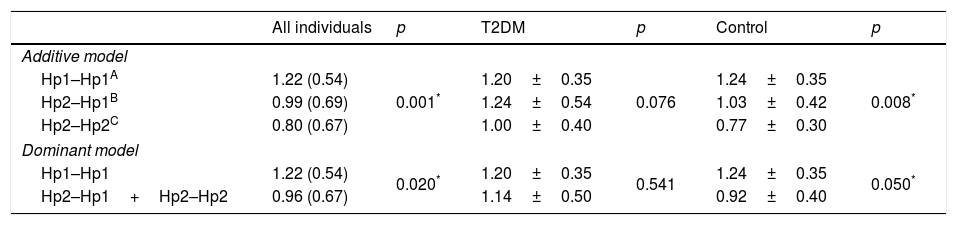
In order to evaluate if the Hp gene polymorphism could modulate the circulating levels of the protein, the Hp levels were compared in accordance to their genotypes for both groups and separately (T2DM or control) (Table 4). The analysis revealed that in the additive and dominant models, the Hp levels are lower in Hp2 allele carrier, considering all the participants (p=0.001; p=0.020, respectively) and only control subjects (p=0.008; p=0.035, respectively). T2DM patients did not show differences in Hp levels between the genotypes (all p>0.05).
Haptoglobin plasma levels according to their genotypes.
| All individuals | p | T2DM | p | Control | p | |
|---|---|---|---|---|---|---|
| Additive model | ||||||
| Hp1–Hp1A | 1.22 (0.54) | 0.001* | 1.20±0.35 | 0.076 | 1.24±0.35 | 0.008* |
| Hp2–Hp1B | 0.99 (0.69) | 1.24±0.54 | 1.03±0.42 | |||
| Hp2–Hp2C | 0.80 (0.67) | 1.00±0.40 | 0.77±0.30 | |||
| Dominant model | ||||||
| Hp1–Hp1 | 1.22 (0.54) | 0.020* | 1.20±0.35 | 0.541 | 1.24±0.35 | 0.050* |
| Hp2–Hp1+Hp2–Hp2 | 0.96 (0.67) | 1.14±0.50 | 0.92±0.40 | |||
T2DM (type 2 diabetes mellitus).
p<0.05 was considered statistically significant.
Additive model (all individuals) – Mann–Whitney test with Bonferroni's correction (p<0.017 was considered statistically significant):
A×B: p=0.288.
A×C: p<0.0001*.
B×C: p=0.007*.
Additive model (Control) – ANOVA with LSD post hoc test.
A×B: p=0.182.
A×C: p=0.006*.
B×C: p=0.016*.
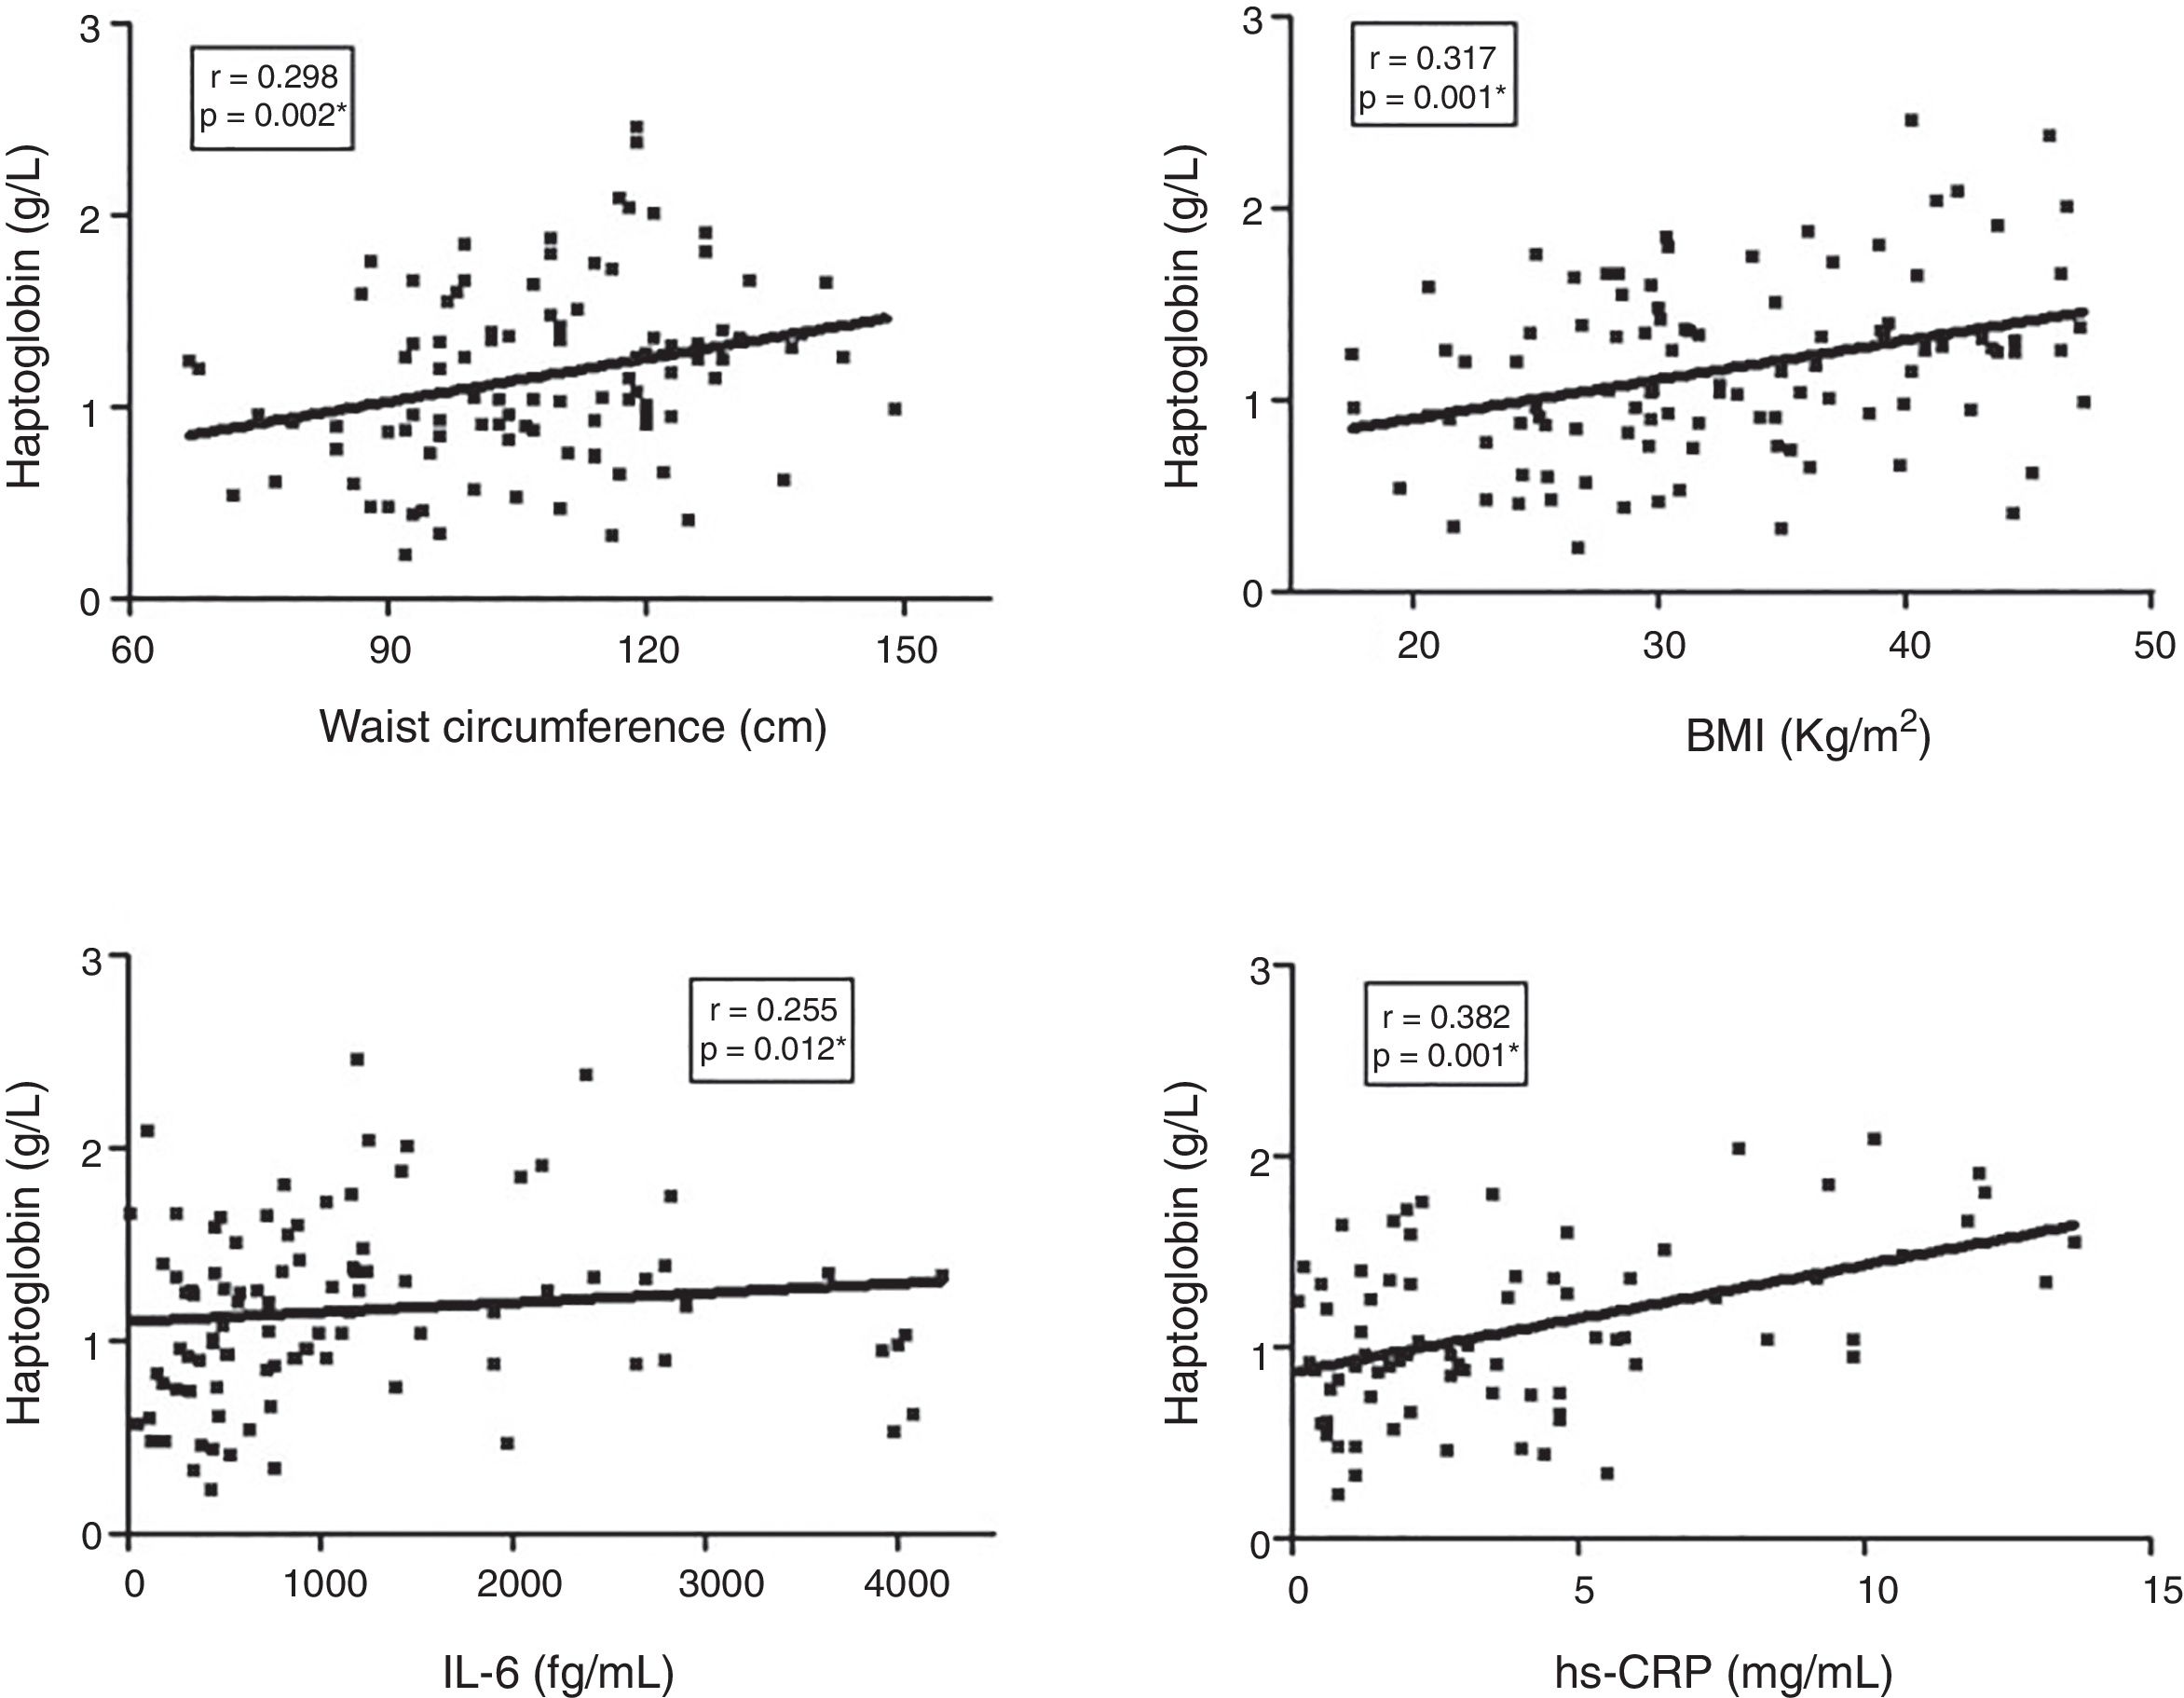
Finally, the correlation between Hp plasma levels and clinical/laboratory parameters in the T2DM group was investigated (Fig. 2). Hp levels showed a significant positive correlation with waist circumference (r=0.298, p=0.002), BMI (r=0.317, p=0.001), IL-6 (r=0.255, p=0.012), and hs-CRP (r=0.382, p=0.001).
Discussion, IL (interleukin), hs-CRP (high sensitivity C reactive protein). Spearman's correlation test; *p<0.05 was considered statistically significant.")
This study evaluated the association between Hp levels, Hp1–Hp2 polymorphism, and clinical/laboratory parameters in T2DM patients. The data demonstrated that T2DM is associated with higher Hp levels in obese individuals, which are influenced by inflammation and hypertension. Besides, we observed Hp levels are modulated by Hp1–Hp2 polymorphism when considered T2DM and control groups.
Clinical and laboratory characteristics of T2DM patients and controls showed that T2DM patients have higher waist circumference and waist-hip ratio. These findings reinforce the knowledge that not only obesity, but mainly upper body obesity, influence negatively glucose metabolism and are independent risk factors to T2DM development.33 In addition, T2DM patients also exhibited higher IL-6 levels when compared with controls. Higher levels of proinflammatory cytokines (e.g. IL-6, IL-1β, TNF-α) have been also found in T2DM patients in other studies34–36 showing that the etiopathogenesis of this disease is closely related with activation of inflammatory mechanisms.
The diabetic group exhibited higher Hp levels than controls. Analysis of Hp levels considering obesity status indicated that obese T2DM patients have higher Hp levels than non-obese T2DM patients and obese controls. Additionally, Hp levels in T2DM group were positively correlated with waist circumference, BMI, IL-6, and hs-CRP. Taken together these results emphasize that increased Hp levels are associated with obesity and inflammation in T2DM group. In agreement, Van Campenhout et al.20 in a case-control study with T2DM patients from Belgium found higher Hp levels in patients than controls, and positive correlation between these levels and CRP. This study indicated that higher Hp levels in diabetes mellitus are a condition associated with disturbances in iron metabolism and inflammatory status contributing for increase in oxidative stress parameters. More recently, Mohieldein et al.21 also found higher Hp levels in T2DM patients from Saudi Arabia compared to control subjects. Moreover, the increase in Hp levels was dependent to BMI: obese (BMI≥30kg/m2) and overweight (BMI 25–29.9kg/m2) T2DM patients showed higher Hp levels than lean patients (BMI<25kg/m2).
IL-6 is widely produced by subcutaneous and intra-abdominal adipose tissue.13 In turn, it stimulates the liver synthesis of Hp,37 and further Hp is produced by adipocytes.10 Chiellini et al.38 demonstrated that Hp gene is upregulated in white adipose tissue of the obese db/db mice compared to their lean littermates and that pro-inflammatory cytokines are important signal for this regulation. Moreover, serum Hp levels were considered a marker of obesity in humans, and BMI and CRP independent determinants of this serum levels in females.39
The diabetic state is associated with decreased antioxidant defences and disturbances in iron metabolism.20 Hp antioxidant function is impaired by the glycosylated fraction of Hb (GlyHb), because even after GlyHb-Hp complex formation, the GlyHb can continue to oxidatively modify proteins within the vessel wall increasing endothelial injury.40 Besides, GlyHb seems to release free iron (redox-active form – Fe2+) more readily than nonglycosylated Hb.41 Iron in oxidation state 2+ is one of the most reactive pro-oxidants because it catalyses the generation of the highly reactive hydroxyl radicals that are able to initiate and propagate the lipid peroxidation, glycoxidation, and DNA damage.42
T2DM patients with arterial hypertension showed higher Hp levels when compared with patients without this comorbidity. It is known that diabetes mellitus is associated with cell-free Hb release due to endothelial injury. The cell-free Hb acts as a potent scavenger of NO (nitric oxide), through a high-speed deoxygenation reaction, inducing vasoconstriction and oxidative tissue damages.43 NO is produced by the endothelium and is a central modulator of vascular tone, inhibits platelet aggregation and leukocytes adhesion, and exerts antioxidant and anti-inflammatory effects.18 The increase of Hp levels observed in the hypertension could be related to compensatory mechanism in order to bind the cell-free Hb, reducing the NO scavenging and maintaining the normal blood pressure. Boretti et al.44 showed in animal models (dogs and guinea) as compartmentalization of Hb and its interaction with Hp (Hp–Hb complex) could help to regulate the blood pressure. Some studies have indicated that Hp1–Hp2 polymorphism can modulate NO bioavailability, since individuals with Hp2–Hp2 genotype and preeclampsia45 or T2DM46 exhibited lower plasma nitrite concentrations when compared with individuals with others genotypes.
We found that Hp1–Hp1 genotype was more frequent in T2DM than controls and followed a dominant inheritance model, although the Hp2 allele was more frequent in both groups. Stern et al.22 found that Hp1–Hp1 genotype is associated with T2DM (Mexicans-americans). However, some studies have found association between Hp2–Hp2 genotype and T2DM.23–28 Hp1–Hp1 protein has ability to bind more Hb than other phenotypes, with more efficiency in promoting the uptake of the Hp–Hb complex by the CD163 receptor, which is cleared from the circulation faster than Hp2–Hp2 protein.47 Moreover, Hp2–Hp2 phenotype is associated with increased cardiovascular risk in T2DM patients.39,48 Consequently, this result was not expected, but shows the genetic characteristic of Brazilian population, which is the result of European, African, and Amerindian miscegenation.
The more elevated Hp levels in controls were observed in Hp1–Hp1 when compared to Hp2 carriers, in accordance with Kasvosve et al.49 However, in T2DM it seems that Hp2–Hp2 genotype contributes to elevated levels of the Hp protein, similarly to Hp1–Hp1 carriers. Since the Hp expressed by Hp2 allele presents lower ability to bind the Hb and the Hp–Hb complex to the CD163 receptor, this condition could compromise the Hp functions in T2DM. Therefore, these results suggest that, although T2DM presents higher Hp levels (possibly due to inflammatory status), most of their function is ineffective.
Some limitations of this work and contradictory results compared to other studies are known, as small sample size, which is justified by the strict selection criteria for patients and controls, different techniques used for phenotype/genotype Hp individuals, or different genetic background of the populations studied. However, its data present new and clinically important information about the Hp profile in T2DM and other studies should be conducted in order to expand the comprehension about Hp’ role and T2DM in other populations.
ConclusionConsidering the epidemic number of T2DM patients in the word, including Brazil, improved knowledge about inflammatory markers associated with diabetes mellitus can contribute to ameliorate the clinical follow-up.
Our results suggest that higher Hp levels are associated with T2DM and are influenced by BMI, inflammatory status and hypertension. Higher frequency of Hp1 homozygous was observed in T2DM patients, however Hp2 allele contributes with higher protein levels, which could compromise the function of Hp in this group.
Conflict of interestThe authors declare that they have no conflict of interest.
The authors thank FAPEMIG, CAPES, and CNPq/Brazil for financial support. VCS and KBG are grateful to CNPq Research Fellowship.