


CB2R receptors has been referred to as the peripheral cannabinoid receptor isoform, and regulate inflammatory response in various settings. CB2R gene variants could play a role on metabolic changes after weight loss with different interventions.
ObjectiveTo assess the effect of the genetic variant (rs3123554) of the CB2R gene on anthropometric and biochemical changes after weight loss secondary to a high protein/low carbohydrate diet vs. a standard low-calorie diet during 9 months.
Design268 obese subjects were randomly allocated to one of two diets for 9 months, Diet HP (high protein-low carbohydrate low-calorie diet) and Diet S (standard protein low-calorie diet). Biochemical and anthropometric parameters were measured at baseline and at 3 and 9 months.
ResultsNinety-four patients (35.1%) had genotype GG and 174 (64.9%) subjects had the following genotypes; GA (115 patients, 42.9%) or AA (59 study subjects, 18.0%) (second group). After both diets, body mass index (BMI), fat mass, weight, waist circumference, and systolic blood pressure improved in both genotypes with no difference between diets. Before and after both low-calorie diets, body weight, BMI, fat mass, and waist circumference were higher in A allele carriers than in non-A allele carriers. After both diets (HP and S), levels of glucose, insulin, HOMA-IR, triglycerides, total cholesterol, and LDL cholesterol decreased in non-A allele carriers. These parameters remained unchanged in A allele carriers. Leptin levels decreased after HP and S diets in both genotypes.
ConclusionNon-A allele carriers showed a better response of total cholesterol, LDL cholesterol, triglycerides, glucose, HOMA-IR, and insulin levels than allele A carriers with both low-calorie diets and with the same weight loss.
Los receptores CB2R han sido etiquetados como los receptores endocanabinoides periféricos por excelencia, y regulan diferentes procesos inflamatorios. Las variantes del gen CB2R podrían desempeñar un papel en los cambios metabólicos después de la pérdida de peso con diferentes intervenciones.
ObjetivoEvaluar el efecto de la variante genética (rs3123554) del gen CB2R en los cambios antropométricos y bioquímicos después de la pérdida de peso, secundaria a una dieta hipocalórica alta proteína/baja en hidratos de carbono vs. una dieta hipocalórica estándar durante 9 meses.
DiseñoDoscientos sesenta y ocho sujetos obesos fueron asignados al azar a una de 2 dietas durante 9 meses, dieta HP (dieta hipocalórica alta en proteínas y baja en hidratos de carbono) y dieta S (dieta hipocalórica estándar en proteínas). Se evaluaron parámetros bioquímicos y antropométricos al basal, a los 3 y a los 9 meses.
ResultadosUn total de 94 pacientes (35,1%) tenían el genotipo GG y 174 (64,9%) sujetos tenían los genotipos siguientes; GA (115 pacientes, 42,9%) o AA (59 sujetos de estudio, 18,0%) (segundo grupo). Después de ambas dietas y en ambos genotipos, el índice de masa corporal (IMC), la masa grasa, el peso, la circunferencia de la cintura y la presión arterial sistólica mejoraron sin diferencias entre ambas dietas. Antes y después de ambas dietas hipocalóricas, el peso corporal, el IMC, la masa grasa y la circunferencia de la cintura fueron mayores en los portadores del alelo A. Después de ambas dietas (HP y S), la glucosa, los niveles de insulina, HOMA-IR, los triglicéridos, el colesterol total y el colesterol-LDL disminuyeron en portadores de alelos no A. Estos parámetros se mantuvieron sin cambios en los portadores de alelos A. Los niveles de leptina disminuyeron después de las dietas HP y S en ambos genotipos.
ConclusiónLos no portadores del alelo A mostraron una mejor respuesta del colesterol total, colesterol LDL, triglicéridos, glucosa, HOMA-IR y niveles de insulina que los portadores A con ambas dietas hipocalóricas y con la misma pérdida de peso.
The incidence of obesity is increasing dramatically worldwide. In recent years, the epidemiological evidence of this change in obesity rates and associated diseases such as diabetes mellitus, arterial hypertension and dyslipidemia has led to a considerable increase in research on adipose tissue as an active participant in this scenario.1 Obesity is associated with low-grade systemic inflammation, and adipose tissue has been regarded as an active secretory organ, emitting and responding to signals that modulate insulin sensitivity, lipid metabolism and inflammation. This dramatic increase in obesity is attributable to both environmental and genetic factors.2 Excessive calorie intake and reduced physical activity may be cited as the main environmental factors. With regard to genetic factors, single nucleotide polymorphisms (SNPs) in genes implicated in different pathways have been associated with obesity. Some of the pathways affected by these SNPs involve receptors corresponding to different metabolic systems, such as cannabinoid receptors (CBRs), or melanocortin receptor subtype 4 (Mc4R).3
The cannabinoid receptor system consists of two receptors, CB1R and CB2R, that belong to the family of G protein-coupled receptors, and bind to exogenous ligands derived from Cannabis sativa and endogenous endocannabinoids. The CB1R receptor is primarily found in the brain: its role in eating behavior is well established, and it has been used as a therapeutic target in the management of obesity.4 By contrast, the CB2R receptor has been classified as the isoform corresponding to the peripheral cannabinoid receptor, expressed mainly in peripheral tissues, such as immune system cells, and it regulates the inflammatory response in different environments.5 In this regard, rs3123554 is a common SNP of the CB2R gene. Ketterer et al.6 have shown that carriers of the minor allele (A) of this genetic variant have lower body weight, accompanied by a decrease in body weight loss during lifestyle interventions. The role of this polymorphism has also been evaluated in two short three-month interventional studies.7,8 The interaction of two low-calorie diets (moderate in carbohydrates versus normal carbohydrate composition) with the rs3123554 polymorphism of the CB2R gene has been investigated in a randomized clinical trial. In that study, carriers of the A allele lost less body weight during both low-calorie diets. Improvement of the biochemical parameters was less pronounced in A allele carriers than in non-carriers. In another study,8 non-carriers of the A allele showed greater improvements in body weight, fat mass, insulin resistance and lipid profile than carriers of the A allele after following a low-calorie Mediterranean diet for three months.
The present study was carried out to explore the effect of the genetic variant (rs3123554) of the CB2R gene upon anthropometric and biochemical changes after weight loss secondary to a high protein/low carbohydrate diet versus a standard severe low-calorie diet over a period of 9 months.
Patients and methodsPatients and experimental designA prospective analysis was made of 268 obese Caucasian individuals. Written informed consent was obtained from all the patients. Subject recruitment was based on consecutive sampling among patients referred by primary care physicians. This study was conducted in abidance with the principles of the Declaration of Helsinki. All the participants signed the informed consent document approved by the clinical trials committee of our center. The exclusion criteria included dieting during the 12 months prior to the study, the presence of unstable cardiovascular or cerebrovascular disease, insufficient patient motivation, and the use of any of the following drugs: metformin, dipeptidyl peptidase type IV (DPP-4) inhibitors, thiazolidinedione, GLP-1 analogs, sGLT2 inhibitors, insulin, glucocorticoids, angiotensin receptor blockers, angiotensin converting enzyme inhibitors (ACEIs), psychoactive drugs, statins and other lipid-lowering drugs. The inclusion criteria were: a body mass index (BMI) > 30 kg/m2 and a patient age of > 25 and < 65 years.
ProcedureVenous blood samples (10 mL) were collected into EDTA-treated tubes after a rapid period of 10 h. We determined basal fasting glucose, total cholesterol, C-reactive protein (CRP), insulin, insulin resistance (HOMA-IR), LDL-cholesterol, HDL-cholesterol, plasma triglycerides and adipocytokines (leptin, resistin, adiponectin) at the start of the study and after three and 9 months of both dietary interventions. Body weight, height and blood pressure were measured at the same timepoints as the biochemical parameters. Tetrapolar impedance was used to measure fat mass. We also determined the genotype of the CB2R receptor gene polymorphism.
Dietary interventionA total of 238 obese patients were randomized to one of the two diets. The HP diet (n = 136) (severe low-calorie diet, high in protein and low in carbohydrates) supplied 1050 cal/day, 33% fat (39.0 g/day), 33% carbohydrates (86.1 g/day) and 34% protein (88.6 g/day). The fat distribution was as follows: 63.8% monounsaturated fats, 23.5% saturated fats, and 12.6% polyunsaturated fats. The S diet (n = 132) (severe low-calorie diet, standard protein) supplied 1093 cal/day, 27% fat (32.6 g/day), 53% carbohydrates (144.3 g/day) and 20% protein (55.6 g/day). The fat distribution was as follows: 67.4 % monounsaturated fats, 20.9 % saturated fats, and 11.6 % polyunsaturated fats. The exercise recommendations were to perform aerobic physical activities at least three times a week (60 min each session). Adherence to the diets was recorded every 7 days through a phone call, in order to improve both diets. Spanish national food tables were used as reference.9
Anthropometric variables and blood pressureBody weight was measured to the nearest 0.1 kg, and the BMI was calculated as body weight (in kilograms)/height2 (in meters). The waist circumference was measured at the narrowest diameter between the xiphoid process and the iliac crest. Electrical impedance was used to determine body composition10 (Biodynamics Model 310e, Seattle, WA, USA). Blood pressure was measured twice after a 10 min rest using a mercury sphygmomanometer (Omron, Los Angeles, CA, USA), and the mean value was calculated.
Laboratory measurementsInsulin was measured by radioimmunoassay (RIA Diagnostic Corporation, Los Angeles, CA, USA) with a sensitivity of 0.5 mIU/l (normal range: 0.5−30 mIU/l),11 and the plasma glucose levels were measured using an automated glucose oxidase system. The Beckman Glucose analyzer-II (Beckman Instruments, Fullerton, CA, USA) value and the evaluation of the homeostasis model assessment of insulin resistance (HOMA-IR) were calculated using these values.12 The serum concentrations of total cholesterol and triglycerides were measured using an enzymatic colorimetric assay (Technicon Instruments, Ltd., New York, NY, USA). In turn, HDL-cholesterol was measured enzymatically in the supernatant after the precipitation of other lipoproteins with dextran sulfate - magnesium chloride. Specifically, dextran sulfate - magnesium chloride was used at a concentration of 20 g/l in a final volume of 0.025 mL with dilutions 1: 1.1. Finally, LDL-cholesterol was calculated using the Friedewald formula (LDL-cholesterol = total cholesterol – HDL-cholesterol – triglycerides/5).13
Adiponectin was measured using an enzymoimmunoassay (ELISA) (R&D Systems, Inc., Minneapolis, MN, USA) (DRP300) with a CV% of 3.8%.14 Leptin was measured by enzyme-linked immunoassay (ELISA) (Diagnostic Systems Laboratories, Inc., TX, USA) with a CV% of 3.5%.15 Resistin was measured by ELISA (Biovendor Laboratory, Inc., Brno, Czech Republic), with a CV% of 3.2%.16
Genotype of the CB2R geneBlood cells were used to extract DNA. Primers and oligonucleotide probes were designed with Beacon Designer 5.0 (Premier Biosoft International®, Los Angeles, CA, USA). A polymerase chain reaction (PCR) was performed on 50 ng of genomic DNA and 0.5 µL of each oligonucleotide primer (forward primer: 5′- ACGTTGATGATTGTACCGAGGAGGGAACT-3′and reverse 5′- ACGTTGGATGGAGACACGTATTCTAGTCCC-3′) in a final volume of 2 µL (Thermocycler Life Technologies, Los Angeles, CA, USA). The DNA was denatured at 95 °C for three minutes, followed by 45 denaturation cycles at 95 °C during 15 s, and reheating at 59.3 °C for 45 s. The PCRs were performed in a final volume of 25 µL containing 12.5 µL of IQTM Supermix (Bio-Rad®, Hercules, CA, USA) with Taq DNA polymerase. The Hardy-Weinberg equilibrium was calculated using a statistical test (chi-square test). The variant was in Hardy-Weinberg equilibrium (p = 0.33).
Statistical analysisThe sample size was calculated to detect differences of more than 4 kg in body weight loss with a statistical power of 90% and a 5% significance level (n = 130 in each diet group). Data distribution was assessed with the Kolmogorov-Smirnov test. Quantitative variables exhibiting a normal distribution were analyzed using a two-tailed Student t-test. The chi-square test was used to assess the Hardy-Weinberg equilibrium. Nonparametric variables were analyzed using the Wilcoxon test. A mixed within- and between-subject model was used to test interaction between the polymorphism groups and variables, due to the study design with repeated measures. Qualitative variables were analyzed using the chi-square test, with Yates correction where required, and the Fisher exact test. Statistical significance was considered for p < 0.05.
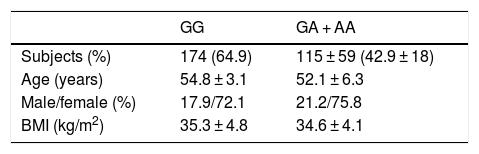
ResultsA total of 94 patients (35.1%) presented the GG genotype and 174 (64.9%) exhibited the following genotypes: GA (115 patients, 42.9%) or AA (59 patients, 18.0%) (second group). The mean age of the global group (n = 268) was 53.9 ± 9.1 years. The gender distribution in all the groups was 26.1% males and 73.9% females. The mean BMI was 35.1 ± 4.5 kg/m2. There were no statistically significant differences in these parameters between the two genotype groups (Table 1). Age was similar in both genotype groups (wild type GG versus mutated type [GA + AA]) (54.8 ± 7.1 versus 52.3 ± 6.1 years; p = ns). The gender distribution was similar in both genotypes: males (27.9% vs. 24.2%; p = ns) and females (72.1% vs. 75.8%; p = ns). The mean BMI was higher in carriers of the A allele (35.3 ± 4.8 vs. 34.6 ± 4.1 kg/m2; p = 0.02). All the patients completed the 9-month follow-up period, with no dropouts.
Basal determination of food intake was made using a three-day written food record. The 136 subjects (45 genotype GG and 91 A allele carriers) assigned to the HP diet yielded the following data: basal calorie intake 2078.8 ± 431.1 kcal/day, fat intake 91.2 ± 21.3 g/day (41.0% of total calories), carbohydrate intake 212.32 ± 36.3 g/day (40.9% of total calories), and protein intake 80.1 ± 53.5 g/day (27.1% of total calories). During the study intervention (9 months), these patients reached the diet recommendations: 1010.5 ± 90.2 calories (34.1% carbohydrates, 32.7% lipids and 36.2% protein). Physical activity was similar in both genotype groups (70.1 ± 30.2 vs. 69.8 ± 39.3 min/week; p = 0.43).
The basal assessment of food intake with the three-day written food record in the 132 subjects (49 genotype GG and 93 A allele carriers) randomized to the S diet yielded the following data: basal calorie intake 2016.1 ± 392.9 kcal/day, fat intake 91.2 ± 18.3 g/day (38.3% of total calories), carbohydrate intake 210.3 ± 28.1 g/day (42.8% of total calories), and protein intake 90.1 ± 10.3 g/day (19.9% of total calories). During the study, these patients reached the diet recommendations; 1001.4 ± 92.1 calories (51.6% carbohydrates, 29.5% lipids, and 18.9% protein). Lastly, physical activity was similar in both genotypes (69.1 ± 40.1 vs. 68.5 ± 30.3 min/week; p = 0.43).
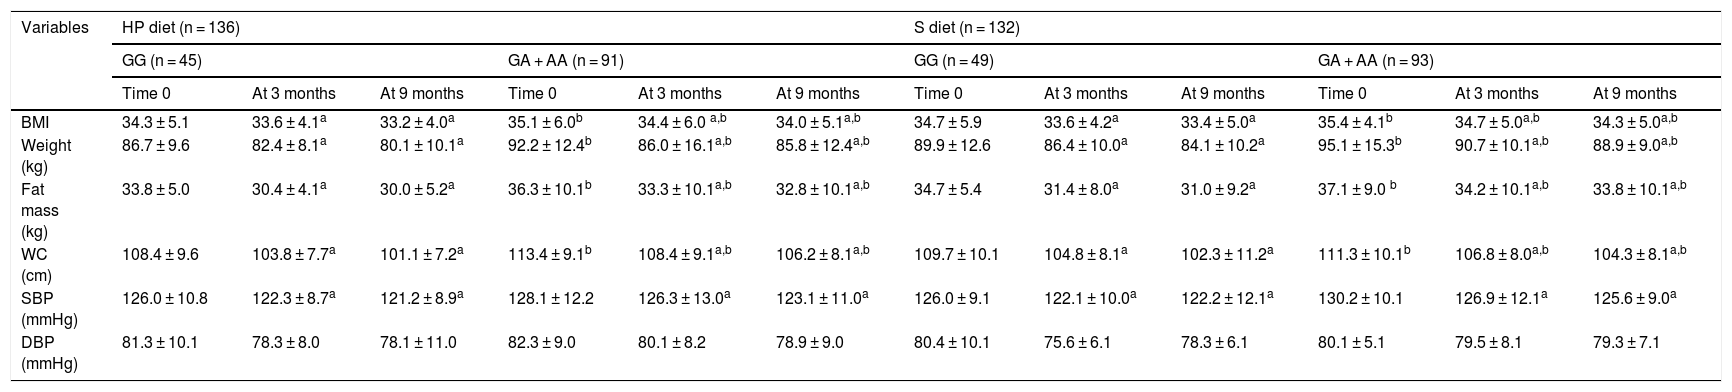
The anthropometric parameters and blood pressure levels of the obese participants at the start of the study and after three and 9 months are reported in Table 1. In both genotypes and with both dietary interventions, the following variables were found to decrease: body weight, the BMI, fat mass, waist circumference and systolic blood pressure. Before and after both low-calorie diets, body weight, the BMI, fat mass, and waist circumference were higher in carriers of the A allele than in non-carriers of the allele. Table 2 shows that following a high-protein / low carbohydrate dietary intervention (HP diet), the subjects with both genotypes (GG vs. GA + AA) showed a similar decrease in body weight (−6.5 ± 2.2 vs. − 6.4 ± 2.1 kg; p = 0.12), BMI (−1.1 ± 0.2 vs. − 1,1 ± 0.5 kg/m2; p = 0.23), fat mass (−3.8 ± 0.9 vs. − 3.5 ± 0.8 kg; p = 0.33), waist circumference (−7.3 ± 1.2 vs. − 7.2 ± 1.9 cm; p = 0.41) and systolic blood pressure (−5.2 ± 3.0 vs. − 5.1 ± 2.4 mmHg; p = 0.45). After a dietary intervention with a standard low-calorie diet (S diet), the subjects with both genotypes (GG vs. GA + AA) showed a similar decrease in body weight (−5.8 ± 2.1 vs. − 6.2 ± 2.3 kg; p = 0.22), the BMI (−1.3 ± 0.4 vs. − 1.1 ± 0.2 kg/m2; p = 0.34), fat mass (−3.7 ± 0.8 vs. − 3.5 ± 0.9 kg; p = 0.46), waist circumference (−7.6 ± 1.4 vs. − 7.0 ± 2.1 cm; p = 0.53) and systolic blood pressure (−4.0 ± 3.1 vs. − 4.6 ± 2.4 mmHg; p = 0.47).
Change in anthropometric parameters (mean ± SD).
| Variables | HP diet (n = 136) | S diet (n = 132) | ||||||||||
|---|---|---|---|---|---|---|---|---|---|---|---|---|
| GG (n = 45) | GA + AA (n = 91) | GG (n = 49) | GA + AA (n = 93) | |||||||||
| Time 0 | At 3 months | At 9 months | Time 0 | At 3 months | At 9 months | Time 0 | At 3 months | At 9 months | Time 0 | At 3 months | At 9 months | |
| BMI | 34.3 ± 5.1 | 33.6 ± 4.1a | 33.2 ± 4.0a | 35.1 ± 6.0b | 34.4 ± 6.0 a,b | 34.0 ± 5.1a,b | 34.7 ± 5.9 | 33.6 ± 4.2a | 33.4 ± 5.0a | 35.4 ± 4.1b | 34.7 ± 5.0a,b | 34.3 ± 5.0a,b |
| Weight (kg) | 86.7 ± 9.6 | 82.4 ± 8.1a | 80.1 ± 10.1a | 92.2 ± 12.4b | 86.0 ± 16.1a,b | 85.8 ± 12.4a,b | 89.9 ± 12.6 | 86.4 ± 10.0a | 84.1 ± 10.2a | 95.1 ± 15.3b | 90.7 ± 10.1a,b | 88.9 ± 9.0a,b |
| Fat mass (kg) | 33.8 ± 5.0 | 30.4 ± 4.1a | 30.0 ± 5.2a | 36.3 ± 10.1b | 33.3 ± 10.1a,b | 32.8 ± 10.1a,b | 34.7 ± 5.4 | 31.4 ± 8.0a | 31.0 ± 9.2a | 37.1 ± 9.0 b | 34.2 ± 10.1a,b | 33.8 ± 10.1a,b |
| WC (cm) | 108.4 ± 9.6 | 103.8 ± 7.7a | 101.1 ± 7.2a | 113.4 ± 9.1b | 108.4 ± 9.1a,b | 106.2 ± 8.1a,b | 109.7 ± 10.1 | 104.8 ± 8.1a | 102.3 ± 11.2a | 111.3 ± 10.1b | 106.8 ± 8.0a,b | 104.3 ± 8.1a,b |
| SBP (mmHg) | 126.0 ± 10.8 | 122.3 ± 8.7a | 121.2 ± 8.9a | 128.1 ± 12.2 | 126.3 ± 13.0a | 123.1 ± 11.0a | 126.0 ± 9.1 | 122.1 ± 10.0a | 122.2 ± 12.1a | 130.2 ± 10.1 | 126.9 ± 12.1a | 125.6 ± 9.0a |
| DBP (mmHg) | 81.3 ± 10.1 | 78.3 ± 8.0 | 78.1 ± 11.0 | 82.3 ± 9.0 | 80.1 ± 8.2 | 78.9 ± 9.0 | 80.4 ± 10.1 | 75.6 ± 6.1 | 78.3 ± 6.1 | 80.1 ± 5.1 | 79.5 ± 8.1 | 79.3 ± 7.1 |
WC: waist circumference; SD: standard deviation; HP diet: high-protein, low-carbohydrate low-calorie diet; S diet: standard low-calorie protein diet; BMI: body mass index; DBP: diastolic blood pressure; SBP: systolic blood pressure.
No differences were observed regarding the basal and post-treatment values of the metabolic parameters between the two genotypes (Table 3). After the dietary intervention with both diets, non-carriers of the A allele showed a significant decrease in total cholesterol, LDL-cholesterol, triglycerides, insulin, and HOMA-IR. In the non-carriers of the A allele, after both diets, the decrease in total cholesterol was greater than in the carriers of the A allele, with values of −14.1 ± 2.9 mg/dl (versus carriers of the A allele −1.2 ± 1.1 mg/dl; p = 0.02 after the HP diet) and −12.5 ± 3.3 mg/dl (versus carriers of the A allele −4.3 + 1.1 mg/dl; p = 0.01 after the S diet). The changes in HDL-cholesterol showed no significant differences. In addition, the reductions in LDL-cholesterol were greater in the non-carriers of the A allele than in carriers of the allele, with values of −12.1 ± 2.3 mg/dl (versus carriers of the A allele −5.0 ± 1.8 mg/dl; p = 0.01 after the HP diet) and −10.4 ± 1.4 mg/dl (versus carriers of the A allele −3.8 ± 1.9 mg/dl; p = 0.02 after the S diet). The decrease in triglyceride concentration was also greater in the non-carriers of the A allele than in the carriers of the allele, with values of −21.1 ± 4.1 mg/dl (versus carriers of the A allele −5.0 ± 1.9 mg/dl; p = 0.01 after the HP diet) and −10.4 ± 3.2 mg/dl (versus carriers of the A allele −3.8 ± 1.9 mg/dl; p = 0.02 after the S diet). Similarly, after both diets, the decrease in insulin levels was greater in the non-carriers of the A allele than in the carriers of the allele, with values of −5.2 ± 1.2 mIU/l (versus carriers of the A allele −1.2 ± 0.8 mIU/l; p = 0.01 after the HP diet) and −3.9 ± 1.1 mIU/l (versus carriers of the A allele −0.6 ± 0.7 mIU/l; p = 0.02 after the S diet). Lastly, the decrease in HOMA-IR was greater in the non-carriers of the A allele than in the carriers of the allele, with values of −0.5 ± 0.1 units (versus carriers of the A allele −0.2 ± 0.1; p = 0.03 after the HP diet) and −0.6 ± 0.2 units (versus carriers of the A allele −0.1 ± 0.5 mg/dl; p = 0.03 after the S diet).
Modification of biochemical parameters (mean ± SD).
| Variables | HP diet (n = 136) | S diet (n = 132) | ||||||||||
|---|---|---|---|---|---|---|---|---|---|---|---|---|
| GG (n = 45) | GA + AA (n = 91) | GG (n = 49) | GA + AA (n = 93) | |||||||||
| Time 0 | At 3 months | At 9 months | Time 0 | At 3 months | At 9 months | Time 0 | At 3 months | At 9 months | Time 0 | At 3 months | At 9 months | |
| Glucose (mg/dl) | 103.1 ± 8.2 | 99.2 ± 8.1a | 98.3 ± 10.1a | 101.9 ± 10.1 | 99.9 ± 12.0 | 98.9 ± 4.8 | 102.4 ± 8.1 | 98.7 ± 9.1a | 98.4 ± 9.1a | 98.8 ± 9.2 | 97.8 ± 6.4 | 98.1 ± 7.0 |
| Total chol (mg/dl) | 213.1 ± 19.1 | 206.8 ± 13.1a | 198.1 ± 23.7a | 206.1 ± 21.0 | 203.7 ± 31.0 | 204.4 ± 10.1 | 206.8 ± 30.9 | 195.0 ± 26.4a | 194.3 ± 12.4a | 203.1 ± 13.2 | 199.4 ± 19.7 | 197.8 ± 21.9 |
| LDL-chol (mg/dl) | 132.9 ± 13.1 | 126.1 ± 20.1a | 120.1 ± 12.1a | 129.9 ± 27.2 | 124.4 ± 20.1 | 124.1 ± 16.1 | 124.2 ± 11.5 | 116.1 ± 13.2a | 114.8 ± 12.0a | 122.6 ± 18.1 | 119.2 ± 21.9 | 118.8 ± 19.7 |
| HDL-chol (mg/dl) | 57.1 ± 10.1 | 57.7 ± 8.0 | 55.9 ± 7.1 | 56.1 ± 10.0 | 56.9 ± 9.1 | 55.8 ± 8.1 | 56.9 ± 11.2 | 53.2 ± 9.1 | 53.7 ± 11.0 | 55.0 ± 11.3 | 54.8 ± 8.1 | 55.1 ± 11.0 |
| TG (mg/dl) | 125.8 ± 23.1 | 112.1 ± 16.4a | 104.1 ± 13.2a | 118.3 ± 29.1 | 112.8 ± 31.2 | 107.9 ± 30.3 | 129.1 ± 22.6 | 115.4 ± 23.1a | 114.1 ± 20.1a | 121.1 ± 42.3 | 120.9 ± 8.3 | 113.9 ± 31.9 |
| Insulin (mIU/l) | 10.4 ± 5.4 | 7.7 ± 3.2a | 7.2 ± 5.1a | 12.1 ± 7.1 | 10.4 ± 9.2 | 10.9 ± 7.4 | 10.6 ± 5.0 | 6.8 ± 4.1a | 6.7 ± 4.0a | 10.5 ± 5.1 | 10.4 ± 4.2 | 9.9 ± 7.8 |
| HOMA-IR | 2.4 ± 0.9 | 2.0 ± 0.5a | 1.9 ± 0.7a | 2.5 ± 1.1 | 2.3 ± 2.1 | 2.3 ± 1.4 | 2.6 ± 1.1 | 2.0 ± 1.0a | 2.0 ± 1.1a | 2.3 ± 1.1 | 2.2 ± .8 | 2.0 ± 1.3 |
| CRP (mg/(dl) | 4.8 ± 3.0 | 4.7 ± 2.9 | 4.6 ± 3.1 | 4.6 ± 3.1 | 5.1 ± 4.1 | 4.9 ± 3.2 | 5.0 ± 4.1 | 5.2 ± 4.0 | 4.9 ± 4.1 | 5.1 ± 4.1 | 5.2 ± 3.5 | 5.3 ± 3.2 |
Chol: cholesterol; HP diet: high-protein, low-carbohydrate low-calorie diet; S diet: standard low-calorie protein diet; HDL: high density lipoprotein; HOMA-IR: homeostasis model assessment; HP diet: high protein/low carbohydrate; LDL: low density lipoprotein; CRP: C-reactive protein; S: standard; TG: triglycerides.
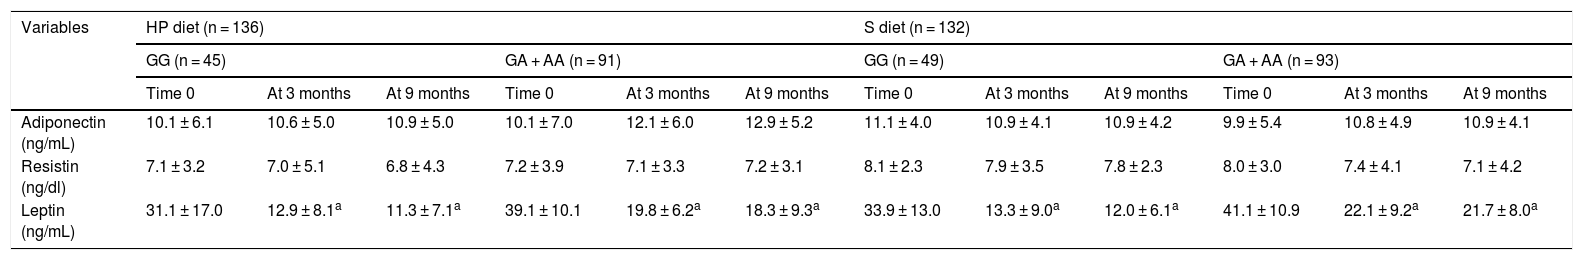
Table 4 reports the adipocytokine levels. Adipocytokines and inflammatory markers showed no statistically significant differences between the two genotypes. The leptin levels decreased in both genotypes after the HP and S diets (Table 4).
Circulating adipocytokines (mean ± SD).
| Variables | HP diet (n = 136) | S diet (n = 132) | ||||||||||
|---|---|---|---|---|---|---|---|---|---|---|---|---|
| GG (n = 45) | GA + AA (n = 91) | GG (n = 49) | GA + AA (n = 93) | |||||||||
| Time 0 | At 3 months | At 9 months | Time 0 | At 3 months | At 9 months | Time 0 | At 3 months | At 9 months | Time 0 | At 3 months | At 9 months | |
| Adiponectin (ng/mL) | 10.1 ± 6.1 | 10.6 ± 5.0 | 10.9 ± 5.0 | 10.1 ± 7.0 | 12.1 ± 6.0 | 12.9 ± 5.2 | 11.1 ± 4.0 | 10.9 ± 4.1 | 10.9 ± 4.2 | 9.9 ± 5.4 | 10.8 ± 4.9 | 10.9 ± 4.1 |
| Resistin (ng/dl) | 7.1 ± 3.2 | 7.0 ± 5.1 | 6.8 ± 4.3 | 7.2 ± 3.9 | 7.1 ± 3.3 | 7.2 ± 3.1 | 8.1 ± 2.3 | 7.9 ± 3.5 | 7.8 ± 2.3 | 8.0 ± 3.0 | 7.4 ± 4.1 | 7.1 ± 4.2 |
| Leptin (ng/mL) | 31.1 ± 17.0 | 12.9 ± 8.1a | 11.3 ± 7.1a | 39.1 ± 10.1 | 19.8 ± 6.2a | 18.3 ± 9.3a | 33.9 ± 13.0 | 13.3 ± 9.0a | 12.0 ± 6.1a | 41.1 ± 10.9 | 22.1 ± 9.2a | 21.7 ± 8.0a |
SD: standard deviation; HP diet: high protein, low carbohydrate low-calorie diet; S diet: standard low-calorie protein diet.
The present study identified an association between the A allele of SNP rs3123554 of the CB2R gene and a greater BMI and other adiposity parameters. In addition, the non-carriers of the A allele showed a better response in terms of LDL-cholesterol, total cholesterol, triglycerides, glucose, HOMA-IR and insulin levels than the carriers of the A allele with both low-calorie diets after similar weight loss.
The endocannabinoid system is known to be related to different inflammatory pathways and obesity.17 Moreover, the role of inflammation in the pathogenesis of metabolic alterations in obese individuals has been well established.18,19 Although CB2R has been defined as the peripheral isoform of the cannabinoid receptor, there is now evidence of the expression of CB2R in different areas of the central nervous system (CNS).20 The presence of CB2R in brain tissue may possibly explain the data of our study relating this polymorphism to adiposity parameters in carriers of the A allele. Two hypotheses suggest themselves: firstly, CB2R has been shown to be involved in regulation of the endocannabinoid levels that could modulate reward and craving behaviors through relevant neuronal circuits,21 and secondly, the activation of CB2R in humans influences eating behavior.22 These two hypotheses could explain the differences found through an effect on energy intake from food.
The observed percentage of subjects carrying the minor allele (over 50%) is similar to that found in previous studies.6–8 Surprisingly, we found the minor allele of rs3123554 to be associated with significantly greater body weight that led to lesser improvement of the metabolic parameters during both dietary interventions. The association of the minor allele of SNP rs3123554 with body weight has been previously described.23 To explain this, we postulate a peripheral hypothesis and a central hypothesis. The peripheral hypothesis is that CB2R has been isolated in certain target tissues related to metabolism control, such as adipose tissue, liver and skeletal muscle.24 These three types of tissues have traditionally been associated with insulin resistance seen in obese patients. It should be noted that the stimulation of CB2R by agonists activates the serine/threonine protein kinase Akt signaling pathway, which is involved in proliferation and metabolism. In addition to this peripheral hypothesis, harmful effects may also be expected of CB2R upon insulin secretion, in view of the inhibition of insulin secretion triggered by CB2R receptors expressed by pancreatic beta cells.25 Lastly, the physiological effect of CB2R has been demonstrated in two different tissues (gonadal tissue and bone). The SNPs of the CB2R gene (rs3003336, rs2501431, rs2502992, rs2501432) influence the etiology of osteoporosis and suggest that CB2R may play an important role in bone mineral density.26 In turn, CB2R polymorphism rs35761398 is related to an earlier age of menarche in subjects carrying the Q63 allele.27
To explain the second hypothesis (central hypothesis), some authors6 have found that individuals carrying the A allele have reduced brain insulin sensitivity, and in this regard it should be taken into account that brain insulin sensitivity facilitates body weight loss during calorie restriction.19 Considering that brain insulin sensitivity determines the effectiveness of dietary intervention in terms of weight loss,28 we postulate that decreased brain insulin sensitivity in carriers of the A allele may be related to their inability to improve the metabolic parameters related to glucose and lipid metabolism in contrast to non-carriers of the A allele. For example, carriers of the A allele showed less theta activity after the administration of nasal insulin,29 representing a decrease in brain insulin sensitivity. This brain insulin sensitivity therefore determines the efficacy of weight loss in metabolic changes.28
The metabolic changes after weight loss in non-carriers of the A allele observed in our study are similar to those reported in earlier studies of shorter duration (3 months). In a previous study,8 carriers of the A allele lost less body weight during two different low-calorie diets (moderate carbohydrates vs. normal carbohydrates). Improvement of the biochemical parameters was poorer in carriers of the A allele than in non-carriers of the allele. In another study,9 non-carriers of the A allele showed greater improvements in terms of body weight, fat mass, insulin resistance and lipid profile than carriers of the allele after weight loss following a low-calorie Mediterranean diet lasting three months. The results regarding the biochemical parameters of these two studies8,9 were similar to those found in our own study. The only difference between the previous studies and our own was the similar weight loss with the HP and S diet recorded in our study in both genotypes. Possibly the longer duration of our intervention (9 months) compared with the previous three-month studies8,9 explains such similar weight loss in both genotypes. These different weight loss responses may also have been conditioned by the inclusion criteria and heterogeneity of subjects in these intervention studies, by variable ethnic origin, the distribution of the nutrients of the low-calorie diets, the time course of the dietary intervention, and interaction with other polymorphisms in the CBR gene. We have no clear mechanistic explanation for this different response between carriers and non-carriers of the A allele.
The limitations of our study include the fact that the data are not generalizable beyond an obese population without established cardiovascular events. Secondly, there are many uncontrolled factors that could have influenced our results (epigenetics, hormone status, other unknown environmental factors, etc.). Thirdly, we only analyzed a single SNP in this CB2R pathway, and in this regard other genetic variants of the receptor or another receptor such as CB1R could have influenced these results. Finally, self-reported food intake is not reliable, and patients may either underestimate or overestimate the food they eat. Nevertheless, our study has its strengths, such as its randomized clinical trial design. Moreover, the intervention lasted 9 months, which was longer than any study previously reported in the literature.
In conclusion, non-carriers of the A allele showed a better response in terms of LDL-cholesterol, total cholesterol, triglycerides, glucose, HOMA-IR and insulin levels than the carriers of the A allele with both severe low-calorie diets after 9 months. This is an important finding for the application of personalized medicine, because genetic-environmental interactions are of increasing interest in this field.
Conflicts of interestThe authors declare that they have no conflicts of interest.
Please cite this article as: Primo D, Izaola O, de Luis D. Efectos de una dieta hipocalórica rica en proteína/baja de hidratos de carbono vs. una estándar sobre los parámetros antropométricos y factores de riesgo cardiovascular, papel del polimorfismo rs3123554 del gen del receptor canabinoide tipo 2 (CB2R). Endocrinol Diabetes Nutr. 2020. https://doi.org/10.1016/j.endinu.2019.09.010