


This study assesses the causal relationship between information and communication technology (ICT) penetration, financial development, and economic growth in Next-11 countries between 1961 and 2012. A panel vector auto-regressive (VAR) model is used to detect the direction of causality between ICT, financial sector development and economic growth for these countries. The results reveal that there is Granger-causality among the variables both in the short run and in the long run, although the exact nature of the results varies by the ICT penetration indicators for the sample countries. Empirical results from this study provide valuable insights on policies pertaining to ICT penetration, financial sector development and economic growth.
El presente estudio evalúa la relación causal entre la penetración de las tecnologías de la información y comunicación (TIC), el desarrollo financiero y el crecimiento económico en los Próximos 11 entre 1961 y 2012. Se utilizó un modelo de panel de vectores autorregresivos para detectar la dirección de causalidad entre las TIC, el desarrollo del sector financiero y el crecimiento económico para estos países. Los resultados revelan que existe una causalidad de Granger entre las variables tanto a corto como a medio plazo, si bien la naturaleza exacta de los hallazgos varía conforme a los indicadores de penetración de las TIC para los países de la muestra. Los resultados empíricos de este estudio suponen una valiosa perspectiva acerca de las políticas de penetración de las TIC, el desarrollo del sector financiero y el crecimiento económico.
Over the past five decades, there has been rapid transformation of the global economy and many of the changes have been powered by the information and communication technology (ICT) revolution. ICT has become an integral part of the global economic architecture. ICT is regarded as a foundational condition for a knowledge-intensive economy, where the following can be achieved: (1) strengthening of collaboration between economic agents, thereby enabling firms to pursue open innovation (Fitjar and Rodríguez-Pose, 2013); (2) enhancing the innovative capacity of countries (Nair, 2011; Nair and Shariffadeen, 2009); (3) improving firm level productivity (Sadun and Farooqui, 2006; Forman et al., 2005; Entner, 2008); (4) providing easy access to a wide range of affordable products and services (Brown and Goolsbee, 2002; Baye et al., 2004; Tang et al., 2007); (5) opening new employment opportunities (Nair and Vaithilingam, 2012); (6) improving corporate and public sector governance (Kalam, 2003); and (7) providing marginalized communities access to information and resources for business development (Bhatnagar, 2000; Quibria et al., 2002).
Several studies have examined the impact of network externalities on economic growth and vice versa (see, for instance, Pradhan et al., 2014a). Additionally, the role of financial sector development has been extensively studied in the literature (see for example, King and Levine, 1993; Levine and Zervos, 1996; Levine et al., 2000; Ulgen, 2015). While the relationship between ICT on economic development has been well established, the literature that examines the dynamics between ICT penetration, financial sector development and economic growth is not well-developed. Hence, the primary objective of this paper is to examine the causal relationships between ICT penetration, financial sector development and economic growth using a panel vector auto-regressive (VAR) model for the Next-11 countries from 1961 to 2012. The results from the empirical analysis will have important policy implications pertaining to ICT penetration, financial sector development and pro-growth strategies.
The paper is structured as follows. Section 2 provides a theoretical basis, Section 3 offers a brief review of the literature. Section 4 provides the methodology used in this study, outlining the conceptual model, hypotheses and empirical methodology. Section 5 discusses the empirical results and Section 6 provides the policy implications of the empirical results and concluding remarks.
2Theoretical basisExplaining the sources of economic growth ranks among the most significant topics that economists have examined. Romer (1986) initially started a set of theoretical and empirical analyses focusing on the endogeneity of the growth process as compared to Solow-type neoclassical growth models (Solow, 1956), which used an aggregate function approach and endogenous technical changes (Roller and Waverman, 2001). Numerous papers since then have attempted to disentangle the elements of a national economy that create the economic growth (see, for instance, Aghion and Howitt, 1998). The factors that determine economic growth can be grouped into three different types: the first group basically considers the accumulation of broad capital, including human capital and different types of physical capitals; the second group basically considers spillovers or external economies; and third group stresses industrial innovation as the engine of growth (Grossman and Helpman, 1994).
This paper examines the impact of ICT infrastructure and financial development on per capita economic growth. We cover some key economies (namely, the Next-11 countries). Over recent decades, these policymakers in most of these countries have devoted considerable effort to developing their financial markets and ICT sectors to elevate their economic growth. Some of these efforts have included investment expansion, financial regulation, as well as improvements in the ICT infrastructure inter alia. Therefore, our study formally investigates whether the development of ICT and financial sectors can be causal factors of growth for these countries and whether they also cause each other. The balance of this section highlights the possible theoretical links between these variables.
ICT infrastructure is generally recognized as an important factor in determining economic growth. There are three reasons why this may be the case: (1) ICT are omnipresent in most business sectors, (2) ICT improves continuously and hence reduce costs for the users, and (3) ICT contributes to innovation and the development of the new products and processes (Andrianaivo and Kpodar, 2011). However, with the elevated role of ICT infrastructure, the issue of duality matters in the phases of economic growth (Dutta, 2001). That means there is the possibility of bidirectional causal relationships between ICT infrastructure and economic growth. Fig. C.1 in Appendix C summarizes the duality between ICT infrastructure and economic growth.
Analogously, financial development can be considered as an important factor in determining economic growth. The degree to which financial market activities are pervasive in a country is believed to be largely a function of five factors: (1) producing and processing information about possible investments and allocating capital based on these assessments, (2) monitoring individuals and firms and exerting corporate governance after allocating capital, (3) facilitating trade, (4) mobilizing and pooling savings, and (5) easing the exchange of goods, services, and financial instruments (Cihak et al., 2011). Again with the increasing importance of financial development, the issue of duality also matters in the phases of economic growth. That means there is possibility of bidirectional causality between financial development and economic growth (see Levine et al., 2000; King and Levine, 1993).
Finally, ICT infrastructure can be considered as an important factor for financial development. ICT generally allows expansion and access to financial services of the economy. It reduces transaction costs, especially the costs of running physical financial institution branches. Additionally, the increasing use of ICT services (especially mobile banking) has contributed to the emergence of branchless financial services, thereby improving financial inclusion in particular and financial development in general. In sum, ICT provides better information flows, particularly with reference to improving access to credit and deposit facilities, and can allow efficient allocation of credit, facilitate financial transfers, and boost financial development (Andrianaivo and Kpodar, 2011). Yet again with the increasing importance of ICT development, the issue of duality also matters here in the phases of financial development. That means there is possibility of bidirectional causality between ICT infrastructure and financial development (Pradhan et al., 2015).
3Literature reviewThe literature on ICT-growth nexus and financial sector development-growth nexus are extensive. Our paper is directly related to these two stands of the literature.
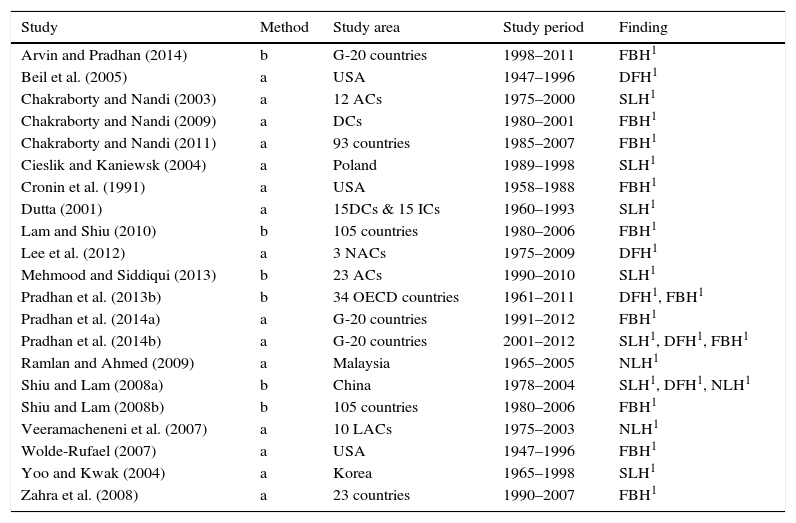
There are four schools of thought in the ICT-growth literature. The first supports a supply-leading hypothesis (SLH), which argues that ICT penetration is a pre-condition for economic development. The proponents argue that, as economic agents become more connected to the information highway, they are able to extend their reach to obtain more information, knowledge, products, services and markets. This enables them to improve their productivity, innovative capacity and wealth creation opportunities. Among the empirical studies that show this line of argument include: Cieslik and Kaniewsk (2004), Chakraborty and Nandi (2003), and Mehmood and Siddiqui (2013).
The second school of thought advances the demand-following hypothesis (DFH), which suggests that countries that experience higher economic growth tend to increase spending on ICT development. Supporters of this hypothesis argue that as wealth levels in a country grow, economic agents tend to demand more sophisticated technology to improve their socioeconomic statuses. To meet the demand of the various stakeholders, governments invest a significant amount of resources to develop and upgrade the ICT infrastructure, support systems and regulatory environment. That is, economic development causes ICT penetration. Empirical studies that have shown the causal linkage from economic growth to ICT penetration include Beil et al. (2005), Lee et al. (2012), Pradhan et al. (2013a) and Shiu and Lam (2008a).
A third school of thought is the feedback hypothesis (FBH), which argues that ICT can complement and can deepen the impact on economic growth and vice versa. Here, the proponents suggest that ICT improves economic productivity and economic growth opportunities. As the wealth of economic agents and countries increases, these countries tend to increase investments in ICT to continuously develop and upgrade not only the number of people using ICT, but also the quality of the ICT so as to enable firms to pursue economies of scale and scope and to move up the innovation value chain. The feedback between ICT development and economic growth has a reinforcing impact on each other, enabling the economy to gravitate to a higher stage of economic development. Empirical studies that supports the FBH include the following: Chakraborty and Nandi (2009, 2011), Wolde-Rufael (2007), and Zahra et al. (2008).
The final school of thought maintains that there is no causal link between ICT and economic growth, known as no linkage hypothesis (NLH). This hypothesis seems to be a minority in the literature. A study that has shown this result is Veeramacheneni et al. (2007).
A summary of the studies that have examined the causal link between ICT penetration and economic development is given in Table 1.
Summary of studies on the nexus between ICT penetration and economic growth.
| Study | Method | Study area | Study period | Finding |
|---|---|---|---|---|
| Arvin and Pradhan (2014) | b | G-20 countries | 1998–2011 | FBH1 |
| Beil et al. (2005) | a | USA | 1947–1996 | DFH1 |
| Chakraborty and Nandi (2003) | a | 12 ACs | 1975–2000 | SLH1 |
| Chakraborty and Nandi (2009) | a | DCs | 1980–2001 | FBH1 |
| Chakraborty and Nandi (2011) | a | 93 countries | 1985–2007 | FBH1 |
| Cieslik and Kaniewsk (2004) | a | Poland | 1989–1998 | SLH1 |
| Cronin et al. (1991) | a | USA | 1958–1988 | FBH1 |
| Dutta (2001) | a | 15DCs & 15 ICs | 1960–1993 | SLH1 |
| Lam and Shiu (2010) | b | 105 countries | 1980–2006 | FBH1 |
| Lee et al. (2012) | a | 3 NACs | 1975–2009 | DFH1 |
| Mehmood and Siddiqui (2013) | b | 23 ACs | 1990–2010 | SLH1 |
| Pradhan et al. (2013b) | b | 34 OECD countries | 1961–2011 | DFH1, FBH1 |
| Pradhan et al. (2014a) | a | G-20 countries | 1991–2012 | FBH1 |
| Pradhan et al. (2014b) | a | G-20 countries | 2001–2012 | SLH1, DFH1, FBH1 |
| Ramlan and Ahmed (2009) | a | Malaysia | 1965–2005 | NLH1 |
| Shiu and Lam (2008a) | b | China | 1978–2004 | SLH1, DFH1, NLH1 |
| Shiu and Lam (2008b) | b | 105 countries | 1980–2006 | FBH1 |
| Veeramacheneni et al. (2007) | a | 10 LACs | 1975–2003 | NLH1 |
| Wolde-Rufael (2007) | a | USA | 1947–1996 | FBH1 |
| Yoo and Kwak (2004) | a | Korea | 1965–1998 | SLH1 |
| Zahra et al. (2008) | a | 23 countries | 1990–2007 | FBH1 |
Note 1: SLH1: supply-leading hypothesis: unidirectional causality is present from ICT to economic growth; DFH1: demand-following hypothesis: unidirectional causality from economic growth to ICT is present; FBH1: feedback hypothesis: bidirectional causality between ICT and economic growth is present; and NLH1: neutrality hypothesis: no causality between ICT and economic growth is present.
Note 2: DCs: developing countries; ACs: Asian countries; CEE: Central and Eastern Europe; ICs: industrialised countries; NACs: Northeast Asian countries; LACs: Latin American countries.
Note 3: (a) Granger causality; and (b) Dynamic Panel Data Model.
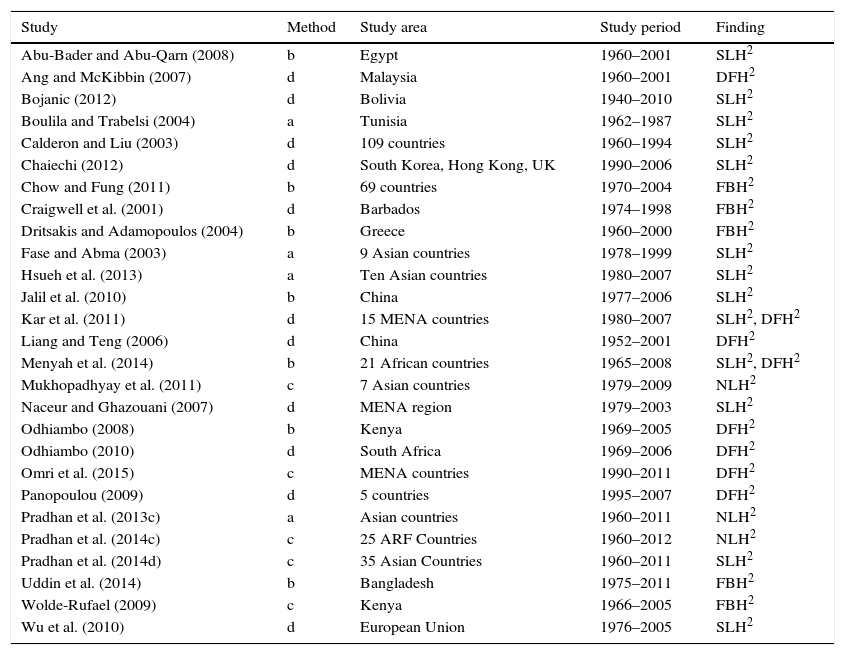
There has also been extensive work in the literature examining the causal relationship between financial sector development and economic growth. Similar to the ICT-growth literature, there are four schools of thoughts on the causal relationship between financial sector development and economic growth. The first is the SLH, which suggests that financial sector development is important to facilitate economic growth. Schumpeter (1934) is one of the earliest works to postulate the impact of financial sector development on economic growth. Several other studies have also argued that financial sector development is a key catalyst for stimulating economic growth via the following channels: (1) reallocating resources from less productive sectors to more productive, growth-inducing sectors (Patrick, 1966); (2) providing valuable information and analysis of firms and markets to investors, hence reducing economic risks and uncertainties (Greenwood and Jovanovic, 1990); (3) increasing the ability of economic agents to accurately evaluate investment initiatives, mobilizing households savings for innovative activities and diversifying risks to enhance the innovation of intermediate goods (King and Levine, 1993); and (4) lowering costs of new investment, thus facilitating backward linkages with foreign firms and increasing rates of intermediate input and economic growth (Alfaro et al., 2004).
There are a number of studies that support DFH, which suggests that economic growth has a positive impact on financial development (Wolde-Rufael, 2009; Gries et al., 2009; Ang, 2008a,b). Accumulation of wealth due to robust economic growth will provide adequate resources to improve the technology, human capital, institutions, corporate governance, linkages between economic agents and innovation. These factors are important for improving the quality of the financial sector and increasing demand for more sophisticated financial systems, instruments and products. Studies that have shown the causal linkage between economic growth and financial sector development include Ang and McKibbin (2007), Liang and Teng (2006), Odhiambo (2008, 2010), Omri et al. (2015) and Panopoulou (2009). There have also been studies in the literature that support the FBH (Chow and Fung, 2011; Craigwell et al., 2001; Uddin et al., 2014; Wolde-Rufael, 2009) and the NLH (Mukhopadhyay et al., 2011; Pradhan et al., 2013c, 2014c).
A comprehensive summary of the studies that support the four hypotheses are given in Table 2.
Summary of studies on the nexus between financial development and economic growth.
| Study | Method | Study area | Study period | Finding |
|---|---|---|---|---|
| Abu-Bader and Abu-Qarn (2008) | b | Egypt | 1960–2001 | SLH2 |
| Ang and McKibbin (2007) | d | Malaysia | 1960–2001 | DFH2 |
| Bojanic (2012) | d | Bolivia | 1940–2010 | SLH2 |
| Boulila and Trabelsi (2004) | a | Tunisia | 1962–1987 | SLH2 |
| Calderon and Liu (2003) | d | 109 countries | 1960–1994 | SLH2 |
| Chaiechi (2012) | d | South Korea, Hong Kong, UK | 1990–2006 | SLH2 |
| Chow and Fung (2011) | b | 69 countries | 1970–2004 | FBH2 |
| Craigwell et al. (2001) | d | Barbados | 1974–1998 | FBH2 |
| Dritsakis and Adamopoulos (2004) | b | Greece | 1960–2000 | FBH2 |
| Fase and Abma (2003) | a | 9 Asian countries | 1978–1999 | SLH2 |
| Hsueh et al. (2013) | a | Ten Asian countries | 1980–2007 | SLH2 |
| Jalil et al. (2010) | b | China | 1977–2006 | SLH2 |
| Kar et al. (2011) | d | 15 MENA countries | 1980–2007 | SLH2, DFH2 |
| Liang and Teng (2006) | d | China | 1952–2001 | DFH2 |
| Menyah et al. (2014) | b | 21 African countries | 1965–2008 | SLH2, DFH2 |
| Mukhopadhyay et al. (2011) | c | 7 Asian countries | 1979–2009 | NLH2 |
| Naceur and Ghazouani (2007) | d | MENA region | 1979–2003 | SLH2 |
| Odhiambo (2008) | b | Kenya | 1969–2005 | DFH2 |
| Odhiambo (2010) | d | South Africa | 1969–2006 | DFH2 |
| Omri et al. (2015) | c | MENA countries | 1990–2011 | DFH2 |
| Panopoulou (2009) | d | 5 countries | 1995–2007 | DFH2 |
| Pradhan et al. (2013c) | a | Asian countries | 1960–2011 | NLH2 |
| Pradhan et al. (2014c) | c | 25 ARF Countries | 1960–2012 | NLH2 |
| Pradhan et al. (2014d) | c | 35 Asian Countries | 1960–2011 | SLH2 |
| Uddin et al. (2014) | b | Bangladesh | 1975–2011 | FBH2 |
| Wolde-Rufael (2009) | c | Kenya | 1966–2005 | FBH2 |
| Wu et al. (2010) | d | European Union | 1976–2005 | SLH2 |
Note 1: SLH2: supply-leading hypothesis: unidirectional causality is present from financial development to economic growth; DFH2: demand-following hypothesis: unidirectional causality from economic growth to financial development is present; FBH2: feedback hypothesis: bidirectional causality between financial development and economic growth is present; and NLH2: neutrality hypothesis: no causality between financial development and economic growth is present.
Note 2: (a) Bivariate Granger causality; (b) trivariate Granger causality; (c) quadvariate Granger causality; (d) multivariate Granger causality; MENA: Middle East and North Africa.
The relationship between ICT penetration and financial sector development has received some attention in the literature. Improvements in ICT over the years have enabled financial institutions to obtain and disseminate information to various stakeholders, reducing information asymmetries and associated market failures (Morck et al., 2000). High speed communication networks have also enabled financial institutions to de-couple the ‘space-time continuum’, leading to the development of more efficient online financial, banking and brokerage platforms.
There have been very few studies that have examined the causal relations between ICT penetration and financial sector development. One of the studies that have examined this relationship is Shamim (2007), which shows that for a sample of 61 countries, 49 countries had causality from ICT connectivity to financial sector development. The study also shows that causality ran from financial sector development to ICT connectivity for the Netherlands, Nigeria, Spain, Switzerland, Thailand and the USA. In the case of Austria, China, France, Italy, Korea, and Malaysia the causal relations is bi-directional. A more recent study by Lechman and Marszk (2015) argues a strong relationship between ICT penetration and exchange traded funds for Japan, Mexico, the United States and Korea.
However, the trivariate-relationship between ICT penetration, financial development and economic growth is scarce in the development literature. To our knowledge, there are only two studies which have examined the above-mentioned relationship. Shamim (2007) used the Generalised Method of Moments (GMM) approach for a sample of 61 countries to show that connectivity variables deepen the impact of financial sector development on economic growth. Sassi and Goaied (2013) examine MENA countries using the GMM method and show that ICT development contributes positively to economic growth. On the other hand, they find that financial sector development has a negative impact on growth and that ICT development reinforces the role of financial sector development on economic growth in these countries.
The above brief review of the literature highlights that the relationships between ICT penetration, financial development and economic growth have been mixed. Hence, there is a need for further analysis to understand the dynamics between these variables so that effective policy measures to ensure sustainable economic development can be introduced. In the light of the research gap identified in the literature, this paper examines the causal relationship between ICT penetration, financial development and economic growth for a panel of the Next-11 countries – a group of nations that have not been studied before in this literature.
4MethodologyThe contribution of our paper is three-fold. First, this study integrates ICT penetration with finance-growth nexus, which has not received much coverage in the literature. Second, we use a sample of 11 developed and developing countries, which have not been previously studied in the literature. We also utilize a long span time period (1961–2012). Third, this study utilizes advanced panel cointegration and Granger causality tests to capture the dynamics between the three variables. This method, while common in the economics literature, has not gained much prominence in the information systems literature. In this section, the theoretical framework, hypothesis development, empirical model, description of the sample data and the empirical methodology are presented.
4.1Statement of the hypothesesIn this paper, we examine the possible patterns of causal relationships between ICT penetration,1 financial development, and economic growth. The null hypotheses we will test are given below and summarized in Fig. 1:
H1A, B: Telephone line penetration Granger-causes economic growth, and vice versa
H2A, B: Telephone line penetration Granger-causes financial development, and vice versa
H3A, B: Mobile phone penetration Granger-causes economic growth, and vice versa
H4A, B: Mobile phone penetration Granger-causes financial development, and vice versa
H5A, B: Internet user penetration Granger-causes economic growth, and vice versa
H6A, B: Internet user penetration Granger-causes financial development, and vice versa
H7A, B: Internet server penetration Granger-causes economic growth, and vice versa
H8A, B: Internet server penetration Granger-causes financial development, and vice versa
H9A, B: Broadband penetration Granger-causes economic growth, and vice versa
H10A, B: Broadband penetration Granger-causes financial development, and vice versa
H11A, B: ICT penetration Granger-causes economic growth, and vice versa
H12A, B: ICT penetration Granger-causes financial development, and vice versa
H13A, B: Economic growth Granger-causes financial development, and vice versa

The relationship between ICT, financial development and economic growth. Note. GROWTH: per capita economic growth; FINANC: financial development; TELLIN; telephone lines penetration; MOBILE: mobile phone penetration; INTUSE: internet user penetration; INTSERV: internet server penetration; FIXBRO: fixed broadband penetration; and ICTIND: composite index of ICT penetration.
In order to examine the empirical relationships between ICT penetration, financial development and economic growth, the following model is considered:

The logarithmic transformation of Eq. (1) is given by
where β0=ln(B0GROWTH); i (=1, 2, …, N) represents a country in the sample; t (=1, 2, …, T) denotes the time period for each country; and βi (for i=1, 2) represents parameters of the model.
The task is to estimate the parameters in Eq. (2) and conduct some panel tests on the causal relationships between GROWTH, FINANC and ICTPEN. It is postulated that β1GROWTH>0, which can justify that an increase in FINANC will likely cause an increase in GROWTH. Similarly, we expect β2GROWTH>0, which can again justify that an increase in ICTPEN will likely cause an increase in GROWTH.
The variable GROWTH is the change in per capita gross domestic product, expressed in percentage. ICTPEN is information communication technology (ICT) penetration, which is measured by a composite index (variable: ICTIND) and five individual ICT penetration indicators: telephone landline penetration (variable: TELLIN), mobile phone penetration (variable: MOBILE), internet user penetration (variable: INTUSE), internet server penetration (variable: INTSER), and fixed broadband penetration (variable: FIXBRO). The final variable is FINANC which is a composite index of financial development and is the weighted average of nine financial development indicators: broad money supply (variable: BMONEY), claims on the private sector (variable: CLAIMS), domestic credit to the private sector (variable: DCPRIS), domestic credit provided by the banking sector (variable: DCBANK), domestic credit to the financial sector (variable: DCFINS), market capitalization (variable: SMACAP), traded stocks (variable: STMTRS), stock market turnover (STMTUR), and the number of listed companies in the stock market (variable: NLCOMP). Appendix A provides the detailed description of these variables (see Tables A.1 and A.2). The detailed descriptions about the formulation of the two composite indices (ICTIND and FINANC) are available in Appendix B.
We use the natural log of annual data on the Next-11 countries, covering the period from 1961 to 2012. The countries in our sample are: Bangladesh, Egypt, Indonesia, Iran, South Korea, Mexico, Nigeria, Pakistan, Philippines, Turkey, and Vietnam. Since the ICT revolution over the years has occurred in several waves (from basic telephony, followed by internet, mobile phones and broadband technology), the dynamics between different ICT, financial development and economic growth are investigated for the following six different time periods: Case 1 (1961–2012) uses telephone line penetration; Case 2 (1991–2012) uses mobile phone penetration; Case 3 (1991–2012) uses internet user penetration; Case 4 (2001–2012) uses internet server penetration; Case 5 (2001–2012) uses fixed broadband penetration; Case 6 (2001–2012) uses the composite index of ICT penetration.
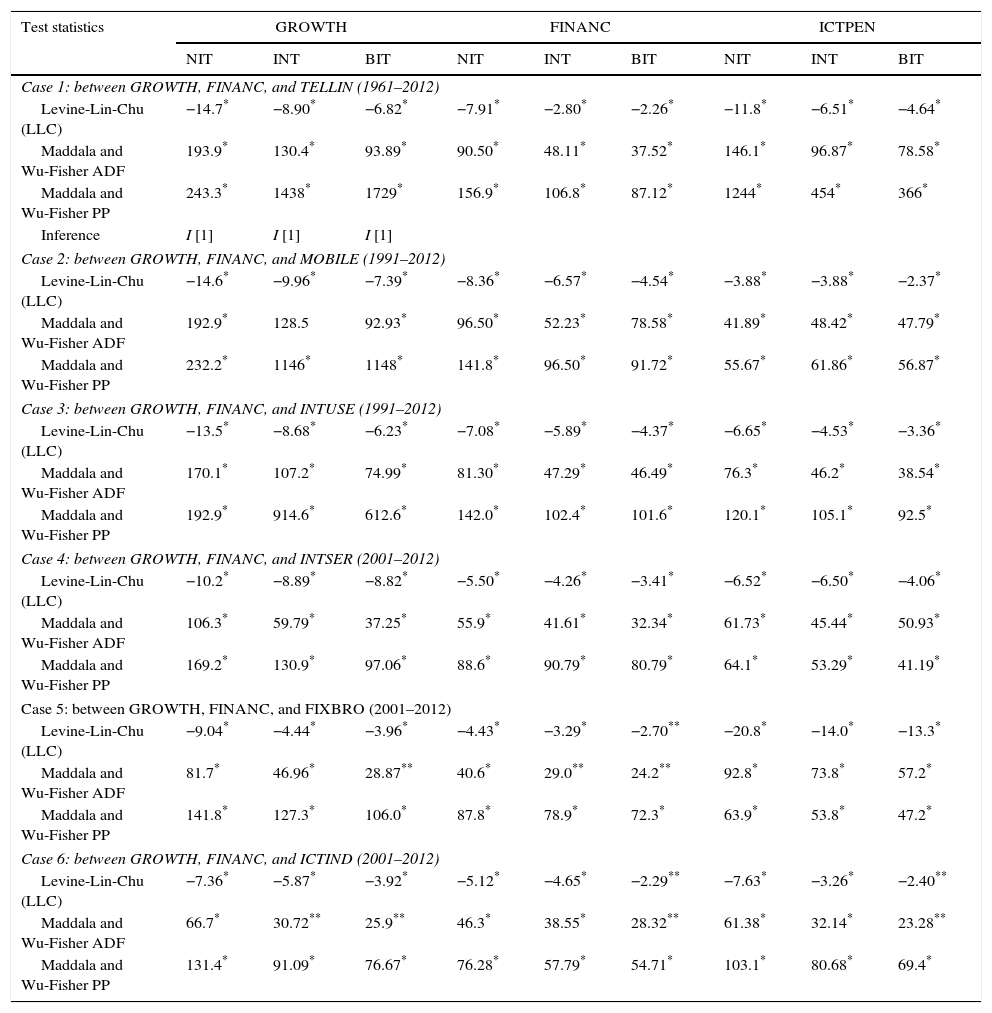
4.3Panel unit root testStudies have shown that most of the economic and financial time series were found to be non-stationary (Engle and Granger, 2003). If two time series are non-stationary, regressing one series against the other will lead to spurious regression results (Granger and Newbold, 1974). Hence, before studying any empirical relationships, the stationarity properties of each time series should be ascertained. In this context, unit root test should be conducted to determine the order of integration of a series. The order of integration is determined by the number of times a non-stationary series is differenced until the series becomes stationary (Christopoulos and Tsionas, 2004).
In our study, the panel unit root test is deployed to estimate the degree (i.e., the order) of integration for GROWTH, ICTPEN and FINANC. While several panel unit root tests are available, we specifically use four panel unit root tests [the Levine-Lin-Chu test (LLC; Levine et al., 2002), the Im-Pesaran-Shin test (IPS; Im et al., 2003), the Maddala and Wu-Fisher Augmented Dickey Fuller (ADF) test, and the Maddala and Wu-Fisher Phillips and Perron (PP) test (Maddala and Wu, 1999)] to check the stationarity of the variables. The LLC is a homogeneous panel unit root test, while IPS, ADF and PP are panel heterogeneous unit root tests. The tests employed in this study are widely used in the empirical literature and standard books on time series; hence the technical details of the tests are not included in this paper.
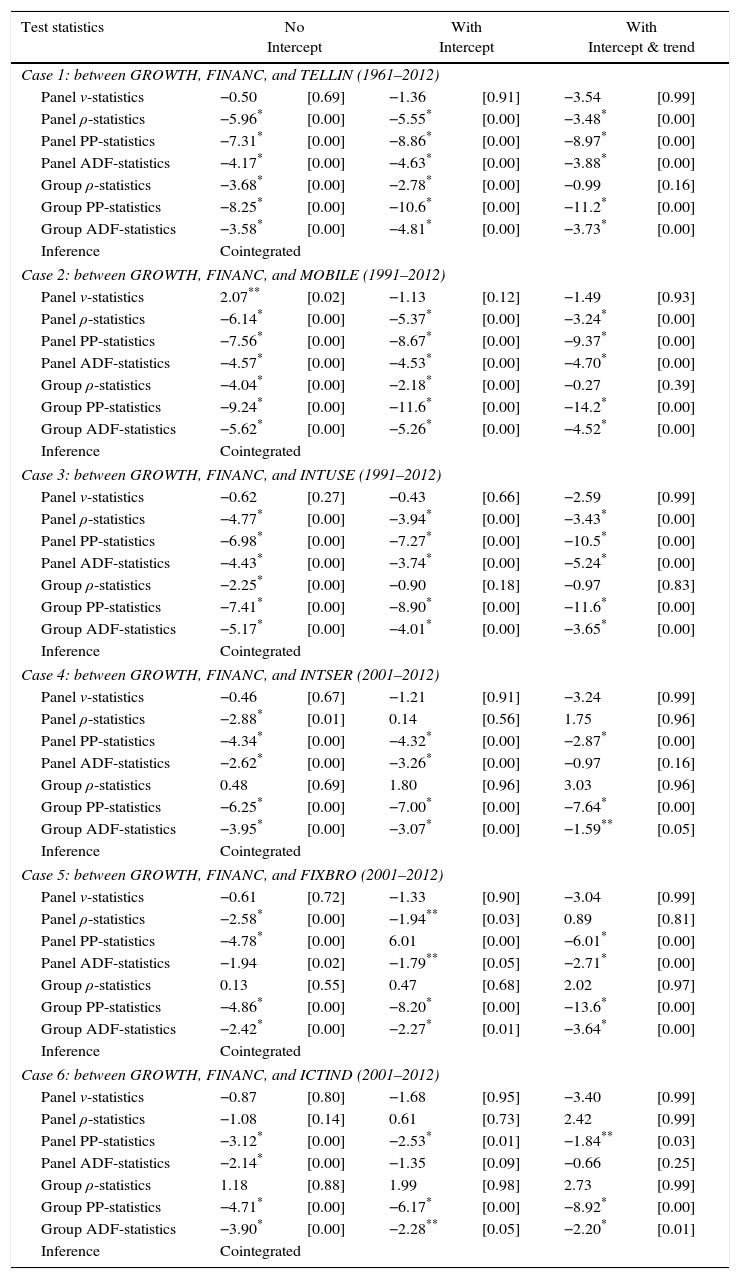
4.4Panel cointegration testCointegration is a statistical concept that explains the long-run relationships between non-stationary variables. If the difference between two non-stationary series is itself stationary, then the two series are regarded as being cointegrated. If two or more series are cointegrated, then there exist long-run equilibrium relationships between these series. If the series are not cointegrated, then it is regarded that there is no long-run relationship between the series and the series may diverge from each other. In our study, the panel cointegration test is deployed to ascertain the long-run equilibrium relationships between GROWTH, ICTPEN and FINANC.
While several panel cointegration tests are available in the literature, we specifically use Pedroni's panel cointegration method (Pedroni, 2004) to determine the existence of cointegration among these three series. The technique starts with the following regression equation:
where β0GROWTHi is a member-specific intercept or fixed-effects parameter which is allowed to vary across individual cross-sectional units. β1GROWTHi is a deterministic time trend specific to the individual countries in the panel. The slope coefficients (β2GROWTHi and β3GROWTHi) can vary from one country to another, allowing the cointegrating vectors to be heterogeneous across the panel members. Pedroni (2000) proposed seven different statistics for the cointegration test in the panel data setting. Since these statistics are again common in the literature, we do not provide the technical details of these statistics in this paper.4.5FMOLS and DOLS estimation
In the literature, there are a number of estimators for estimating a cointegration vector using panel data, including with- and between- group, such as ordinary least squares (OLS) estimators, fully modified OLS (FMOLS) estimators and the dynamic OLS (DOLS) estimators. Although simple OLS estimators of the cointegrated vectors are super-convergent, their distribution was found to be asymptotically biased and depends on nuisance parameters associated with the presence of serial correlation in the data (Pedroni, 2001). Many problems that exist in time-series analysis may also arise in panel data analysis and tend to be more prevalent in the presence of heteroskedasticity (Kao and Chiang, 2000). Therefore, several other estimators have been proposed in the cointegrated literature. However, this study uses two panel cointegration estimators, namely the between-group fully modified OLS (FMOLS)2 and dynamic OLS (DOLS)3. Both FMOLS and DOLS were found to give consistent estimates of standard errors, which will render them to be robust for statistical inference. According to Kao and Chiang (2000), both FMOLS and DOLS estimators have normal limiting properties. In this study, we are interested in studying the nature of the relationships (positive or negative) between the variables. Since both FMOLS and DOLS estimators are very common and readily available in most of the financial time series econometrics books, the technical details of these estimators are not included in this paper.
4.6VECM estimationEngle and Granger (1987) demonstrate that when variables are cointegrated, an error-correction model necessarily describes the data-generating process. Therefore, on the basis of the unit root and cointegration test results above, we use vector error-correction models (VECMs) to determine the causal relationships between our three sets of variables. In other words, we seek to determine which variable causes the other in the presence of the third variable. We are able to determine this causal link for both the short run and the long run. Following the methodological approach proposed by Canning and Pedroni (2008) and Holtz-Eakin et al. (1988), the panel Granger causality test is employed to ascertain the direction of causality between the three variables. The following econometric model is used:
where p is the lag lengths for the differenced variables; Δ is the first difference filter (I−L); i=1, …, N; t=1, …, T; and, ¿j (j=1, 2, 3) are independently and normally distributed random variables for all i and t, with zero means and finite heterogeneous variances (σi2).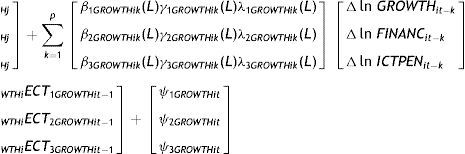
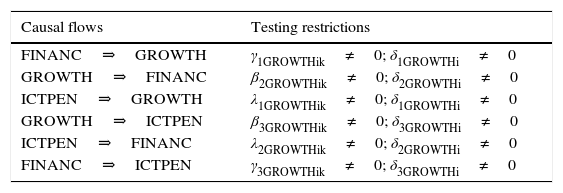
The ECTs are error-correction terms derived from the cointegrating equations. The ECTs represent long-run dynamics, while differenced variables represent short-run dynamics between the variables. We look for both short-run and long-run Granger causal relationships. Short-run Granger causal relationships are measured using F-statistics and the significance of the lagged changes in the independent variables, whereas long-run Granger causal relationships are measured using the significance of the t-test of the lagged ECTs. The coefficient δsGROWTH (for s=1, 2, 3) measures the speed of adjustment to long-term equilibrium. The higher the coefficient, the faster the adjustment to the long-run equilibrium is. Based on Eq. (4), Table 3 summarizes the testable hypotheses on causal relationships among ICT penetration, financial development, and economic growth.
Testable hypotheses.
| Causal flows | Testing restrictions |
|---|---|
| FINANC⇒GROWTH | γ1GROWTHik≠0; δ1GROWTHi≠0 |
| GROWTH⇒FINANC | β2GROWTHik≠0; δ2GROWTHi≠0 |
| ICTPEN⇒GROWTH | λ1GROWTHik≠0; δ1GROWTHi≠0 |
| GROWTH⇒ICTPEN | β3GROWTHik≠0; δ3GROWTHi≠0 |
| ICTPEN⇒FINANC | λ2GROWTHik≠0; δ2GROWTHi≠0 |
| FINANC⇒ICTPEN | γ3GROWTHik≠0; δ3GROWTHi≠0 |
Note 1: GROWTH: per capita economic growth; FINANC: composite index of financial development; and ICTPEN: ICT penetration.
Note 2: ICT penetration is measured through five individual indicators (TELLIN, MOBILE, INTUSE, INTSER, FIXBRO) and the composite index (ICTIND).
Note 3: TELLIN; telephone lines penetration; MOBILE: mobile phone penetration; INTUSE: internet user penetration; INTSERV: internet server penetration; FIXBRO: fixed broadband penetration; and ICTIND: composite index of ICT penetration.
Note 4: The definitions of these variables are in Appendix A.
We begin with a discussion of the integration and cointegration properties of the variables. The estimated results confirm that the variables are integrated of order one (see Table 4) and are cointegrated (see Table 5). This is true for all the cases that we consider (Cases 1–6). The combined results of both integration and cointegration indicate the presence of a long-run equilibrium relationship between financial development, ICT penetration, and economic growth.
Results from panel unit root test.
| Test statistics | GROWTH | FINANC | ICTPEN | ||||||
|---|---|---|---|---|---|---|---|---|---|
| NIT | INT | BIT | NIT | INT | BIT | NIT | INT | BIT | |
| Case 1: between GROWTH, FINANC, and TELLIN (1961–2012) | |||||||||
| Levine-Lin-Chu (LLC) | −14.7* | −8.90* | −6.82* | −7.91* | −2.80* | −2.26* | −11.8* | −6.51* | −4.64* |
| Maddala and Wu-Fisher ADF | 193.9* | 130.4* | 93.89* | 90.50* | 48.11* | 37.52* | 146.1* | 96.87* | 78.58* |
| Maddala and Wu-Fisher PP | 243.3* | 1438* | 1729* | 156.9* | 106.8* | 87.12* | 1244* | 454* | 366* |
| Inference | I [1] | I [1] | I [1] | ||||||
| Case 2: between GROWTH, FINANC, and MOBILE (1991–2012) | |||||||||
| Levine-Lin-Chu (LLC) | −14.6* | −9.96* | −7.39* | −8.36* | −6.57* | −4.54* | −3.88* | −3.88* | −2.37* |
| Maddala and Wu-Fisher ADF | 192.9* | 128.5 | 92.93* | 96.50* | 52.23* | 78.58* | 41.89* | 48.42* | 47.79* |
| Maddala and Wu-Fisher PP | 232.2* | 1146* | 1148* | 141.8* | 96.50* | 91.72* | 55.67* | 61.86* | 56.87* |
| Case 3: between GROWTH, FINANC, and INTUSE (1991–2012) | |||||||||
| Levine-Lin-Chu (LLC) | −13.5* | −8.68* | −6.23* | −7.08* | −5.89* | −4.37* | −6.65* | −4.53* | −3.36* |
| Maddala and Wu-Fisher ADF | 170.1* | 107.2* | 74.99* | 81.30* | 47.29* | 46.49* | 76.3* | 46.2* | 38.54* |
| Maddala and Wu-Fisher PP | 192.9* | 914.6* | 612.6* | 142.0* | 102.4* | 101.6* | 120.1* | 105.1* | 92.5* |
| Case 4: between GROWTH, FINANC, and INTSER (2001–2012) | |||||||||
| Levine-Lin-Chu (LLC) | −10.2* | −8.89* | −8.82* | −5.50* | −4.26* | −3.41* | −6.52* | −6.50* | −4.06* |
| Maddala and Wu-Fisher ADF | 106.3* | 59.79* | 37.25* | 55.9* | 41.61* | 32.34* | 61.73* | 45.44* | 50.93* |
| Maddala and Wu-Fisher PP | 169.2* | 130.9* | 97.06* | 88.6* | 90.79* | 80.79* | 64.1* | 53.29* | 41.19* |
| Case 5: between GROWTH, FINANC, and FIXBRO (2001–2012) | |||||||||
| Levine-Lin-Chu (LLC) | −9.04* | −4.44* | −3.96* | −4.43* | −3.29* | −2.70** | −20.8* | −14.0* | −13.3* |
| Maddala and Wu-Fisher ADF | 81.7* | 46.96* | 28.87** | 40.6* | 29.0** | 24.2** | 92.8* | 73.8* | 57.2* |
| Maddala and Wu-Fisher PP | 141.8* | 127.3* | 106.0* | 87.8* | 78.9* | 72.3* | 63.9* | 53.8* | 47.2* |
| Case 6: between GROWTH, FINANC, and ICTIND (2001–2012) | |||||||||
| Levine-Lin-Chu (LLC) | −7.36* | −5.87* | −3.92* | −5.12* | −4.65* | −2.29** | −7.63* | −3.26* | −2.40** |
| Maddala and Wu-Fisher ADF | 66.7* | 30.72** | 25.9** | 46.3* | 38.55* | 28.32** | 61.38* | 32.14* | 23.28** |
| Maddala and Wu-Fisher PP | 131.4* | 91.09* | 76.67* | 76.28* | 57.79* | 54.71* | 103.1* | 80.68* | 69.4* |
Note 1: GROWTH: per capita economic growth; FINANC: financial development; TELLIN; telephone lines penetration; MOBILE: mobile phone penetration; INTUSE: internet user penetration; INTSERV: internet server penetration; FIXBRO: fixed broadband penetration; ICTIND: composite index of ICT penetration; ADF: Augmented Dickey Fuller; and PP: Phillips and Perron.
Note 2: The figures are reported here at the first difference level.
Note 3: NIT is no trend and intercept, INT is intercept only, and BIT is both intercept and trend.
Results of Pedroni panel cointegration test.
| Test statistics | No Intercept | With Intercept | With Intercept & trend | |||
|---|---|---|---|---|---|---|
| Case 1: between GROWTH, FINANC, and TELLIN (1961–2012) | ||||||
| Panel v-statistics | −0.50 | [0.69] | −1.36 | [0.91] | −3.54 | [0.99] |
| Panel ρ-statistics | −5.96* | [0.00] | −5.55* | [0.00] | −3.48* | [0.00] |
| Panel PP-statistics | −7.31* | [0.00] | −8.86* | [0.00] | −8.97* | [0.00] |
| Panel ADF-statistics | −4.17* | [0.00] | −4.63* | [0.00] | −3.88* | [0.00] |
| Group ρ-statistics | −3.68* | [0.00] | −2.78* | [0.00] | −0.99 | [0.16] |
| Group PP-statistics | −8.25* | [0.00] | −10.6* | [0.00] | −11.2* | [0.00] |
| Group ADF-statistics | −3.58* | [0.00] | −4.81* | [0.00] | −3.73* | [0.00] |
| Inference | Cointegrated | |||||
| Case 2: between GROWTH, FINANC, and MOBILE (1991–2012) | ||||||
| Panel v-statistics | 2.07** | [0.02] | −1.13 | [0.12] | −1.49 | [0.93] |
| Panel ρ-statistics | −6.14* | [0.00] | −5.37* | [0.00] | −3.24* | [0.00] |
| Panel PP-statistics | −7.56* | [0.00] | −8.67* | [0.00] | −9.37* | [0.00] |
| Panel ADF-statistics | −4.57* | [0.00] | −4.53* | [0.00] | −4.70* | [0.00] |
| Group ρ-statistics | −4.04* | [0.00] | −2.18* | [0.00] | −0.27 | [0.39] |
| Group PP-statistics | −9.24* | [0.00] | −11.6* | [0.00] | −14.2* | [0.00] |
| Group ADF-statistics | −5.62* | [0.00] | −5.26* | [0.00] | −4.52* | [0.00] |
| Inference | Cointegrated | |||||
| Case 3: between GROWTH, FINANC, and INTUSE (1991–2012) | ||||||
| Panel v-statistics | −0.62 | [0.27] | −0.43 | [0.66] | −2.59 | [0.99] |
| Panel ρ-statistics | −4.77* | [0.00] | −3.94* | [0.00] | −3.43* | [0.00] |
| Panel PP-statistics | −6.98* | [0.00] | −7.27* | [0.00] | −10.5* | [0.00] |
| Panel ADF-statistics | −4.43* | [0.00] | −3.74* | [0.00] | −5.24* | [0.00] |
| Group ρ-statistics | −2.25* | [0.00] | −0.90 | [0.18] | −0.97 | [0.83] |
| Group PP-statistics | −7.41* | [0.00] | −8.90* | [0.00] | −11.6* | [0.00] |
| Group ADF-statistics | −5.17* | [0.00] | −4.01* | [0.00] | −3.65* | [0.00] |
| Inference | Cointegrated | |||||
| Case 4: between GROWTH, FINANC, and INTSER (2001–2012) | ||||||
| Panel v-statistics | −0.46 | [0.67] | −1.21 | [0.91] | −3.24 | [0.99] |
| Panel ρ-statistics | −2.88* | [0.01] | 0.14 | [0.56] | 1.75 | [0.96] |
| Panel PP-statistics | −4.34* | [0.00] | −4.32* | [0.00] | −2.87* | [0.00] |
| Panel ADF-statistics | −2.62* | [0.00] | −3.26* | [0.00] | −0.97 | [0.16] |
| Group ρ-statistics | 0.48 | [0.69] | 1.80 | [0.96] | 3.03 | [0.96] |
| Group PP-statistics | −6.25* | [0.00] | −7.00* | [0.00] | −7.64* | [0.00] |
| Group ADF-statistics | −3.95* | [0.00] | −3.07* | [0.00] | −1.59** | [0.05] |
| Inference | Cointegrated | |||||
| Case 5: between GROWTH, FINANC, and FIXBRO (2001–2012) | ||||||
| Panel v-statistics | −0.61 | [0.72] | −1.33 | [0.90] | −3.04 | [0.99] |
| Panel ρ-statistics | −2.58* | [0.00] | −1.94** | [0.03] | 0.89 | [0.81] |
| Panel PP-statistics | −4.78* | [0.00] | 6.01 | [0.00] | −6.01* | [0.00] |
| Panel ADF-statistics | −1.94 | [0.02] | −1.79** | [0.05] | −2.71* | [0.00] |
| Group ρ-statistics | 0.13 | [0.55] | 0.47 | [0.68] | 2.02 | [0.97] |
| Group PP-statistics | −4.86* | [0.00] | −8.20* | [0.00] | −13.6* | [0.00] |
| Group ADF-statistics | −2.42* | [0.00] | −2.27* | [0.01] | −3.64* | [0.00] |
| Inference | Cointegrated | |||||
| Case 6: between GROWTH, FINANC, and ICTIND (2001–2012) | ||||||
| Panel v-statistics | −0.87 | [0.80] | −1.68 | [0.95] | −3.40 | [0.99] |
| Panel ρ-statistics | −1.08 | [0.14] | 0.61 | [0.73] | 2.42 | [0.99] |
| Panel PP-statistics | −3.12* | [0.00] | −2.53* | [0.01] | −1.84** | [0.03] |
| Panel ADF-statistics | −2.14* | [0.00] | −1.35 | [0.09] | −0.66 | [0.25] |
| Group ρ-statistics | 1.18 | [0.88] | 1.99 | [0.98] | 2.73 | [0.99] |
| Group PP-statistics | −4.71* | [0.00] | −6.17* | [0.00] | −8.92* | [0.00] |
| Group ADF-statistics | −3.90* | [0.00] | −2.28** | [0.05] | −2.20* | [0.01] |
| Inference | Cointegrated | |||||
Note 1: GROWTH: per capita economic growth; FINANC: financial development; TELLIN; telephone lines penetration; MOBILE: mobile phone penetration; INTUSE: internet user penetration; INTSERV: internet server penetration; FIXBRO: fixed broadband penetration; and ICTIND: composite index of ICT penetration.
Note 2: Figures in square brackets are probability levels indicating significance.
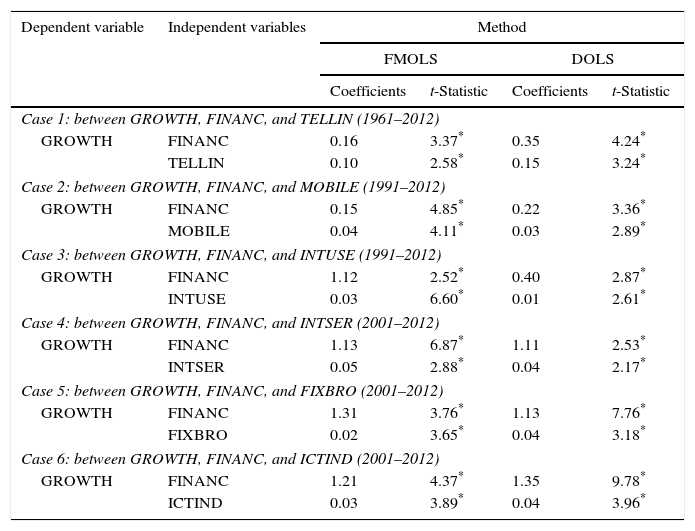
Having confirmed the existence of cointegration, the next step is to estimate the associated long-run cointegration parameters by FMOLS and DOLS procedures. The estimated results are presented in Table 6. The results indicate that economic growth is significantly influenced by both financial development and ICT penetration. This is again true for all six cases (Cases 1–6 as shown in Table 6).
Panel FMOLS and DOLS results.
| Dependent variable | Independent variables | Method | |||
|---|---|---|---|---|---|
| FMOLS | DOLS | ||||
| Coefficients | t-Statistic | Coefficients | t-Statistic | ||
| Case 1: between GROWTH, FINANC, and TELLIN (1961–2012) | |||||
| GROWTH | FINANC | 0.16 | 3.37* | 0.35 | 4.24* |
| TELLIN | 0.10 | 2.58* | 0.15 | 3.24* | |
| Case 2: between GROWTH, FINANC, and MOBILE (1991–2012) | |||||
| GROWTH | FINANC | 0.15 | 4.85* | 0.22 | 3.36* |
| MOBILE | 0.04 | 4.11* | 0.03 | 2.89* | |
| Case 3: between GROWTH, FINANC, and INTUSE (1991–2012) | |||||
| GROWTH | FINANC | 1.12 | 2.52* | 0.40 | 2.87* |
| INTUSE | 0.03 | 6.60* | 0.01 | 2.61* | |
| Case 4: between GROWTH, FINANC, and INTSER (2001–2012) | |||||
| GROWTH | FINANC | 1.13 | 6.87* | 1.11 | 2.53* |
| INTSER | 0.05 | 2.88* | 0.04 | 2.17* | |
| Case 5: between GROWTH, FINANC, and FIXBRO (2001–2012) | |||||
| GROWTH | FINANC | 1.31 | 3.76* | 1.13 | 7.76* |
| FIXBRO | 0.02 | 3.65* | 0.04 | 3.18* | |
| Case 6: between GROWTH, FINANC, and ICTIND (2001–2012) | |||||
| GROWTH | FINANC | 1.21 | 4.37* | 1.35 | 9.78* |
| ICTIND | 0.03 | 3.89* | 0.04 | 3.96* | |
Note. GROWTH: per capita economic growth; FINANC: financial development; TELLIN; telephone lines penetration; MOBILE: mobile phone penetration; INTUSE: internet user penetration; INTSERV: internet server penetration; FIXBRO: fixed broadband penetration; and ICTIND: composite index of ICT penetration.
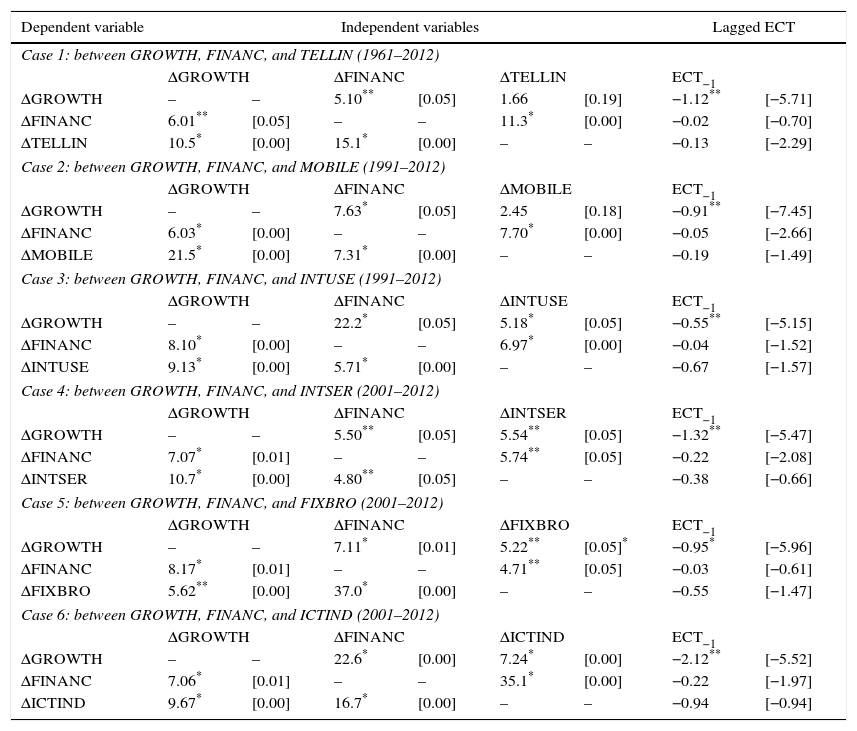
After confirming cointegration, the next step is to check the direction of causality between these three variables. The panel Granger causality test, based on the panel vector error-correction model, is used for this purpose. Table 7 presents the Granger causal relationships among the variables based on the estimation of Eq. (4). These results are summarized below.
Panel Granger causality test results.
| Dependent variable | Independent variables | Lagged ECT | ||||||
|---|---|---|---|---|---|---|---|---|
| Case 1: between GROWTH, FINANC, and TELLIN (1961–2012) | ||||||||
| ΔGROWTH | ΔFINANC | ΔTELLIN | ECT−1 | |||||
| ΔGROWTH | – | – | 5.10** | [0.05] | 1.66 | [0.19] | −1.12** | [−5.71] |
| ΔFINANC | 6.01** | [0.05] | – | – | 11.3* | [0.00] | −0.02 | [−0.70] |
| ΔTELLIN | 10.5* | [0.00] | 15.1* | [0.00] | – | – | −0.13 | [−2.29] |
| Case 2: between GROWTH, FINANC, and MOBILE (1991–2012) | ||||||||
| ΔGROWTH | ΔFINANC | ΔMOBILE | ECT−1 | |||||
| ΔGROWTH | – | – | 7.63* | [0.05] | 2.45 | [0.18] | −0.91** | [−7.45] |
| ΔFINANC | 6.03* | [0.00] | – | – | 7.70* | [0.00] | −0.05 | [−2.66] |
| ΔMOBILE | 21.5* | [0.00] | 7.31* | [0.00] | – | – | −0.19 | [−1.49] |
| Case 3: between GROWTH, FINANC, and INTUSE (1991–2012) | ||||||||
| ΔGROWTH | ΔFINANC | ΔINTUSE | ECT−1 | |||||
| ΔGROWTH | – | – | 22.2* | [0.05] | 5.18* | [0.05] | −0.55** | [−5.15] |
| ΔFINANC | 8.10* | [0.00] | – | – | 6.97* | [0.00] | −0.04 | [−1.52] |
| ΔINTUSE | 9.13* | [0.00] | 5.71* | [0.00] | – | – | −0.67 | [−1.57] |
| Case 4: between GROWTH, FINANC, and INTSER (2001–2012) | ||||||||
| ΔGROWTH | ΔFINANC | ΔINTSER | ECT−1 | |||||
| ΔGROWTH | – | – | 5.50** | [0.05] | 5.54** | [0.05] | −1.32** | [−5.47] |
| ΔFINANC | 7.07* | [0.01] | – | – | 5.74** | [0.05] | −0.22 | [−2.08] |
| ΔINTSER | 10.7* | [0.00] | 4.80** | [0.05] | – | – | −0.38 | [−0.66] |
| Case 5: between GROWTH, FINANC, and FIXBRO (2001–2012) | ||||||||
| ΔGROWTH | ΔFINANC | ΔFIXBRO | ECT−1 | |||||
| ΔGROWTH | – | – | 7.11* | [0.01] | 5.22** | [0.05]* | −0.95* | [−5.96] |
| ΔFINANC | 8.17* | [0.01] | – | – | 4.71** | [0.05] | −0.03 | [−0.61] |
| ΔFIXBRO | 5.62** | [0.00] | 37.0* | [0.00] | – | – | −0.55 | [−1.47] |
| Case 6: between GROWTH, FINANC, and ICTIND (2001–2012) | ||||||||
| ΔGROWTH | ΔFINANC | ΔICTIND | ECT−1 | |||||
| ΔGROWTH | – | – | 22.6* | [0.00] | 7.24* | [0.00] | −2.12** | [−5.52] |
| ΔFINANC | 7.06* | [0.01] | – | – | 35.1* | [0.00] | −0.22 | [−1.97] |
| ΔICTIND | 9.67* | [0.00] | 16.7* | [0.00] | – | – | −0.94 | [−0.94] |
Note. GROWTH: per capita economic growth; FINANC: financial development; TELLIN; telephone lines penetration; MOBILE: mobile phone penetration; INTUSE: internet user penetration; INTSERV: internet server penetration; FIXBRO: fixed broadband penetration; and ICTIND: composite index of ICT penetration.
From Table 7, when ΔGROWTH serves as the dependent variable, the lagged error-correction term is statistically significant at the 1% level. This implies that economic growth tends to converge to its long-run equilibrium path in response to changes in its regressors, namely ICT penetration and financial development.
The estimated lagged ECT (in all situations: Cases 1–6) carries a negative sign. This implies that the change in the level of economic growth (ΔGROWTH) does in fact rapidly respond to any deviation in the long-run equilibrium (or short-run disequilibrium) for the t−1 period. In other words, the effect of an instantaneous shock to ICT penetration and financial development on economic growth will be completely adjusted in the long run.
The speeds of adjustment between GROWTH, FINANC and ICTPEN in these six cases vary between 0.55% and 2.12%. However, when we considered ΔFINANC or ΔICTPEN as the dependent variable, the ECTs are not statistically significant. The statistical insignificance of the ECTs suggests that economic growth (or FINANC or ICTPEN) does not respond to deviations from long-run equilibrium.
5.2Short-run Granger causality results5.2.1Dynamics between financial development and economic growthWe find evidence of bidirectional causality between financial development and economic growth for all the cases (see Table 8, Cases 1–6). This supports the feedback hypothesis of finance-growth nexus and is consistent with the findings of Chow and Fung (2011), Dritsakis and Adamopoulos (2004), Pradhan et al. (2014a,b), Uddin et al. (2014), and Wolde-Rufael (2009) for the various regions and countries that they study.
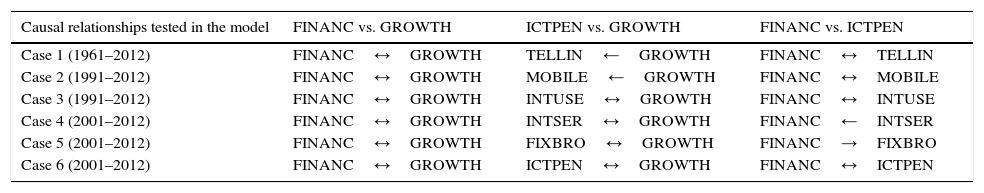
The summary of short-run inference between ICT penetration, financial development and economic growth in the Next-11 countries.
| Causal relationships tested in the model | FINANC vs. GROWTH | ICTPEN vs. GROWTH | FINANC vs. ICTPEN |
|---|---|---|---|
| Case 1 (1961–2012) | FINANC↔GROWTH | TELLIN←GROWTH | FINANC↔TELLIN |
| Case 2 (1991–2012) | FINANC↔GROWTH | MOBILE←GROWTH | FINANC↔MOBILE |
| Case 3 (1991–2012) | FINANC↔GROWTH | INTUSE↔GROWTH | FINANC↔INTUSE |
| Case 4 (2001–2012) | FINANC↔GROWTH | INTSER↔GROWTH | FINANC←INTSER |
| Case 5 (2001–2012) | FINANC↔GROWTH | FIXBRO↔GROWTH | FINANC→FIXBRO |
| Case 6 (2001–2012) | FINANC↔GROWTH | ICTPEN↔GROWTH | FINANC↔ICTPEN |
Note 1: GROWTH: per capita economic growth; FINANC: financial development; TELLIN; telephone lines penetration; MOBILE: mobile phone penetration; INTUSE: internet user penetration; INTSERV: internet server penetration; FIXBRO: fixed broadband penetration; and ICTIND: composite index of ICT penetration.
Note 2: → or ←: unidirectional causality in one direction or another; ↔: bidirectional causality.
Here, we find evidence of both bidirectional and unidirectional causality between ICT penetration and economic growth. The bidirectional causality is visible between INTUSE and GROWTH, INTSER and GROWTH, FIXBRO and GROWTH and ICTPEN and GROWTH (see Table 8, Cases 3–8). This supports the feedback hypothesis of ICT-growth nexus and is congruent with the findings of Arvin and Pradhan (2014), Chakraborty and Nandi (2009, 2011), Cronin et al. (1991), Lam and Shiu (2010), Pradhan et al. (2013b), Shiu and Lam (2008a, b), Wolde-Rufael (2007), and Zahra et al. (2008) for the various regions and countries that they study.
In addition, the study finds unidirectional causality between TELLIN and GROWTH and MOBILE and GROWTH (see Table 8, Cases 1–2). This supports the demand-following hypothesis of ICT-growth nexus and is consistent with the findings of Beil et al. (2005), Lee et al. (2012), Pradhan et al. (2013b), and Shiu and Lam (2008a,b) for the various regions and countries that they study.
The above analysis suggests that as income levels increase, the demand for all the ICTs will be on an upward trend. The empirical results also show that ICTs that provide ubiquitous high speed connectivity tend to provide a more effective platform for economic agents to pursue economies of scale and scope. This will result in improved economic productivity and economic growth, thus supporting the feedback hypothesis.
5.2.3Dynamics between ICT penetration and financial developmentThe empirical evidence suggests both bidirectional and unidirectional causality between ICT penetration and financial development. Bidirectional causality is visible between FINANC and TELLIN, FINANC and MOBILE, FINANC and INTUSE and FINANC and ICTPEN (see Table 8, Cases 1–3 & Case 6). This supports the feedback hypothesis of ICT penetration-financial development nexus and is consistent with the findings of Pandey (2014).
In addition, the study also finds unidirectional causality between FINANC and INTSER and FINANC and FIXBRO (see Table 8, Cases 4–5). This supports both the demand-following hypothesis of ICT penetration-financial development nexus (INTSER⇒FINANC) and the supply-leading hypothesis of ICT penetration-financial development nexus (FIXBRO⇐FINANC). These results are congruent with the findings of Pandey (2014).
5.3Assessing shocks using generalized impulse response functionsThe generalized impulse response functions (GIRFs) approach is used to trace the effect of a one-off shock to one of the data series on the current and future values of the series. The GIRFs can also be used to summarize the direction of causal patterns in a cointegrated system and to justify the strength of the causal relationships among these variables (Riezman et al., 1996). In this context, we will examine the impact of shocks to ICT penetration and financial development onto economic growth. This analysis provides additional support for the finding that there is demonstrated causality among a subset of variables in our vector error-correction model. The results of these GRIFs are graphed in Figs. 2–7. Our discussion of the impulse response functions mainly centers on the responses of ICT penetration, financial development and per capita economic growth to their own and other shocks.


The paper examined the short-term and long-term dynamics between ICT penetration rates, financial sector development and economic growth for 11 countries over 6 sample time periods. The causal relationships between ICT penetration and economic growth in the short run vary depending on the types of ICTs. The more sophisticated ICTs, such as internet uses, internet servers and fixed broadband, seem to support the feedback hypothesis, while the traditional ICTs, such as telephone lines and mobile phones, are impacted by economic growth. In the case of the causal relationship between financial development and economic growth, the empirical analysis shows that they reinforce one another.
Similar results were obtained for ICT (telephone line penetration, mobile phone and internet use) and financial sector development. However, internet server penetration was found to have a significant impact on financial sector development and not vice versa. This is not surprising as many of the new financial instruments and services are highly dependent on internet services. On the other hand, increasing financial sector development seems to increase the demand for higher speed internet, hence financial sector development was found to impact fixed broadband penetration.
The study also found that there is a long-run relationship between the different types of ICT penetration (telephone line penetration, mobile phone penetration, internet use penetration, internet server penetration, fixed broadband penetration and the composite ICT indicator), financial development and economic growth. The empirical analysis shows that causality relationships are from ICT penetration and financial sector development to economic growth.
The empirical analysis suggests that there is a close linkage between ICT penetration and financial sector development, with one reinforcing the other. As both the financial and ICT sectors become increasingly integrated, this will result in more sophisticated, user-friendly and value-creating financial products and services. This, in turn, will increase the reach of new financial services to a wider segment of the population, resulting in higher economic growth. Hence, to ensure long-term economic growth, there should be adequate investments and incentives to develop viable electronic financial ecosystems that reinforce greater ICT penetration rates and enhance wealth creation opportunities for all economic agents. Among the key investments and incentives include the following:
- •
Adequate investment for ICT infrastructure development, including expanding network coverage to rural and remote communities;
- •
Subsidies and tax-incentives to ensure ICT services are affordable for disadvantaged communities;
- •
Access to ICT literacy and electronic training programs that will enable all segments of the population to use the digital platform to access electronic financial services and other e-services to improve their socioeconomic wellbeing; and
- •
Development of a sound regulatory environment that ensures good governance of the digital platform to prevent market failures such as cybercrimes and other online criminal activities that hinder investor and user confidence.
In summary, the global economic landscape is undergoing rapid transformation powered by new innovations in the ICT and financial sectors. Increasing integration of ICT platforms and financial services is having a deeper impact on long-term economic growth of countries. For these reasons, development plans should include strategies to increase ICT penetration rates and development of modern electronic financial systems that can have a greater multiplier impact on national economic wealth. Effective policy measures that ensure sustainable economic development have been introduced in the hope of advancing the reinforcement of ICT penetration and financial sector development.
The constructive suggestions from a referee of this journal are gratefully acknowledged.
Definition of financial development variables.
| Variables | Definition |
|---|---|
| FINANC | Composite index of financial development: based on nine financial development indicators: broad money supply, claims on the private sector, domestic credit to the private sector, domestic credit provided by the banking sector, domestic credit provided by the financial sector, market capitalization, traded stocks, turnover ratio, and number of listed companies–derived through principal component analysis. |
| BMONEY | Broad money supply, expressed as a % of gross domestic product. |
| CLAIMS | Claims on the private sectors, expressed as a % of gross domestic product. |
| DCBANK | Domestic credit provided by the banking sector, expressed as a % of gross domestic product. |
| DCPRIS | Domestic credit to the private sector, expressed as a % of gross domestic product. |
| DCFINS | Domestic credit provided by the financial sector, expressed as a % of gross domestic product. |
| SMACAP | Market capitalization, expressed as a % change in the market capitalization of the listed companies, used as a proxy for the evolution in the size of the stock market. |
| STMTRS | Traded stocks, expressed as a % change in the total value of traded stocks, used as a proxy for the evolution in stock market liquidity. |
| STMTUR | Turnover ratio, expressed as a % change in the turnover ratio in the stock market, used as a proxy for the evolution in stock market turnover. |
| NLCOMP | Number of listed companies, expressed as number of listed companies per 10,000 population. |
Note 1: All monetary measures are in real US dollars.
Note 2: The variables are chosen on the basis of data availability in the chosen Next-11 countries. Additionally, these nine variables are popular measures of financial development, particularly with reference to both banking sector development and stock markets development.
Note 3: See Pradhan et al. (2014c,d) and WDI for more details about these variables.
Definition of ICT penetration and growth variables.
| Variables | Definition |
|---|---|
| ICTIND | Composite index of ICT penetration: based on a composite index derived – using principal component analysis and five individual ICT indicators: telephone line penetration, mobile phone penetration, internet user penetration, internet server penetration, and fixed broadband penetration |
| TELLIN | Telephone line penetration: telephone landlines per thousand of population. |
| MOBILE | Mobile phone penetration: mobile phone subscribers per thousand of population. |
| INTUSE | Internet user penetration: internet users per thousand of population. |
| INTSER | Internet server penetration: internet servers per thousand of population. |
| FIXBRO | Fixed broadband penetration: Fixed broadband per thousand of population. |
| GROWTH | Per capita economic growth, expressed as a % change in per capita gross domestic product, used as an indicator of economic growth. |
Note 1: ICT denotes Information Communication Technology.
Note 2: The ICT penetration variables are chosen on the basis of data availability in the chosen Next-11 countries.
Note 3: See Pradhan et al. (2014a,b) and WDI for additional information on these variables.
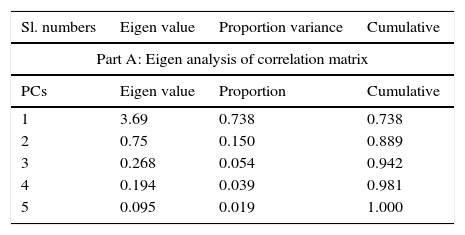
We construct a composite index of ICT penetration, hereafter denoted by ‘ICTIND’ and a composite index of financial development, henceforth denoted by ‘FINANC’. These indices are derived through principal component analysis using the following steps44 A weakness of PCA is that it is a non-parametric approach. The estimation method is data-driven and is not dependent on the predilections of the users. Furthermore, PCA does not take into account any a-priori knowledge, as alternative parametric algorithms do. It also deals with linear relationships between the variables. Not surprisingly and evidently, PCA has limitations – just as every estimation procedure does – such as scaling problems, interpretation problems, and higher correlation problems.
The summary of PCA-related information for ICT penetration.
| Sl. numbers | Eigen value | Proportion variance | Cumulative |
|---|---|---|---|
| Part A: Eigen analysis of correlation matrix | |||
| PCs | Eigen value | Proportion | Cumulative |
| 1 | 3.69 | 0.738 | 0.738 |
| 2 | 0.75 | 0.150 | 0.889 |
| 3 | 0.268 | 0.054 | 0.942 |
| 4 | 0.194 | 0.039 | 0.981 |
| 5 | 0.095 | 0.019 | 1.000 |
| Part B: Eigen vectors (component loadings) | |||||
|---|---|---|---|---|---|
| Variables | PC1 | PC 2 | PC 3 | PC 4 | PC 5 |
| TELLIN | 0.355 | −0.811 | 0.314 | −0.153 | −0.307 |
| MOBILE | 0.420 | 0.582 | 0.496 | −0.251 | −0.420 |
| INTUSE | 0.480 | 0.045 | −0.144 | 0.853 | −0.137 |
| INTSER | 0.467 | 0.038 | −0.767 | −0.416 | −0.137 |
| FIXBRO | 0.499 | 0.008 | 0.216 | −0.111 | 0.832 |
Note 1: PCs denotes principal components.
Note 2: TELLIN: telephone line penetration; MOBILE: mobile phone penetration; INTUSE: internet user penetration; INTSER: internet server penetration; and FIXBRO: fixed broadband penetration.
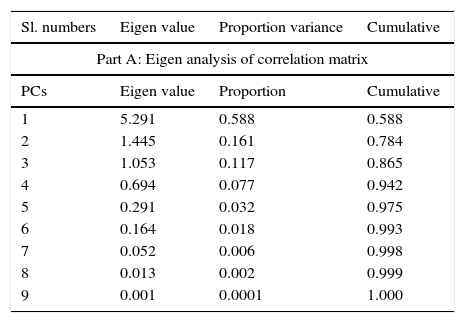
The summary of PCA-related information for financial development.
| Sl. numbers | Eigen value | Proportion variance | Cumulative |
|---|---|---|---|
| Part A: Eigen analysis of correlation matrix | |||
| PCs | Eigen value | Proportion | Cumulative |
| 1 | 5.291 | 0.588 | 0.588 |
| 2 | 1.445 | 0.161 | 0.784 |
| 3 | 1.053 | 0.117 | 0.865 |
| 4 | 0.694 | 0.077 | 0.942 |
| 5 | 0.291 | 0.032 | 0.975 |
| 6 | 0.164 | 0.018 | 0.993 |
| 7 | 0.052 | 0.006 | 0.998 |
| 8 | 0.013 | 0.002 | 0.999 |
| 9 | 0.001 | 0.0001 | 1.000 |
| Part B: Eigen vectors (component loadings) | |||||||||
|---|---|---|---|---|---|---|---|---|---|
| Variables | PC1 | PC 2 | PC 3 | PC4 | PC 5 | PC6 | PC7 | PC 8 | PC 9 |
| BMONEY | 0.394 | 0.217 | 0.204 | −0.001 | 0.254 | 0.373 | 0.722 | −0.024 | −0.176 |
| CLAIMS | 0.089 | 0.439 | −0.659 | 0.547 | −0.186 | 0.177 | −0.020 | 0.002 | −0.001 |
| DCPRIS | 0.395 | 0.279 | 0.118 | 0.011 | −0.006 | −0.520 | −0.222 | −0.027 | −0.657 |
| DCBANK | 0.396 | 0.284 | 0.125 | −0.009 | −0.066 | −0.467 | 0.103 | 0.009 | 0.717 |
| DCFINS | 0.401 | 0.149 | 0.145 | −0.087 | 0.320 | 0.503 | −0.641 | 0.039 | 0.143 |
| SMACAP | 0.219 | −0.525 | 0.152 | 0.668 | 0.193 | −0.106 | −0.001 | 0.399 | 0.013 |
| STMTRS | 0.330 | −0.453 | −0.327 | −0.005 | 0.158 | −0.071 | 0.012 | −0.740 | 0.029 |
| STMTUR | 0.281 | −0.220 | −0.563 | −0.494 | 0.092 | −0.068 | 0.084 | 0.538 | −0.031 |
| NLCOMP | 0.357 | −0.226 | 0.161 | −0.055 | −0.85 | 0.258 | −0.016 | 0.018 | −0.045 |
Note 1: PCs denotes principal components.
Note 2: BMONEY: broad money supply; CLAIMS: claims on the private sector; DCPRIS: domestic credit to the private sector; DCBANK: domestic credit provided by the banking sector; DCFINS: domestic credit provided by the financial sector; SMACAP: stock market capitalization; STMTRS: stock market traded stocks; STMTUR: stock market turnover ratio; and NLCOMP: number of listed companies.
 infrastructure and economic growth: the duality.")
Information and communications technologies (ICT) infrastructure and economic growth: the duality.
ICT penetration (ICTPEN) is measured by telephone line penetration (TELLIN), mobile phone penetration (MOBILE), internet user penetration (INTUSE), internet server penetration (INTSER), fixed broadband penetration (FIXBRO) and a composite indicator of the ICT measure (ICTIND).
FMOLS is a non-parametric approach, which takes into account the possible correlation between the error term and the first differences of the regressors, as well as the presence of a constant term, to deal with corrections for serial correlation (Maeso-Fernandez et al., 2006; Pedroni, 2001).
DOLS is a parametric approach, which adjusts the errors by augmenting the static regression with leads, lags, and contemporaneous values of the regressor in first differences (Mark and Sul, 2003; Kao and Chiang, 2000).
A weakness of PCA is that it is a non-parametric approach. The estimation method is data-driven and is not dependent on the predilections of the users. Furthermore, PCA does not take into account any a-priori knowledge, as alternative parametric algorithms do. It also deals with linear relationships between the variables. Not surprisingly and evidently, PCA has limitations – just as every estimation procedure does – such as scaling problems, interpretation problems, and higher correlation problems.