


The aims of this study were to determine the crude age-and sex-adjusted prevalence rates of diabetes mellitus (DM), type 1 DM (DM1) and type 2 DM (DM2), and to compare the relationship with cardiovascular risk factors, cardiovascular diseases, chronic kidney disease and metabolic diseases among populations with and without DM.
MethodsSIMETAP-DM is a cross-sectional observational study conducted in a primary care setting, with a random population-based sample of 10,579 adults. Response rate: 66%. The diagnoses of DM, DM1 and DM2 were based on clinical and biochemical criteria and/or the checking of these diagnoses in medical records. The crude and age- and sex-adjusted prevalence rates (standardised with the Spanish population) were calculated.
ResultsThe crude prevalence rates of DM1, DM2 and DM were 0.87% (95% confidence interval [95% CI]: 0.67–1.13), 14.7% (95% CI: 13.9–15.6) and 15.6% (95% CI: 14.7–16.5), respectively. The age- and sex-adjusted prevalence rates of DM1, DM2 and DM were 1.0% (1.3% for men and 0.7% for women), 11.5% (13.6% for men and 9.7% for women) and 12.5% (14.9% for men and 10.5% for women), respectively. The prevalence of DM in the population ≥70 years was double (30.3% [95% CI: 28.0–32.7]) that of the population between 40 and 69 years old (15.3% [95% CI: 14.1–16.5%]). Hypertension, peripheral arterial disease, increased weight-to-height ratio, albuminuria, coronary heart disease, atherogenic dyslipidaemia and hypercholesterolaemia were associated with DM.
ConclusionsIn a Spanish primary care setting, the age-adjusted prevalences of DM1, DM2 and DM in the adult population were 1.0, 11.5 and 12.5%, respectively. A third of the population over 70 years old suffered from DM.
Los objetivos del estudio fueron determinar las tasas de prevalencia crudas y ajustadas por edad y sexo de diabetes mellitus (DM), DM tipo-1 (DM1), y DM tipo-2 (DM2), y comparar la asociación de factores de riesgo cardiovascular, enfermedades cardiovasculares, enfermedad renal crónica, y enfermedades metabólicas entre las poblaciones con y sin DM.
MétodosSIMETAP-DM es un estudio observacional transversal realizado en atención primaria, con una muestra aleatoria de base poblacional de 10.579 adultos. Tasa de respuesta: 66%. Los diagnósticos de DM, DM1 y DM2 se basaron en criterios clínicos y bioquímicos y/o en la comprobación de estos diagnósticos en las historias clínicas. Se determinaron las prevalencias crudas y ajustadas por edad y sexo (estandarizadas con la población española).
ResultadosLas prevalencias crudas de DM1, DM2, y DM fueron 0,87% (intervalo confianza 95% [IC]: 0,67–1,13%), 14.7% (IC: 13,9–15,6%), y 15.6% (IC: 14,7–16,5%), respectivamente. Las prevalencias ajustadas por edad y sexo de DM1, DM2, y DM fueron 1.0% (1.3% [hombres]; 0.7% [mujeres]), 11.5% (13.6% [hombres]; 9.7% [mujeres]), y 12.5% (14.9% [hombres]; 10.5% [mujeres]), respectivamente. La prevalencia de DM en la población ≥70 años era el doble (30.3% [IC: 28,0–32,7%]) que en la población entre 40 y 69 años (15.3% [IC: 14,1–16,5%]). La hipertensión arterial, enfermedad arterial periférica, índice cintura-talla aumentado, albuminuria, enfermedad coronaria, dislipidemia aterogénica y la hipercolesterolemia se asociaban con la DM.
ConclusionesEn el ámbito de la atención primaria española, las prevalencias ajustadas por edad de DM1, DM2 y DM en la población adulta fueron 1.0%, 11.5% y 12.5%, respectivamente. Un tercio de la población mayor de 70 años padecía DM.
Diabetes mellitus (DM) is associated with a high or very high cardiovascular risk (CVR). The main cause of morbidity and mortality in patients with DM is cardiovascular disease (CVD). It is estimated that its presence triples the risk of cardiovascular mortality and doubles the risk of total mortality compared to the population without DM.1 These data are magnified by the constant increase in their prevalence and the health expenditure caused.
The risk of stroke, coronary heart disease (CHD) or cardiovascular death could be reduced in patients with DM if the objectives of controlling smoking, blood pressure, albuminuria, glycosylated haemoglobin A1c (HbA1c) and low density lipoprotein cholesterol (LDL_C) were met.2
In 2015, the International Diabetes Federation estimated that the prevalence of DM in the world population from 20 to 79 years old was 8.8% and that it generated an expenditure of 673 billion dollars. It is estimated that there are currently 451 million adults with DM and that it causes 5 million deaths. By 2040, it is expected that 10.4% of the world population (642 million people) will have DM and that it will generate a health expenditure of 802 billion dollars.3
The European Health Interview Survey4 showed a progressive trend in the prevalence of DM in the Spanish population over the age of 14, increasing from 4.1% in 1993 to almost 7% in the last two surveys of 2011 and 2014. When comparing data from the European Health Interview Survey4 with the prevalence rates of DM of the DARIOS5 (13%) and Di@bet.es6 (13.8%) studies, It can be deduced that about half of the patients with DM do not know that they have this condition.
Assuming a prevalence of DM of 7.8%, the SECCAID study7 calculated in 2013 that the direct costs of DM in Spain were 5.809 million euros, and that the costs of DM in primary care (consumption of test strips, quarterly HbA1c determinations, an annual ophthalmology visit, eight annual nursing visits and four with the family doctor) were 1.463 million euros.
The main actions for the prevention of CVD are lifestyle interventions, along with the detection and control of cardiovascular risk factors (CVRF). CVRF prevalence studies are necessary to improve cardiovascular prevention activities, properly plan the necessary health resources, monitor and evaluate the strategies aimed at achieving the objectives established in the Global Action Plan for non-communicable diseases.8
The objectives of the SIMETAP-DM study were to determine the current prevalence rates adjusted for age and sex of DM, type 1 DM (DM1) and type 2 DM (DM2) in the adult population aged 18 or over in a Spanish primary care setting and to compare the association of CVRF, CVD, chronic kidney disease (CKD) and metabolic diseases among populations with and without DM.
Materials and methodsThe SIMETAP-DM study is a cross-sectional observational study conducted by 121 family doctors from 64 primary care centres of the Madrid Health Service (SERMAS), selected competitively to reach the necessary sample size. The SIMETAP-DM study is included in the SIMETAP study, which was carried out in accordance with the Code of Ethics of the World Medical Association (Declaration of Helsinki) and was approved by the Research Committee of the Primary Care Management of SERMAS. The financing of the SIMETAP study (code 05/2010RS) was granted by the "Pedro Laín Entralgo" Agency of Training, Research and Health Studies of the Community of Madrid, for the conduct of research projects in the field of health outcomes in primary care. Informed consent was obtained from all study subjects. The materials and methods (design, sampling, screening, inclusion and exclusion criteria of the study subjects, data collection and statistical analysis) of the SIMETAP study have been detailed previously in this journal.9
Simple random sampling was carried out using random number tables of the population over 18 years of age assigned to SERMAS (10,579 people). By study protocol, terminal patients, institutionalised patients, those with cognitive impairment and women during pregnancy were excluded, obtaining a final sample with 10,084 study subjects, whose response rate was 65.8%.
The biochemical criteria for the diagnosis of DM were those defined by the American Diabetes Association10 or the Canadian Diabetes Association11: fasting plasma glucose ≥126 mg/dl (≥7.0 mmol/l) or HbA1c ≥6.5% (≥48 mmol/mol)10,11 confirmed on at least two occasions, or determination of plasma glucose ≥200 mg/dl (≥11.1 mmol/l), either randomly at any time of the day regardless of the time since the last meal, or with the oral glucose tolerance test (2 h after the administration of 75 g of anhydrous glucose dissolved in water). Patients were considered to have DM if they had criteria of DM1 or DM2. Patients were considered to have DM1 if they had the criteria defined by the American Diabetes Association10 or the Canadian Diabetes Association11: deficiency in insulin production as a result of autoimmune or idiopathic β cell destruction (including LADA type), with low or undetectable or clinical C-peptide compatible with hyperglycaemia (polyuria, polydipsia, ketoacidosis), and the diagnostic biochemical criteria of DM mentioned above.10,11 Patients were considered to have DM2 if the disease were with insulin resistance without DM1 criteria and with the biochemical criteria for DM diagnosis mentioned above.10,11 Likewise, patients were considered to have DM1 or DM2, when it was shown that these diagnoses or the following codes of the International Classification of Primary Care second edition (ICPC-2)12 or from the International Classification of Diseases ninth revision, clinical modification (ICD-9)13 were registered in their medical records: DM1: T89 (ICPC-2)12; 250.01 (ICD-9)13; DM2: T90 (ICPC-2)12; 249, 250.02 (ICD-9).13 As per the study protocol, pregnant women were not included in the study, so gestational diabetes was not considered.
The statistical analysis was performed with the Statistical Package for the Social Sciences program (IBM® SPSS® Statistical release 20.0, Armonk, NY, USA). Continuous variables were analysed with the mean and standard deviation (SD), median and interquartile range. Qualitative variables, crude estimates and age-specific prevalences were presented with the lower and upper limits of the 95% confidence interval (95% CI). Student's t-test or analysis of variance was used for comparisons between groups for continuous variables, and the chi-square test for categorical variables. The multivariate logistic regression analysis was used with the enter method to evaluate the effect on the dependent variable (DM) of those independent variables (CVRF and comorbidities) whose previously performed bivariate analysis would have shown a statistically significant association with the dependent variable. As they are complex variables that comprise others already included in the multivariate analysis, the following variables were not included in this analysis: adiposity index CUN-BAE (Clínica Universitaria de Navarra [Navarre University Clinic]-Body Adiposity Estimator), metabolic syndrome (MS) and CVD. All tests were considered statistically significant if the two-tailed p-value was <0.05.
Prevalence rates were reported as crude rates and age- and sex-adjusted rates, standardised with the Spanish population by direct method.14 The distributions by age and sex of the Spanish population were obtained from the database of the Spanish National Statistics Institute15 from January 2015.
The following definitions were used:
- -
Smoking: consumption of any quantity of cigarettes or tobacco during the last month.
- -
Chronic obstructive pulmonary disease according to the GOLD guidelines.16
- -
Alcohol use: weekly alcohol consumption >21 units (>210 g) in men; >14 units (>140 g) in women.
- -
Physical inactivity: weekly physical activity <150 min.
- -
Body mass index (BMI): weight/height2. Overweight: BMI 25.0–29.9 kg/m2. Obesity: BMI ≥ 30 kg/m2.
- -
CUN-BAE adiposity index17,18 or body fat percentage: − 44.988 + (0.503 × age) + (10.689 × sex) + (3.172 × BMI) − (0.026 × BMI2) + (0.181 × BMI × sex) − (0.02 × BMI × age) − (0.005 × BMI2 × sex) + (0.00021 × BMI2 × age); male = 0; female = 1. CUN-BAE-overweight: 20–25% (men); 30–35% (women); CUN-BAE-obesity: >25% (men); >35% (women).
- -
Central obesity: abdominal circumference ≥102 cm (men) or ≥88 cm (women).
- -
Waist-to-height ratio (WHR): abdominal circumference/height. Increased WHR: ≥0.6.
- -
Hypertension (HTN): systolic blood pressure ≥140 mmHg and/or diastolic blood pressure ≥90 mmHg, or under antihypertensive treatment.
- -
HbA1c standardised according to the Diabetes Control and Complications Trial and according to the International Federation of Clinical Chemistry.
- -
Hypercholesterolaemia: total cholesterol (TC) >200 mg/dl.
- -
Hypertriglyceridaemia (HTG): triglycerides (TG) >150 mg/dl.
- -
Low cholesterol levels linked to high-density lipoproteins (HDL-C): <40 mg/dl (men); <50 mg/dl (women).
- -
Atherogenic Index of Plasma (AIP): log (TG/HDL-C).
- -
TG and glucose index: Ln [TG (mg/dl) × fasting plasma glucose (mg/dl) / 2].
- -
Atherogenic dyslipidaemia: HTG and low HDL-C.
- -
MS: according to harmonised IDF/NHLBI/AHA/WHF/IAS/IASO consensus.19
- -
CVD: includes CD, stroke and peripheral arterial disease (PAD). CHD: includes ischaemic heart disease, acute previous myocardial infarction, acute coronary syndromes, coronary revascularisation and other arterial revascularisation procedures. Stroke: includes stroke, cerebral ischaemia or intracranial haemorrhages and transient ischaemic attack. PAD: includes intermittent claudication or an ankle-brachial index ≤0.9.
- -
Albuminuria: albumin-creatinine ratio >30 mg/g.
- -
Estimated glomerular filtration rate (eGFR) according to the Chronic Kidney Disease EPIdemiology Collaboration.20 Low eGFR: <60 ml/min./1.73 m2. CKD: Low eGFR and/or albuminuria.20
- -
CVR according to SCORE.21,22 Extreme CVR23: patients with DM and CVD.
A bibliographic search was conducted in PubMed, Medline, Embase, Google Scholar and Web of Science to compare the prevalence rates of DM in this study with those determined in the main studies conducted in Spain between 2000 and 2015 with populations 18 years of age or older.
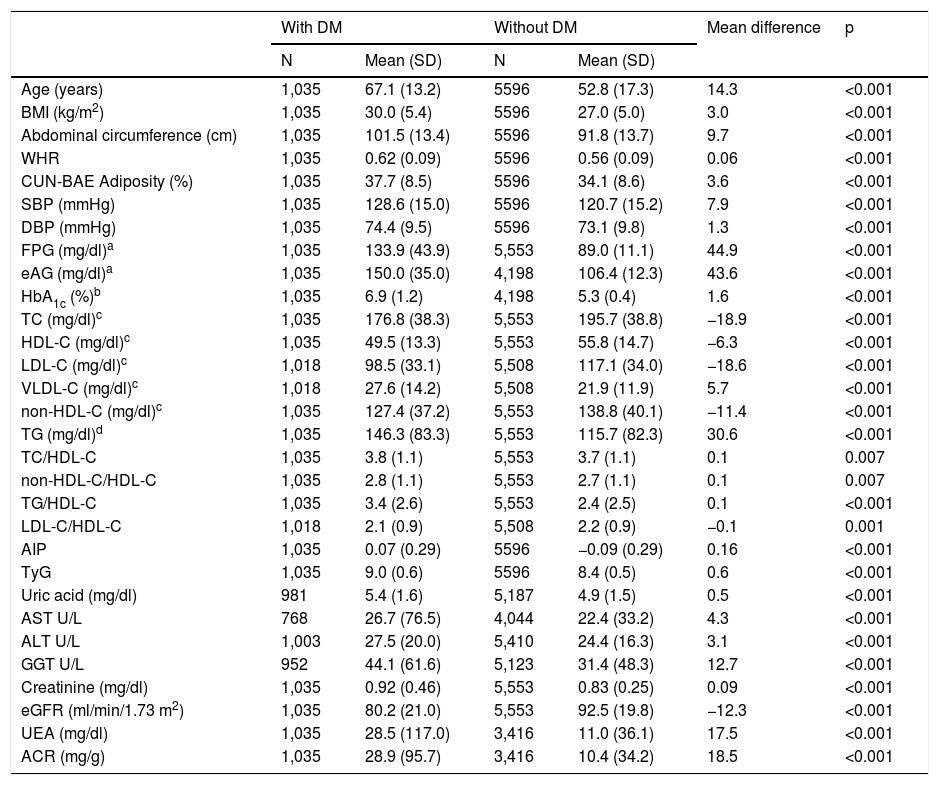
ResultsThe study population was 6631 adults, with 55.8% of them being women (95% CI: 54.6–57.0). The mean age was 55.0 years (SD 17.5), the median was 54.6 years, and the age range was 18.0–102.8 years (interquartile range: 41.6; 68.0). The difference between the mean ages of the male (55.1 years [SD 16.9]) and female (55.0 years [SD 18.0]) populations was not significant (p = 0.908). The differences in the mean ages between the populations with and without DM are shown in Table 1. In the population without DM, the difference in mean age between men (52.6 years [SD 16.8]) and women (53.0 years [SD 17.7]) was not significant (p = 0.416). However, the difference in mean age between men (65.3 years [SD 13.0]) and women (69.2 years [SD 13.2]) in the population with DM was significant (p < 0.001).
Clinical characteristics of the study population.
| With DM | Without DM | Mean difference | p | |||
|---|---|---|---|---|---|---|
| N | Mean (SD) | N | Mean (SD) | |||
| Age (years) | 1,035 | 67.1 (13.2) | 5596 | 52.8 (17.3) | 14.3 | <0.001 |
| BMI (kg/m2) | 1,035 | 30.0 (5.4) | 5596 | 27.0 (5.0) | 3.0 | <0.001 |
| Abdominal circumference (cm) | 1,035 | 101.5 (13.4) | 5596 | 91.8 (13.7) | 9.7 | <0.001 |
| WHR | 1,035 | 0.62 (0.09) | 5596 | 0.56 (0.09) | 0.06 | <0.001 |
| CUN-BAE Adiposity (%) | 1,035 | 37.7 (8.5) | 5596 | 34.1 (8.6) | 3.6 | <0.001 |
| SBP (mmHg) | 1,035 | 128.6 (15.0) | 5596 | 120.7 (15.2) | 7.9 | <0.001 |
| DBP (mmHg) | 1,035 | 74.4 (9.5) | 5596 | 73.1 (9.8) | 1.3 | <0.001 |
| FPG (mg/dl)a | 1,035 | 133.9 (43.9) | 5,553 | 89.0 (11.1) | 44.9 | <0.001 |
| eAG (mg/dl)a | 1,035 | 150.0 (35.0) | 4,198 | 106.4 (12.3) | 43.6 | <0.001 |
| HbA1c (%)b | 1,035 | 6.9 (1.2) | 4,198 | 5.3 (0.4) | 1.6 | <0.001 |
| TC (mg/dl)c | 1,035 | 176.8 (38.3) | 5,553 | 195.7 (38.8) | −18.9 | <0.001 |
| HDL-C (mg/dl)c | 1,035 | 49.5 (13.3) | 5,553 | 55.8 (14.7) | −6.3 | <0.001 |
| LDL-C (mg/dl)c | 1,018 | 98.5 (33.1) | 5,508 | 117.1 (34.0) | −18.6 | <0.001 |
| VLDL-C (mg/dl)c | 1,018 | 27.6 (14.2) | 5,508 | 21.9 (11.9) | 5.7 | <0.001 |
| non-HDL-C (mg/dl)c | 1,035 | 127.4 (37.2) | 5,553 | 138.8 (40.1) | −11.4 | <0.001 |
| TG (mg/dl)d | 1,035 | 146.3 (83.3) | 5,553 | 115.7 (82.3) | 30.6 | <0.001 |
| TC/HDL-C | 1,035 | 3.8 (1.1) | 5,553 | 3.7 (1.1) | 0.1 | 0.007 |
| non-HDL-C/HDL-C | 1,035 | 2.8 (1.1) | 5,553 | 2.7 (1.1) | 0.1 | 0.007 |
| TG/HDL-C | 1,035 | 3.4 (2.6) | 5,553 | 2.4 (2.5) | 0.1 | <0.001 |
| LDL-C/HDL-C | 1,018 | 2.1 (0.9) | 5,508 | 2.2 (0.9) | −0.1 | 0.001 |
| AIP | 1,035 | 0.07 (0.29) | 5596 | −0.09 (0.29) | 0.16 | <0.001 |
| TyG | 1,035 | 9.0 (0.6) | 5596 | 8.4 (0.5) | 0.6 | <0.001 |
| Uric acid (mg/dl) | 981 | 5.4 (1.6) | 5,187 | 4.9 (1.5) | 0.5 | <0.001 |
| AST U/L | 768 | 26.7 (76.5) | 4,044 | 22.4 (33.2) | 4.3 | <0.001 |
| ALT U/L | 1,003 | 27.5 (20.0) | 5,410 | 24.4 (16.3) | 3.1 | <0.001 |
| GGT U/L | 952 | 44.1 (61.6) | 5,123 | 31.4 (48.3) | 12.7 | <0.001 |
| Creatinine (mg/dl) | 1,035 | 0.92 (0.46) | 5,553 | 0.83 (0.25) | 0.09 | <0.001 |
| eGFR (ml/min/1.73 m2) | 1,035 | 80.2 (21.0) | 5,553 | 92.5 (19.8) | −12.3 | <0.001 |
| UEA (mg/dl) | 1,035 | 28.5 (117.0) | 3,416 | 11.0 (36.1) | 17.5 | <0.001 |
| ACR (mg/g) | 1,035 | 28.9 (95.7) | 3,416 | 10.4 (34.2) | 18.5 | <0.001 |
ALT: alanine aminotransferase; ACR: albumin/creatinine ratio; AIP: atherogenic index of plasma; AST: aspartate aminotransferase; BMI: Body Mass Index; CUN-BAE: adiposity index or body fat percentage; DBP: diastolic blood pressure; DM: diabetes mellitus; eAG: estimated average glucose; eGFR: estimated glomerular filtration rate according to CKD-EPI; FPG: fasting plasma glucose; GGT: gamma-glutamyl transferase; HbA1c: glycosylated haemoglobin; HDL-C: high-density lipoprotein cholesterol; LDL-C: low-density lipoprotein cholesterol; non-HDL-C: cholesterol not bound to high-density lipoproteins; p: p-value of the difference in means; SBP: systolic blood pressure; SD: standard deviation; TC: total cholesterol; TG: triglycerides; TyG: triglyceride-glucose index; UEA: urinary excretion of albumin; VLDL-C: cholesterol bound to very low-density lipoproteins; WHR: Waist-to-height ratio.
The mean evolution time of DM was 9.2 (SD 6.8) years, with the difference between men (8.6 [SD 6.3] years) and women (9.9 [SD 7.4] years) being significant (p = 0.002). A total of 63.4% (95% CI: 60.5–66.3) of the population with DM had HbA1c <7.0% (<53 mmol/mol), 21.6% (19.1–24.2%) had HbA1c between 7.0 and 7.9% (53−63 mmol/mol) and 15.0% (12.8–17.2%) had HbA1c ≥ 8% (≥64 mmol/mol).
The clinical characteristics of the study population are shown in Table 1. All parameters evaluated were significantly higher in the population with DM, except for TC, HDL-C, LDL-C, non-HDL-C levels, the LDL-C/HDL-C ratio and the eGFR, which were significantly higher in the population without DM.
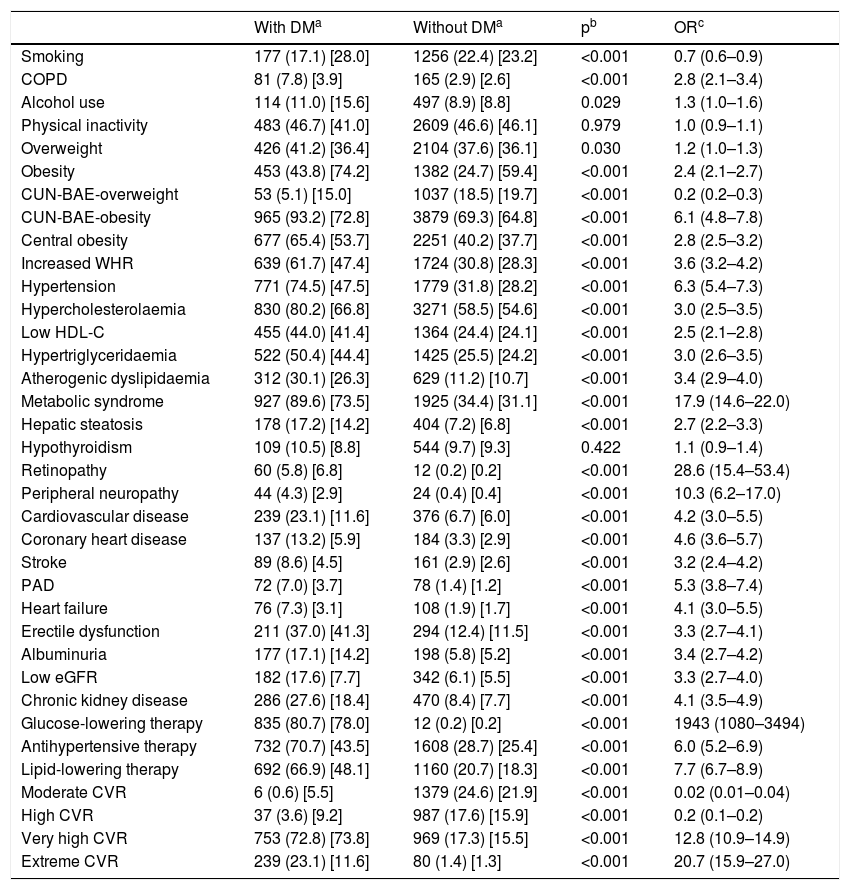
The odds ratio (OR) of the associated comorbidity between populations with and without DM is shown in Table 2. Current smoking, being overweight and moderate and high CVR were significantly associated with the population without DM. Physical inactivity and hypothyroidism showed no association with populations with or without DM. The rest of the CVRF and comorbidities were significantly associated with DM. Retinopathy, peripheral neuropathy and MS25 were the variables that showed a greater association with DM. A total of 95.8% (95% CI: 94.4–97.0) of the diabetic patients had very high CVR,21,22 of which 24.1% (95% CI: 21.5–26.9) had extreme CVR23 by coexisting with established CVD.
Odds ratio of associated comorbidity among populations with and without diabetes mellitus.
| With DMa | Without DMa | pb | ORc | |
|---|---|---|---|---|
| Smoking | 177 (17.1) [28.0] | 1256 (22.4) [23.2] | <0.001 | 0.7 (0.6–0.9) |
| COPD | 81 (7.8) [3.9] | 165 (2.9) [2.6] | <0.001 | 2.8 (2.1–3.4) |
| Alcohol use | 114 (11.0) [15.6] | 497 (8.9) [8.8] | 0.029 | 1.3 (1.0–1.6) |
| Physical inactivity | 483 (46.7) [41.0] | 2609 (46.6) [46.1] | 0.979 | 1.0 (0.9–1.1) |
| Overweight | 426 (41.2) [36.4] | 2104 (37.6) [36.1] | 0.030 | 1.2 (1.0–1.3) |
| Obesity | 453 (43.8) [74.2] | 1382 (24.7) [59.4] | <0.001 | 2.4 (2.1–2.7) |
| CUN-BAE-overweight | 53 (5.1) [15.0] | 1037 (18.5) [19.7] | <0.001 | 0.2 (0.2–0.3) |
| CUN-BAE-obesity | 965 (93.2) [72.8] | 3879 (69.3) [64.8] | <0.001 | 6.1 (4.8–7.8) |
| Central obesity | 677 (65.4) [53.7] | 2251 (40.2) [37.7] | <0.001 | 2.8 (2.5–3.2) |
| Increased WHR | 639 (61.7) [47.4] | 1724 (30.8) [28.3] | <0.001 | 3.6 (3.2–4.2) |
| Hypertension | 771 (74.5) [47.5] | 1779 (31.8) [28.2] | <0.001 | 6.3 (5.4–7.3) |
| Hypercholesterolaemia | 830 (80.2) [66.8] | 3271 (58.5) [54.6] | <0.001 | 3.0 (2.5–3.5) |
| Low HDL-C | 455 (44.0) [41.4] | 1364 (24.4) [24.1] | <0.001 | 2.5 (2.1–2.8) |
| Hypertriglyceridaemia | 522 (50.4) [44.4] | 1425 (25.5) [24.2] | <0.001 | 3.0 (2.6–3.5) |
| Atherogenic dyslipidaemia | 312 (30.1) [26.3] | 629 (11.2) [10.7] | <0.001 | 3.4 (2.9–4.0) |
| Metabolic syndrome | 927 (89.6) [73.5] | 1925 (34.4) [31.1] | <0.001 | 17.9 (14.6–22.0) |
| Hepatic steatosis | 178 (17.2) [14.2] | 404 (7.2) [6.8] | <0.001 | 2.7 (2.2–3.3) |
| Hypothyroidism | 109 (10.5) [8.8] | 544 (9.7) [9.3] | 0.422 | 1.1 (0.9–1.4) |
| Retinopathy | 60 (5.8) [6.8] | 12 (0.2) [0.2] | <0.001 | 28.6 (15.4–53.4) |
| Peripheral neuropathy | 44 (4.3) [2.9] | 24 (0.4) [0.4] | <0.001 | 10.3 (6.2–17.0) |
| Cardiovascular disease | 239 (23.1) [11.6] | 376 (6.7) [6.0] | <0.001 | 4.2 (3.0–5.5) |
| Coronary heart disease | 137 (13.2) [5.9] | 184 (3.3) [2.9] | <0.001 | 4.6 (3.6–5.7) |
| Stroke | 89 (8.6) [4.5] | 161 (2.9) [2.6] | <0.001 | 3.2 (2.4–4.2) |
| PAD | 72 (7.0) [3.7] | 78 (1.4) [1.2] | <0.001 | 5.3 (3.8–7.4) |
| Heart failure | 76 (7.3) [3.1] | 108 (1.9) [1.7] | <0.001 | 4.1 (3.0–5.5) |
| Erectile dysfunction | 211 (37.0) [41.3] | 294 (12.4) [11.5] | <0.001 | 3.3 (2.7–4.1) |
| Albuminuria | 177 (17.1) [14.2] | 198 (5.8) [5.2] | <0.001 | 3.4 (2.7–4.2) |
| Low eGFR | 182 (17.6) [7.7] | 342 (6.1) [5.5] | <0.001 | 3.3 (2.7–4.0) |
| Chronic kidney disease | 286 (27.6) [18.4] | 470 (8.4) [7.7] | <0.001 | 4.1 (3.5–4.9) |
| Glucose-lowering therapy | 835 (80.7) [78.0] | 12 (0.2) [0.2] | <0.001 | 1943 (1080–3494) |
| Antihypertensive therapy | 732 (70.7) [43.5] | 1608 (28.7) [25.4] | <0.001 | 6.0 (5.2–6.9) |
| Lipid-lowering therapy | 692 (66.9) [48.1] | 1160 (20.7) [18.3] | <0.001 | 7.7 (6.7–8.9) |
| Moderate CVR | 6 (0.6) [5.5] | 1379 (24.6) [21.9] | <0.001 | 0.02 (0.01–0.04) |
| High CVR | 37 (3.6) [9.2] | 987 (17.6) [15.9] | <0.001 | 0.2 (0.1–0.2) |
| Very high CVR | 753 (72.8) [73.8] | 969 (17.3) [15.5] | <0.001 | 12.8 (10.9–14.9) |
| Extreme CVR | 239 (23.1) [11.6] | 80 (1.4) [1.3] | <0.001 | 20.7 (15.9–27.0) |
Albuminuria: albumin-creatinine ratio >30 mg/g; BMI ≥ 30 kg/m2; COPD: chronic obstructive pulmonary disease; CUN-BAE obesity: >25% (men); CVD: cardiovascular disease; CVR: cardiovascular risk; DM: diabetes mellitus; >35% (women); Extreme CVR: CVD + DM; Hypercholesterolaemia: total cholesterol >200 mg/dl; Low HDL-C: cholesterol bound to high-density lipoprotein <40 mg/dl in men and <50 mg/dl in women; atherogenic dyslipidaemia: hypertriglyceridaemia and low HDL-C; Hypertriglyceridaemia: triglycerides >150 mg/dl; Obesity: Central obesity: abdominal circumference ≥102 cm in men and ≥88 cm in women; Increased WHR: waist-to-height ratio ≥0.6; Low eGFR: glomerular filtration rate <60 ml/min/1.73 m2 according to CKD-EPI; Overweight: BMI 25.0–29.9 kg/m2 PAD: peripheral arterial disease.
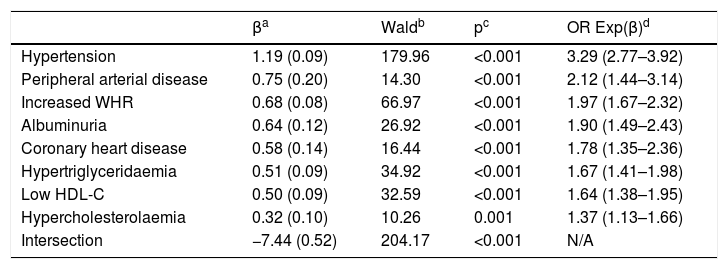
The multivariate analysis shows that the CVRF and the comorbidities that are independently associated with DM are HTN, PAD, increased WHR, albuminuria, CHD, HTG, low HDL-c and hypercholesterolaemia (Table 3).
Multivariate analysis of cardiovascular risk factors and comorbidities associated with diabetes mellitus.
| βa | Waldb | pc | OR Exp(β)d | |
|---|---|---|---|---|
| Hypertension | 1.19 (0.09) | 179.96 | <0.001 | 3.29 (2.77–3.92) |
| Peripheral arterial disease | 0.75 (0.20) | 14.30 | <0.001 | 2.12 (1.44–3.14) |
| Increased WHR | 0.68 (0.08) | 66.97 | <0.001 | 1.97 (1.67–2.32) |
| Albuminuria | 0.64 (0.12) | 26.92 | <0.001 | 1.90 (1.49–2.43) |
| Coronary heart disease | 0.58 (0.14) | 16.44 | <0.001 | 1.78 (1.35–2.36) |
| Hypertriglyceridaemia | 0.51 (0.09) | 34.92 | <0.001 | 1.67 (1.41–1.98) |
| Low HDL-C | 0.50 (0.09) | 32.59 | <0.001 | 1.64 (1.38–1.95) |
| Hypercholesterolaemia | 0.32 (0.10) | 10.26 | 0.001 | 1.37 (1.13–1.66) |
| Intersection | −7.44 (0.52) | 204.17 | <0.001 | N/A |
Albuminuria: albumin-creatinine ratio >30 mg/g; CVRF: cardiovascular risk factors; DM: diabetes mellitus; Hypercholesterolaemia: total cholesterol >200 mg/dl; Hypertriglyceridaemia: triglycerides >150 mg/dl; Increased WHR: waist-to-height ratio ≥0.6; low HDL-C: cholesterol bound to high-density lipoprotein <40 mg/dl in men and <50 mg/dl in women; N/A: not applicable.
In the population aged 18 years or over, the crude prevalence of DM1, DM2 and DM was 0.87% (95% CI: 0.67–1.13), 14.7% (95% CI: 13.9–15.6) and 15.6% (95% CI: 14.7–16.5), respectively, and their prevalences adjusted for age and sex were 0.95, 11.5 and 12.5%, respectively. The crude prevalence of DM in men was 19.4% (95% CI: 17.9–20.8) and 12.6% (95% CI: 11.5–13.7) in women, and their age-adjusted prevalence was 14.9 and 10.5%, respectively.
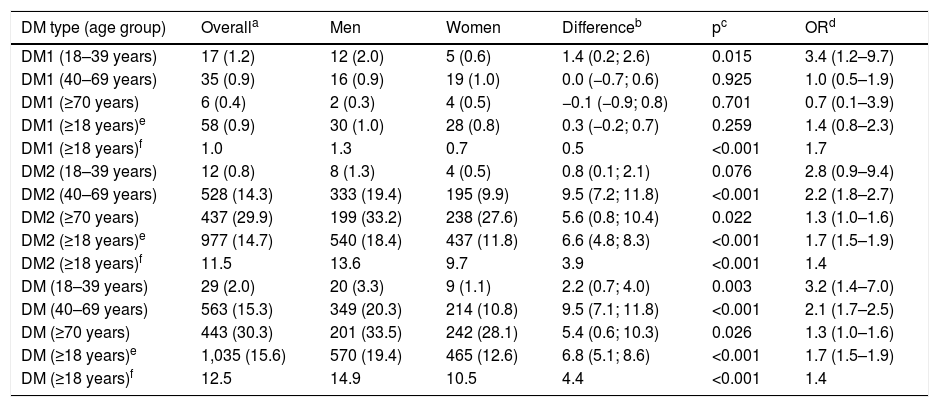
The crude and age- and sex-adjusted prevalence rates of DM1, DM2 and DM overall and by age groups (<40, 40–69, and ≥70 years) and their differences between men and women are detailed in Table 4. The prevalence of DM in the population between 40 and 69 years of age was 15.3% (95% CI: 14.1–16.5), with it being double in men (20.3% [95% CI: 18.4–22.3]) than in women (10.8% [95% CI: 8.5–12.3]). The prevalence of DM in the population ≥70 years was 30.3% (95% CI: 28.0–32.7), with it being 33.5% (95% CI: 29.7–37.4) in men and 28.1% (95% CI: 25.1–31.2) in women.
Crude and adjusted for age and sex prevalence rates of DM1, DM2 and DM.
| DM type (age group) | Overalla | Men | Women | Differenceb | pc | ORd |
|---|---|---|---|---|---|---|
| DM1 (18–39 years) | 17 (1.2) | 12 (2.0) | 5 (0.6) | 1.4 (0.2; 2.6) | 0.015 | 3.4 (1.2–9.7) |
| DM1 (40–69 years) | 35 (0.9) | 16 (0.9) | 19 (1.0) | 0.0 (−0.7; 0.6) | 0.925 | 1.0 (0.5–1.9) |
| DM1 (≥70 years) | 6 (0.4) | 2 (0.3) | 4 (0.5) | −0.1 (−0.9; 0.8) | 0.701 | 0.7 (0.1–3.9) |
| DM1 (≥18 years)e | 58 (0.9) | 30 (1.0) | 28 (0.8) | 0.3 (−0.2; 0.7) | 0.259 | 1.4 (0.8–2.3) |
| DM1 (≥18 years)f | 1.0 | 1.3 | 0.7 | 0.5 | <0.001 | 1.7 |
| DM2 (18–39 years) | 12 (0.8) | 8 (1.3) | 4 (0.5) | 0.8 (0.1; 2.1) | 0.076 | 2.8 (0.9–9.4) |
| DM2 (40–69 years) | 528 (14.3) | 333 (19.4) | 195 (9.9) | 9.5 (7.2; 11.8) | <0.001 | 2.2 (1.8–2.7) |
| DM2 (≥70 years) | 437 (29.9) | 199 (33.2) | 238 (27.6) | 5.6 (0.8; 10.4) | 0.022 | 1.3 (1.0–1.6) |
| DM2 (≥18 years)e | 977 (14.7) | 540 (18.4) | 437 (11.8) | 6.6 (4.8; 8.3) | <0.001 | 1.7 (1.5–1.9) |
| DM2 (≥18 years)f | 11.5 | 13.6 | 9.7 | 3.9 | <0.001 | 1.4 |
| DM (18–39 years) | 29 (2.0) | 20 (3.3) | 9 (1.1) | 2.2 (0.7; 4.0) | 0.003 | 3.2 (1.4–7.0) |
| DM (40–69 years) | 563 (15.3) | 349 (20.3) | 214 (10.8) | 9.5 (7.1; 11.8) | <0.001 | 2.1 (1.7–2.5) |
| DM (≥70 years) | 443 (30.3) | 201 (33.5) | 242 (28.1) | 5.4 (0.6; 10.3) | 0.026 | 1.3 (1.0–1.6) |
| DM (≥18 years)e | 1,035 (15.6) | 570 (19.4) | 465 (12.6) | 6.8 (5.1; 8.6) | <0.001 | 1.7 (1.5–1.9) |
| DM (≥18 years)f | 12.5 | 14.9 | 10.5 | 4.4 | <0.001 | 1.4 |
DM: diabetes mellitus; DM1: diabetes mellitus type 1; DM2: diabetes mellitus type 2.
The distribution by ten-year age groups of prevalence rates of DM increases with age according to a natural exponential function (y = 1.3953e0.4611x) (Fig. 1), with all the differences between men and women being significant, except for those over the age of 80.
Discussion
This study included 6631 people aged between 18 and 102. The age-adjusted prevalence of DM was 12.4% (14.9% men; 10.4% women) (Table 4). When comparing the prevalence rates of DM determined in the study SIMETAP-DM with those of other studies conducted in Spain between 2000 and 2015, some similarities and differences can be assessed. In the next three studies,24–26 lower prevalence rates were determined. The MADRIC study24 included 1344 people aged between 31 and 70 and reported a prevalence of 6.6% (7.3% men; 5.9% women). The ERICE study25 included 16,240 adults and determined an age-adjusted prevalence of DM of 6.2%, and similar crude prevalence rates among men (8.9%) and women (8.7%). The PREDIMERC study26 included 2268 people aged between 30 and 74 and determined a crude prevalence of DM of 8.1% (10.2% in men and 6.0% in women). These studies did not include populations older than 70 or 74, which could justify the differences between the prevalence rates of DM in the adult population and those shown in the SIMETAP-DM study, whose prevalence of DM in the population 70 years of age or older was 33.5% (95% CI: 29.7–37.4).
On the other hand, two additional national studies5,6 determined prevalence rates similar to those of the present study. The Di@bet.es study6 included 5072 adults and reported that the prevalence of DM was 13.8%. The DARIOS study5 included 28,887 people aged between 35 and 74 and reported that the prevalence of DM was 13% (16% men; 11% women).
The SIMETAP-DM study shows a prevalence of DM similar to what is determined in the USA through the National Health and Nutrition Examination Survey,27 which reported a prevalence of 14.0% (15.9% in men and 12.2% in women). Prevalence rates in the main age groups of the SIMETAP-DM study were also similar to those of the National Health and Nutrition Examination Survey27: 2.0 versus 3.5% in individuals under 40, respectively, 15.3% in the population aged between 40 and 69 versus 16.3% in the population aged between 40 and 59,27 and 30.3% in people over the age of 70 compared to 28.2% in people over 60.27
In this study, the prevalence of DM in the population aged between 40 and 69 was 15.3% (95% CI: 14.1–16.5). It should be noted that the prevalence was double in men (20.3% [95% CI: 18.4–22.3]) than in women (10.8% [95% CI: 8.5–12.3]). It is also relevant that the prevalence of DM doubled in the population aged 70 or over (30.3% [95% CI: 28.0–32.7]) (Table 4).
The SIMETAP-DM study shows a crude prevalence of DM1 similar to the age- and sex-adjusted prevalence (1.0%), which could be justified by the genetic character and the low influence of age on the prevalence of DM1. However, the crude prevalence rates of DM2 were higher than the age- and sex-adjusted prevalence rates: 3 percentage points higher in the population aged 18 or over (14.7 versus 11.5%), 5 percentage points higher in men (18.4 versus 13.6%), and 2 percentage points higher in women (11.8 versus 9.7%). We believe that the prevalences should be adjusted for age and sex due to the differences inherent in the sampling, the differences of the population pyramids between the standard population and the population of this study (with a higher average age) and, finally, due to the confounding effect of age on the prevalence of DM, as it has been reported28 that it explains an increase in crude prevalence between 12.5 and 31.3%.
The prevalence of chronic obstructive pulmonary disease was higher in the population with DM (OR: 2.8), although current smoking was lower (OR: 0.7), probably because it was a population with a higher average age and which smoked less than the population without DM, which was younger and smoked more (Table 2).
When comparing the prevalence rates among populations with and without DM, the comorbidities with greater association with DM were MS, retinopathy and peripheral neuropathy, which could show the coexistence of these entities in DM. The strong association of DM with MS (OR: 17.9) may be justified by the important association of DM with the criteria that define MS19: central obesity (OR: 2.8), HTN (OR: 6.3), HTG (OR: 3.0) and low HDL (OR: 2.5) (Table 2). It is understandable that the triglyceride–glucose (TyG) index were significantly higher in the population with DM as they have higher levels of fasting TG and plasma glucose (Table 1). On the other hand, hepatic steatosis was more associated with DM (OR: 2.7) (Table 2), which could justify the higher transaminase levels in the population with DM (Table 1).
HTN showed a strong association with the population with DM (OR: 6.3), which could justify that treatment with antihypertensive drugs was more frequent in the population with DM than in the population without DM (OR: 6.0) (Table 2). The crude prevalence of HTN in patients with DM (74.5%) was similar to the Di@betes study29 (79.4%). In the multivariate analysis, HTN was the independent variable that was most associated with DM (OR: 3.3) (Table 3).
Similarly, hypercholesterolaemia, HTG and CVD showed important associations with the population with DM (OR: 3.0; 3.0; 4.2 respectively), which could justify that treatment with lipid-lowering drugs was more frequent in the population with DM than in the population without DM (OR: 7.7) (Table 2), reinforced by following the recommendations in the guidelines21,23 on the intensification of lipid-lowering therapy in patients with DM. All this would justify the lower levels of TC, LDL-C and non-HDL-C in the population with DM (Table 1). However, TC/HDL-C, non-HDL-C/HDL-C, TG/HDL-C and AIP atherogenic indices were significantly higher in the population with DM (Table 1). On the other hand, the hypercholesterolaemia, HTG and low HDL-C showed association with DM both when compared with the population without DM (Table 2) and in the multivariate analysis (Table 3), showing that atherogenic dyslipidaemia is the lipid phenotype that is most associated with DM.
Heart failure showed a significant association with DM (OR: 4.1), supporting the idea of the existence of a diabetic cardiomyopathy.30 Erectile dysfunction also showed association with DM (OR: 3.3) (Table 2). The associations of CHD (OR: 4.6), stroke (OR: 3.2) and PAD (OR: 5.3) with DM (Table 2) could justify the strong association of CVD with DM (OR: 4.2) and the high cardiovascular morbidity of DM. In the multivariate analysis, both PAD (OR 2.1) and CHD (OR: 1.8) continued to show an important association with DM (Table 3).
Albuminuria (OR: 3.4) and low eGFR (OR: 3.3) were significantly associated with DM (Table 2), highlighting the importance of albuminuria, which maintained the association with DM (OR: 2.0) in the multivariate analysis (Table 3).
The obesity variables, CUN-BAE-obesity,17,18 central obesity (increased abdominal circumference) and increased WHR were significantly associated with DM (Table 2), parameters that could be related to the higher prevalence of atherogenic dyslipidaemia, HTG, low HDL-C, hepatic steatosis and with the greatest need for lipid-lowering and antihypertensive therapy in the population with DM. Among the parameters related to obesity, only the increased WHR variable continued to show this association in the multivariate analysis (Table 3), which could support the idea of considering increased WHR as a more significant risk factor for DM than obesity or increased abdominal circumference.
The results of the SIMETAP-DM study support that DM is an entity with multiple chronic comorbidities31–33 and, consequently, patients with DM have a greater need to use health services.34 A total of 95.9% of the population with DM had a very high or extreme CVR, to the detriment of moderate and high CVR, which were more common in the population without DM. The high prevalence of MS (89.6%) and of the CVRF in the population with DM may explain the high prevalence of very high CVR (72.8% [95% CI: 70.0–75.5]) and its strong association with the very high CVR (OR: 12.8) (Table 2). In addition, 23.1% (95% CI: 20.5–25.7) of the population with DM had CVD and, therefore, an extreme CVR.23 The high prevalence of CVRF, MS and CVD in patients with DM may justify the close association with very high or extreme CVR (OR: 100 [95% CI: 73.2–136.7]) and, therefore, support the message21,23 of achieving the therapeutic objective of LDL-C <70 mg/dl (<1.8 mmol/l) for the vast majority of patients with DM (96%), and the objective of LDL-C <100 mg/dl (<2.6 mmol/l) for the lowest proportion of patients with DM who only have a high CVR (4%).
Fig. 1 shows how the prevalence of DM increases exponentially with age, so the prevalence of DM is strongly influenced by it. The prevalence of DM in the population ≥70 years (30.3%) was twice that in the population aged between 40 and 69 (15.3%).
The main limitations of this study were the inability of a cross-sectional study to determine causality and possible underdiagnosis by not performing ad hoc oral glucose overload tests for patients without DM, and by protocol excluding women in the gestation period and terminal, institutionalised or cognitively impaired patients. The main strengths of this study were the population-based random selection, a large sample that included people 18–102 years of age and the evaluation of CVRF, CKD, metabolic diseases and CVD.
The high prevalence of DM has serious socioeconomic and health consequences as cardiovascular morbidity and mortality increase. The determination of the prevalence of DM is very important to improve planning of the intervention policies for cardiovascular prevention, optimise available health resources and improve the medical care and quality of life of patients with DM.
DM is strongly influenced by age, so its prevalence should always be documented with age-adjusted rates in order to compare with other populations. Given the progression of the prevalence of DM in recent years, we understand that more epidemiological studies aimed at the entire population are necessary. We hope that this study contributes to improving the epidemiological knowledge of DM and to assessing the importance of the association between DM and CVD.
ConclusionsIn the SIMETAP-DM study, HTN, PAD, increased WHR, albuminuria, CHD, atherogenic dyslipidaemia and hypercholesterolaemia were the variables that were best associated with DM.
The crude prevalence of DM was 15.6% in the population aged 18 years or older, 15.3% in the population aged between 40 and 69 and 30.3% in the population aged 70 years or older. The prevalence of DM in the male population aged between 40 and 69 (20.3%) doubled the prevalence of DM in the female population (10.8%).
The age-adjusted prevalence of DM in the population aged 18 years or older was 3 percentage points lower than the crude prevalence (12.5 versus 15.6%), 5 percentage points lower in the male population (14.9 versus 19.4%) and 2 percentage points lower in the female population (10.5 versus 12.6%).
FundingThe financing of the SIMETAP study (Grant Code: 05/2010RS) was approved according to Order 472/2010, of 16 September, of the Ministry of Health, which approves the regulatory bases and the call for grants for 2010 of the Agencia Pedro Laín Entralgo de Formación, Investigación y Estudios Sanitarios de la Comunidad de Madrid (Pedro Laín Entralgo Agency of Training, Research and Health Studies of the Autonomous Community of Madrid), for the conduct of research projects in the field of health outcomes in primary care.
Conflicts of interestThe authors have no conflicts of interest to declare.
We would like to thank all the doctors who have participated for their interest and collaboration in carrying out the SIMETAP Study.
SIMETAP Study Research Group: Abad-Schilling C, Adrián-Sanz M, Aguilera-Reija P, Alcaraz-Bethencourt A, Alonso-Roca R, Álvarez-Benedicto R, Arranz-Martínez E, Arribas-Álvaro P, Baltuille-Aller MC, Barrios-Rueda E, Benito-Alonso E, Berbil-Bautista ML, Blanco-Canseco JM, Caballero-Ramírez N, Cabello-Igual P, Cabrera-Vélez R, Calderín-Morales MP, Capitán-Caldas M, Casaseca-Calvo TF, Cique-Herráinz JA, Ciria-de-Pablo C, Chao-Escuer P, Dávila-Blázquez G, de-la-Peña-Antón N, de-Prado-Prieto L, del-Villar-Redondo MJ, Delgado-Rodríguez S, Díez-Pérez MC, Durán-Tejada MR, Escamilla-Guijarro N, Escrivá-Ferrairó RA, Fernández-Vicente T, Fernández-Pacheco-Vila D, Frías-Vargas MJ, García-Álvarez JC, García-Fernández ME, García-García-Alcañiz MP, García-Granado MD, García-Pliego RA, García-Redondo MR, García-Villasur MP, Gómez-Díaz E, Gómez-Fernández O, González-Escobar P, González-Posada-Delgado JA, Gutiérrez-Sánchez I, Hernández-Beltrán MI, Hernández-de-Luna MC, Hernández-López RM, Hidalgo-Calleja Y, Holgado-Catalán MS, Hombrados-Gonzalo MP, Hueso-Quesada R, Ibarra-Sánchez AM, Iglesias-Quintana JR, Íscar-Valenzuela I, Iturmendi-Martínez N, Javierre-Miranda AP, López-Uriarte B, Lorenzo-Borda MS, Luna-Ramírez S, Macho-del-Barrio AI, Marañón-Henrich N, Mariño-Suárez JE, Martín-Calle MC, Martín-Fernández AI, Martínez-Cid-de-Rivera E, Martínez-Irazusta J, Migueláñez-Valero A, Minguela-Puras ME, Montero-Costa A, Mora-Casado C, Morales-Cobos LE, Morales-Chico MR, Moreno-Fernández JC, Moreno-Muñoz MS, Palacios-Martínez D, Pascual-Val T, Pérez-Fernández M, Pérez-Muñoz R, Plata-Barajas MT, Pleite-Raposo R, Prieto-Marcos M, Quintana-Gómez JL, Redondo-de-Pedro S, Redondo-Sánchez M, Reguillo-Díaz J, Remón-Pérez B, Revilla-Pascual E, Rey-López AM, Ribot-Catalá C, Rico-Pérez-MR, Rivera-Teijido M, Rodríguez-Cabanillas R, Rodríguez-de-Cossío A, Rodríguez-de-Mingo E, Rodríguez-Rodríguez AO, Rosillo-González A, Rubio-Villar M, Ruiz-Díaz L, Ruiz-García A, Sánchez-Calso A, Sánchez-Herráiz M, Sánchez-Ramos MC, Sanchidrián-Fernández PL, Sandín-de-Vega E, Sanz-Pozo B, Sanz-Velasco C, Sarriá-Sánchez MT, Simonaggio-Stancampiano P, Tello-Meco I, Vargas-Machuca-Cabañero C, Velazco-Zumarrán JL, Vieira-Pascual MC, Zafra-Urango C, Zamora-Gómez MM, Zarzuelo-Martín N.
Please cite this article as: Ruiz-García A, et al. Prevalencia de diabetes mellitus en el ámbito de la atención primaria española y su asociación con factores de riesgo cardiovascular y enfermedades cardiovasculares. Estudio SIMETAP-DM. Clín Investig Arterioscler. 2020. https://doi.org/10.1016/j.arteri.2019.03.006