


To ascertain the degree of lipidic control before the first cardiovascular accident in population attended during 2013 at Primary Care. To analyse the distribution of these events depending on control intervals of cholesterol LDL (LDL-chol), cholesterol HDL (HDL-chol) and triglycerides (TG).
MethodA multicentric cross-sectional, descriptive study on above 18-year-old people attended at the centres of the Primari Care Service (PCS) Baix Llobregat Nord, who had suffered a first cardiac or cerebral ischaemic attack from 01/01/2013 to 31/12/2013. Variables collected included age, sex, smoking, high blood preassure,diabetes, dyslipidemia (DLP), obesity, total cholesterol (chol-tot), LDL-chol, HDL-chol, TG, systolic and diastolic blood preassure (SBP,DBP), IMC, HbA1c, atherogenic indices, REGICOR, drugs.
Results379 affected people, among them 197 (52%) heart attack and 182 (48%) stroke (ictus). Two hundred and twenty-five (54.4%) males, diagnosis median age 68.9 years (DS 13.7), 71.2 (DS 14.4) in CV (p: .001). High blood preassure 214 (56.5%), diabetes 113 (29.8%), DLP 193 (50.9%). Cases in LDL<100–159: 88%, HDL≥40/50: 72.8%, TG<150: 71.3%. chol-tot average: 198.3mg/dl (DS 40.2), LDL-chol:121 (DS 33.8), LDL-chol<130:170 (58.6%). HDL-chol average: 52.5mg/dl (DS 15.4) and TG: 130.9mg/dl (DS 73.2) (CI: 139.5 [DS 84.2] vs. CV: 120.9 [DS 55.9] [p: .003]). Optimal chol-tot/HDL-chol 67%, optimal TG/HDL-chol 39.8%. CI:optimal chol-tot/HDL-chol male vs. female: 51.2% vs. 76.9% (p: .002); optimal TG/HDL-chol male vs. female: 28% vs. 53.8% (p: .004).
ConclusionsThe quantity of events was similar in both cardiac and cerebral territories, whereas the median age in the diagnosis was a little higher in CV. High blood preassure, DLP and obesity are the most prevalent FRCV, and its control at primary prevention is improvable. Most of the cases were grouped in the LDL lipid ranges<100–159mg/dl, HDL≥40/50mg/dl and TG<150mg/dl.
Conocer el grado de control lipídico previo al primer accidente cardiovascular en población atendida durante 2013 en Atención Primaria. Analizar la distribución de dichos eventos según intervalos de control de colesterol LDL (LDL-col), colesterol HDL (HDL-col) y triglicéridos (TG).
MétodoEstudio descriptivo transversal multicéntrico. Sujetos: mayores de 18 años atendidos en centros del Servicio (SAP) Baix Llobregat Nord, que habían sufrido un primer evento (ECV) isquémico cardiaco (CI) o cerebral (CV) del 01/01/2013 al 31/12/2013. Mediciones: edad, sexo, tabaquismo, hipertensión arterial, diabetes, dislipemia, obesidad, colesterol total (col-tot), LDL-col, HDL-col, TG, presión arterial sistólica, diastólica, IMC, HbA1c, índices aterogénicos, REGICOR, fármacos.
ResultadosTrescientos setenta y nueve sujetos afectos, 197 (52%) cardiaco y 182 (48%) cerebral. Doscientos veinticinco (59,4%) varones; edad media en el diagnóstico 68,9 años (DS 13,7), 71,2 (DS 14,4) en CV (p: 0,001). Hipertensión 214 (56,5%), diabetes 113 (29,8%), DLP 193 (50,9%). Casos en LDL <100-159: 88%, HDL ≥ 40/50: 72,8%, TG <150: 71,3%. Media col-tot: 198,3 mg/dl (DS 40,2); LDL-col 121 (DS 33,8), LDL-col<130: 170 (58,6%). Media HDL-col: 52,5 mg/dl (DS 15,4) y TG: 130,9 mg/dl (DS 73,2) (CI: 139,5 [DS 84,2] vs. CV: 120,9 [DS 55,9] [p: 0,003]). col-tot/HDL-col óptimo 67%, TG/HDL-col óptimo 39,8%. CI: col-tot/HDL-col óptimo varón vs. mujer: 51,2 vs. 76,9% (p 0,002); TG/HDL-col óptimo varón vs. mujer: 28% vs. 53,8% (p 0,004).
ConclusionesLa cuantía de eventos fue similar en ambos territorios, y la edad media en el diagnóstico algo mayor en CV. Hipertensión, DLP y obesidad son los FRCV más prevalentes, y su control en prevención primaria es susceptible de mejora. La mayor parte de los casos se agruparon en los intervalos lipídicos LDL <100-159mg/dl, HDL ≥ 40/50mg/dl y TG <150mg/dl.
Despite the fact that in the last 20 years we have seen a constant reduction in the rates of cardiovascular mortality, cardiac and cerebral ischaemic diseases continue to be, in that order, the first and second cause of death in Spain,1 and they occupy a prominent place among the main triggers of premature death and disability.2–4
Dyslipidaemia (DLP), defined as the presence of plasma concentrations of cholesterol, triglycerides or both, above the values determined as normal for the general population,5 participates in combination with other cardiovascular risk factors (CVRFs), such as smoking, diabetes mellitus (DM) and hypertension (HTN), in the atherosclerotic process necessary for the genesis of cardiovascular disease (CVD). The preventive importance of DLP lies in its status of modifiable with hygienic-dietary and pharmacological measures, and optimising its control reduces the possibilities of having major cardiovascular events. According to data from a meta-analysis published in 2010, the intensive reduction of low-density lipoprotein cholesterol (LDL-C) levels leads to a significant reduction in the rate of major cardiac and cerebrovascular events, if they are compared with less aggressive therapeutic regimens.6 The Cholesterol Treatment Trialists’ Collaboration concluded that the reduction of 1mmol (36.6mg/dl) of LDL-C reduces the risk of suffering from a major cardiovascular event by 22%.7 Subsequently, the Cochrane Collaboration published a review which supported statin therapy in primary prevention based on its potential to reduce all-cause mortality, severe vascular events and revascularisations, without an excess number of adverse events.8
In this sense, the guidelines of the different clinical practice guidelines (CPGs) published in recent years9–12 call for, in a practically unanimous form, aggressive actions in the approach to DLP with the objective of reducing the concentrations of LDL-C to below certain values considered to be risky, something that seems unquestionable in the case of patients in a situation of secondary prevention and of primary prevention when, once the corresponding risk scale has been applied, they remain at a level of high cardiovascular risk (CVR).10
Furthermore, nowadays nobody doubts the contribution of high-density lipoprotein cholesterol (HDL-C) and of triglycerides (TGs) in the development of CVD. The suboptimal control of these lipid fractions, with LDL-C values which are moderately high or even within therapeutic objectives and predominantly of small and dense LDL particles, defines the so-called atherogenic DLP (DLP-A), typical of conditions such as DM, obesity and metabolic syndrome (MS).13,14 In this context, some atherogenic indices or ratios (AI) have been defined which provide valuable information to the clinician about the entity that we are looking at, and which are proposed by the consensus document of the Sociedad Española de Arterioesclerosis [Spanish Society of Arterioesclerosis], along with TGs, HDL-C, LDL-C and non-HDL cholesterol (non-HDL-C) as defining criteria of DLP-A when some specific target values are not reached.15 The added value which, with increasingly more evidence, is granted to non-HDL-C as the best estimator of atherogenic cholesterol and, therefore, primary therapeutic target in individuals with DLP-A deserves a special mention.15
The reality is that the management of DLP in consultations, both in Primary Health Care (PHC) and in specialist consultations, is not simple, and proof of this is that the percentage of patients who reach the lipid levels recommended by the CPGs is lower than that desired, even among patients who are treated with statins.16–18
The main objective of this study was to determine the degree of lipid control and the mean values of LDL-C, HDL-C, TGs and of the AIs prior to the suffering of the first major cardiovascular accident in the heart and brain in the population seen in PHC during 2013. The secondary objective was to analyse the distribution of primary cardiac and cerebral ischaemic events which occurred throughout the above-mentioned year according to different control intervals of LDL-C, HDL-C and TGs, as well as their relationship with the other CVRFs involved in the atheromatous process.
MethodsStudy design and populationIt is a multicentre, cross-sectional, descriptive study performed in the scope of the geographical area of the Primary Care Service Baix Llobregat Nord (Barcelona), composed of six health teams (Basic Health Area [BHA] of Esparraguera, BHA of Abrera, BHA of urban Martorell, BHA of rural Martorell, BHA of Sant Andreu de la Barca and BHA of Pallejá), which cater for a population of 150,000 inhabitants.
The study population was all patients over the age of 18, cared for at the primary care centres of the Primary Care Service Baix Llobregat Nord, who had suffered a first cardiac or cerebral ischaemic event between 1 January and 31 December 2013, including the subjects who were diagnosed with peripheral arterial disease before this date. Diagnostic events of coronary heart disease (CHD) were considered to be acute myocardial infarction and angina, and diagnostic events of cerebrovascular (CV) origin were considered to be stroke and transient ischaemic attack. Individuals who had presented with some type of ischaemic CVD in the cardiac or cerebral territories before 2013, institutionalised patients, those in whom adequate follow-up could not be guaranteed in PHC consultations and those who did not reside continuously in the municipalities outlined and, lastly, those cases in which precise information in relation to the measurements required to carry out the study was not available were excluded.
Recording of dataThe data were extracted electronically from the e-cap medical history programme of the Catalan Health Institute. Cardiac and cerebral events which occurred in 2013 recorded in the computerised history according to the diagnostic codes of the electronic edition of the international classification of diseases (ICD-10) were obtained. Sociodemographic data (age and gender), as well as the existence of recording in the medical history (MH) of smoking, HTN, DM, DLP and obesity were collected, taking into account that such diagnoses existed, although these were not reflected explicitly in the MH, if the subject received antihypertensive, antidiabetic or lipid-lowering treatment, respectively. The following diagnostic criteria were assumed for the different CVRFs: HTN, defined as the elevation of systolic blood pressure (SBP)≥140mmHg and/or diastolic blood pressure (DBP)≥90mmHg, DM if any of the following criteria were met: baseline fasting blood glucose ≥126mg/dl (7mmol/l) on two occasions, blood glucose 2h after the oral glucose tolerance test ≥200mg/dl (11.1mmol/l) on two occasions, random blood glucose ≥200mg/dl (11.1mmol/l) along with typical symptoms, glycated haemoglobin (HbA1c)≥6.5% on two occasions or one occasion if it was associated with any of the above criteria, and DLP defined for total cholesterol (Tot-C) values ≥200mg/dl (5.8mmol/l) and/or TGs≥150mg/dl. In the case of obesity, it was considered a valid diagnosis, although this was not coded in the MH, if the body mass index (BMI), determined as the ratio between the weight of the subject in kg and their height measured in metres squared, was equal to or greater than 30kg/m2.19 The values for the blood tests and clinical signs that were taken into consideration were those closest to the event, provided that they had been recorded in the MH within the two years prior to the onset of the same; following this premise, the following were collected: Tot-C, LDL-C, HDL-C and TGs, SBP, DBP, BMI and glycated haemoglobin in diabetic patients. Optimal lipid control was considered if they reached the following targets: LDL-C≤130mg/dl, HDL-C≥40mg/dl in males, HDL-C≥50mg/dl in females and TG<150mg/dl.19 For the measurement of the different AIs, the following ratios and control targets were used for primary prevention: Tot-C/HDL-C with optimal values if <4.5mg/dl in males and <4 in females and TG/HDL-C<2 in both genders.20 For the remaining CVRFs analysed, the control target was considered reached if SBP/DBP was <140/90mmHg, tobacco was not consumed, HbA1c in diabetics was below 7% and BMI<25kg/m2.21
The REGICOR equation was used to quantify the CVR.22 Finally, the existence of lipid-lowering pharmacological treatment prior to the event was collected with the following drugs: pravastatin, lovastatin, simvastatin, atorvastatin, rosuvastatin, pitavastatin, ezetimibe and fenofibrate.
Statistical analysisWe describe the results using frequencies for discrete variables, means and standard deviation (SD) for the continuous variables. We used the chi-square test for the comparison of frequencies and the Student's t-test for independent samples for the comparison of means. We used the analysis of variance in the case of comparing means from three or more groups. The processing of the information obtained and the analysis of the results was performed using the statistical program SPSS version 18.
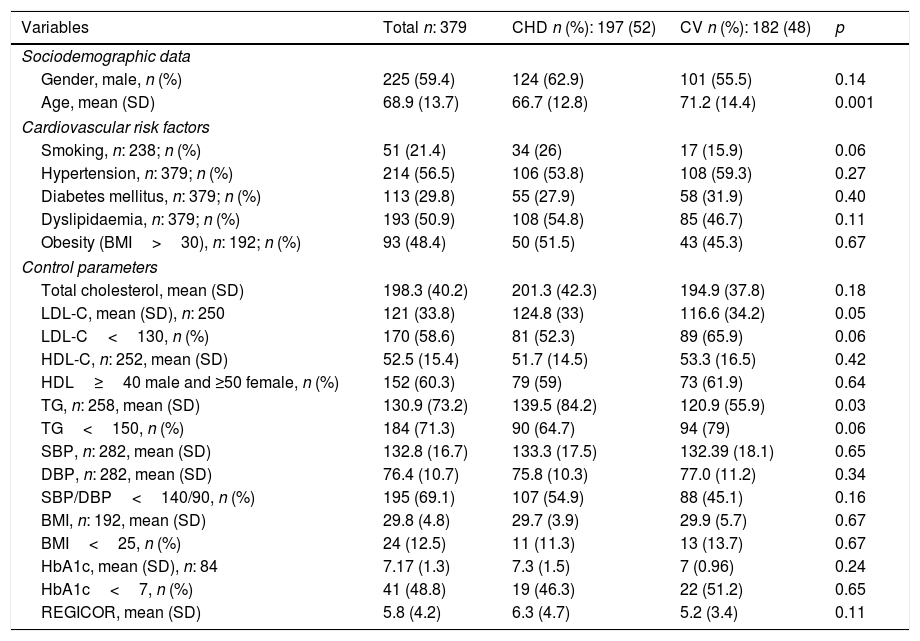
ResultsThree-hundred and seventy-nine subjects presented with a first cardiovascular event in 2013: 197 (52%) in the heart and 182 (48%) in the brain. Two-hundred and twenty-five (59.4%) were male and the mean age at the time of diagnosis was 68.9 (SD 13.7), 66.7 (SD 12.8) in patients who suffered the accident in the heart compared to 71.2 (SD 14.4) who suffered it in the brain (p: 0.001). Table 1 shows the general characteristics of the population studied, the associated CVRFs and their degrees of control, as well as the differences detected according to the affected vascular territory, CHD or CV. DLP was present in 193 (50.9%) subjects, smoking in 51 (21.4%), HTN in 214 (56.5%), DM in 113 (29.8%) and obesity in 93 (48.4%) individuals. The mean value of Tot-C prior to the event was 198.3mg/dl (SD 40.2) and that of LDL-C was 121mg/dl (SD 33.8). In patients who presented with CHD, LDL-C means of 124.8mg/dl (SD 33) vs 116.6mg/dl (SD 34.2) of those who suffered from a CV event were recorded (p: 0.05). One hundred and seventy individuals (58.6%) presented values for this lipid parameter below 130mg/dl, 81 (52.3%) in CHD vs 89 (65.9%) in CV (p: 0.06). The mean values of HDL-C prior to the event were 52.5 (SD 15.4) and those of TGs were 130.9mg/dl (SD 73.2). Patients who suffered from CHD recorded mean TG values of 139.5mg/dl (SD 84.2) vs the 120.9mg/dl (SD 55.9) presented by subjects with CV involvement (p: 0.003). In 192 cases, information was available on BMI; 93 of them (48.4%) presented values ≥30kg/m2, in 75 (39.1%) their BMI was between 25 and 29.9kg/m2, and in 24 (12.5%) it was <25mg/kg2. The means for SBP and DBP were 132.8mmHg (SD 16.7) and 76.4mmHg (SD 10.7), respectively, and 195 individuals (69.1%) presented controls of SBP and DBP <140/90mmHg. The mean REGICOR value was 5.83 (SD 4.2).
Cardiovascular risk factors and control parameters. General and comparative data according to affected vascular territory.
| Variables | Total n: 379 | CHD n (%): 197 (52) | CV n (%): 182 (48) | p |
|---|---|---|---|---|
| Sociodemographic data | ||||
| Gender, male, n (%) | 225 (59.4) | 124 (62.9) | 101 (55.5) | 0.14 |
| Age, mean (SD) | 68.9 (13.7) | 66.7 (12.8) | 71.2 (14.4) | 0.001 |
| Cardiovascular risk factors | ||||
| Smoking, n: 238; n (%) | 51 (21.4) | 34 (26) | 17 (15.9) | 0.06 |
| Hypertension, n: 379; n (%) | 214 (56.5) | 106 (53.8) | 108 (59.3) | 0.27 |
| Diabetes mellitus, n: 379; n (%) | 113 (29.8) | 55 (27.9) | 58 (31.9) | 0.40 |
| Dyslipidaemia, n: 379; n (%) | 193 (50.9) | 108 (54.8) | 85 (46.7) | 0.11 |
| Obesity (BMI>30), n: 192; n (%) | 93 (48.4) | 50 (51.5) | 43 (45.3) | 0.67 |
| Control parameters | ||||
| Total cholesterol, mean (SD) | 198.3 (40.2) | 201.3 (42.3) | 194.9 (37.8) | 0.18 |
| LDL-C, mean (SD), n: 250 | 121 (33.8) | 124.8 (33) | 116.6 (34.2) | 0.05 |
| LDL-C<130, n (%) | 170 (58.6) | 81 (52.3) | 89 (65.9) | 0.06 |
| HDL-C, n: 252, mean (SD) | 52.5 (15.4) | 51.7 (14.5) | 53.3 (16.5) | 0.42 |
| HDL≥40 male and ≥50 female, n (%) | 152 (60.3) | 79 (59) | 73 (61.9) | 0.64 |
| TG, n: 258, mean (SD) | 130.9 (73.2) | 139.5 (84.2) | 120.9 (55.9) | 0.03 |
| TG<150, n (%) | 184 (71.3) | 90 (64.7) | 94 (79) | 0.06 |
| SBP, n: 282, mean (SD) | 132.8 (16.7) | 133.3 (17.5) | 132.39 (18.1) | 0.65 |
| DBP, n: 282, mean (SD) | 76.4 (10.7) | 75.8 (10.3) | 77.0 (11.2) | 0.34 |
| SBP/DBP<140/90, n (%) | 195 (69.1) | 107 (54.9) | 88 (45.1) | 0.16 |
| BMI, n: 192, mean (SD) | 29.8 (4.8) | 29.7 (3.9) | 29.9 (5.7) | 0.67 |
| BMI<25, n (%) | 24 (12.5) | 11 (11.3) | 13 (13.7) | 0.67 |
| HbA1c, mean (SD), n: 84 | 7.17 (1.3) | 7.3 (1.5) | 7 (0.96) | 0.24 |
| HbA1c<7, n (%) | 41 (48.8) | 19 (46.3) | 22 (51.2) | 0.65 |
| REGICOR, mean (SD) | 5.8 (4.2) | 6.3 (4.7) | 5.2 (3.4) | 0.11 |
BMI: body mass index (kg/m2); DBP: diastolic blood pressure (mmHg); HbA1c: glycated haemoglobin (%); HDL-C: high-density lipoprotein cholesterol (mg/dl); LDL-C: low-density lipoprotein cholesterol (mg/dl); n: number of patients; REGICOR: cardiovascular risk using REGICOR equation (%); SBP: systolic blood pressure (mmHg); SD: standard deviation; TG: triglycerides (mg/dl).
Finally, of the 193 individuals with a diagnosis of DLP, 87 (45.1%) received lipid-lowering pharmacological treatment before presenting with their first cardiovascular event, 54 (50%) in CHD and 33 (38.8%) in CV.
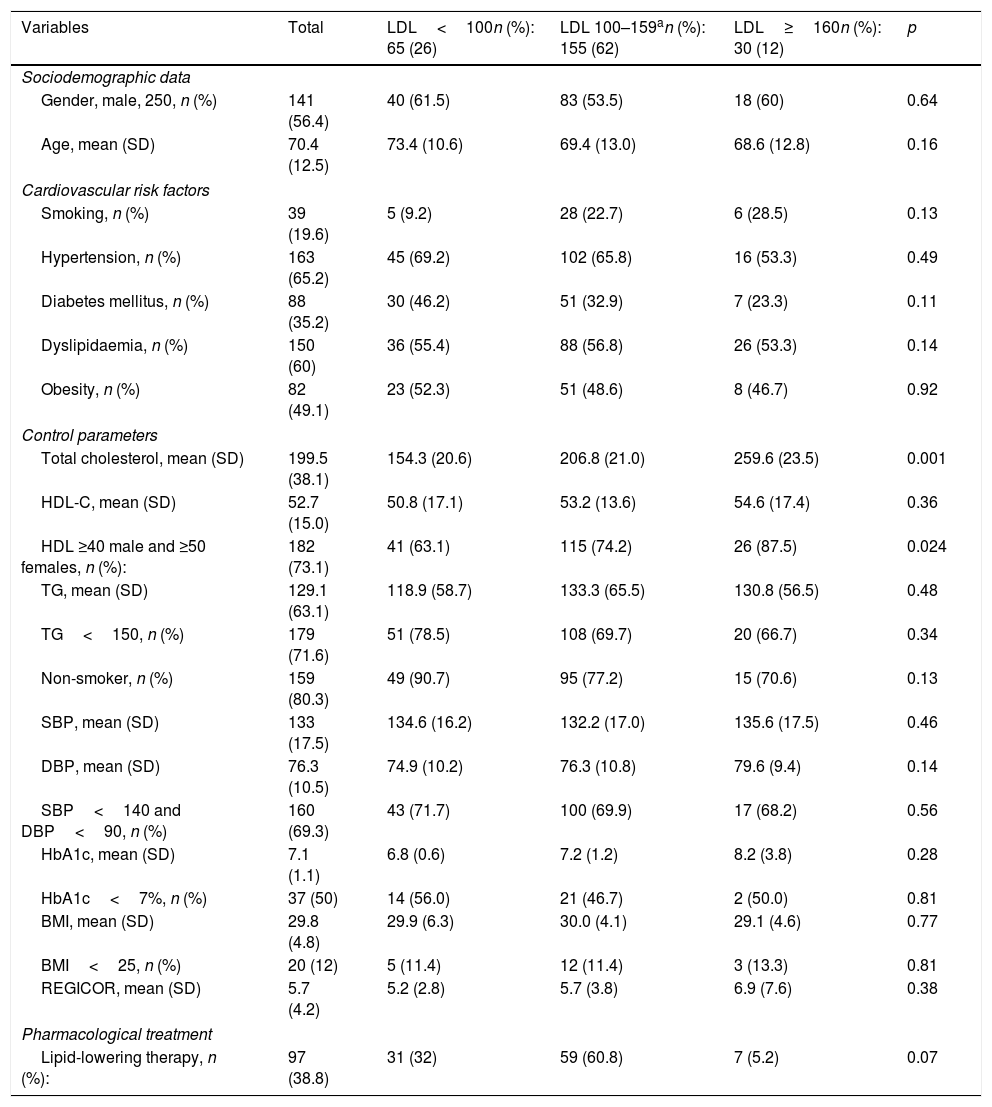
The volume of patients affected, as well as the distribution of the different CVRFs, their degree of control and the use of lipid-lowering treatment, according to levels of LDL and HDL cholesterol and TGs prior to the suffering of the first ischaemic cardiovascular event are represented in Tables 2–4. Of the 379 cases evaluated, LDL and HDL-C values had been recorded in 250 before the event. Sixty-five individuals (26%) presented with LDL-C values <100mg/dl, 155 (62%) 100–159mg/dl, and 30 (12%) ≥160mg/dl. Of all them, 182 (73.1%) reported HDL figures ≥40 males/≥50 females, 41 (63.1%) in the subgroup of patients with LDL<100mg/dl, 115 (74.2%) of LDL-C 100–159mg/dl, and 26 (87.5%) in that of LDL-C ≥160mg/dl, p: 0.024.
Cardiovascular risk factors, control parameters and use of drugs according to LDL-C levels (mg/dl) prior to the suffering of the first ischaemic cardiovascular event.
| Variables | Total | LDL<100n (%): 65 (26) | LDL 100–159an (%): 155 (62) | LDL≥160n (%): 30 (12) | p |
|---|---|---|---|---|---|
| Sociodemographic data | |||||
| Gender, male, 250, n (%) | 141 (56.4) | 40 (61.5) | 83 (53.5) | 18 (60) | 0.64 |
| Age, mean (SD) | 70.4 (12.5) | 73.4 (10.6) | 69.4 (13.0) | 68.6 (12.8) | 0.16 |
| Cardiovascular risk factors | |||||
| Smoking, n (%) | 39 (19.6) | 5 (9.2) | 28 (22.7) | 6 (28.5) | 0.13 |
| Hypertension, n (%) | 163 (65.2) | 45 (69.2) | 102 (65.8) | 16 (53.3) | 0.49 |
| Diabetes mellitus, n (%) | 88 (35.2) | 30 (46.2) | 51 (32.9) | 7 (23.3) | 0.11 |
| Dyslipidaemia, n (%) | 150 (60) | 36 (55.4) | 88 (56.8) | 26 (53.3) | 0.14 |
| Obesity, n (%) | 82 (49.1) | 23 (52.3) | 51 (48.6) | 8 (46.7) | 0.92 |
| Control parameters | |||||
| Total cholesterol, mean (SD) | 199.5 (38.1) | 154.3 (20.6) | 206.8 (21.0) | 259.6 (23.5) | 0.001 |
| HDL-C, mean (SD) | 52.7 (15.0) | 50.8 (17.1) | 53.2 (13.6) | 54.6 (17.4) | 0.36 |
| HDL ≥40 male and ≥50 females, n (%): | 182 (73.1) | 41 (63.1) | 115 (74.2) | 26 (87.5) | 0.024 |
| TG, mean (SD) | 129.1 (63.1) | 118.9 (58.7) | 133.3 (65.5) | 130.8 (56.5) | 0.48 |
| TG<150, n (%) | 179 (71.6) | 51 (78.5) | 108 (69.7) | 20 (66.7) | 0.34 |
| Non-smoker, n (%) | 159 (80.3) | 49 (90.7) | 95 (77.2) | 15 (70.6) | 0.13 |
| SBP, mean (SD) | 133 (17.5) | 134.6 (16.2) | 132.2 (17.0) | 135.6 (17.5) | 0.46 |
| DBP, mean (SD) | 76.3 (10.5) | 74.9 (10.2) | 76.3 (10.8) | 79.6 (9.4) | 0.14 |
| SBP<140 and DBP<90, n (%) | 160 (69.3) | 43 (71.7) | 100 (69.9) | 17 (68.2) | 0.56 |
| HbA1c, mean (SD) | 7.1 (1.1) | 6.8 (0.6) | 7.2 (1.2) | 8.2 (3.8) | 0.28 |
| HbA1c<7%, n (%) | 37 (50) | 14 (56.0) | 21 (46.7) | 2 (50.0) | 0.81 |
| BMI, mean (SD) | 29.8 (4.8) | 29.9 (6.3) | 30.0 (4.1) | 29.1 (4.6) | 0.77 |
| BMI<25, n (%) | 20 (12) | 5 (11.4) | 12 (11.4) | 3 (13.3) | 0.81 |
| REGICOR, mean (SD) | 5.7 (4.2) | 5.2 (2.8) | 5.7 (3.8) | 6.9 (7.6) | 0.38 |
| Pharmacological treatment | |||||
| Lipid-lowering therapy, n (%): | 97 (38.8) | 31 (32) | 59 (60.8) | 7 (5.2) | 0.07 |
Alb/creat: first-void albumin/creatinine ratio; BMI: body mass index; DBP: diastolic blood pressure; GF: glomerular filtration; HbA1c: glycated haemoglobin in diabetics; HDL-C: high-density lipoprotein cholesterol; LDL: low-density lipoprotein cholesterol; n: number of patients; REGICOR: cardiovascular risk using REGICOR equation; SBP: systolic blood pressure; SD: standard deviation; TG: triglycerides.
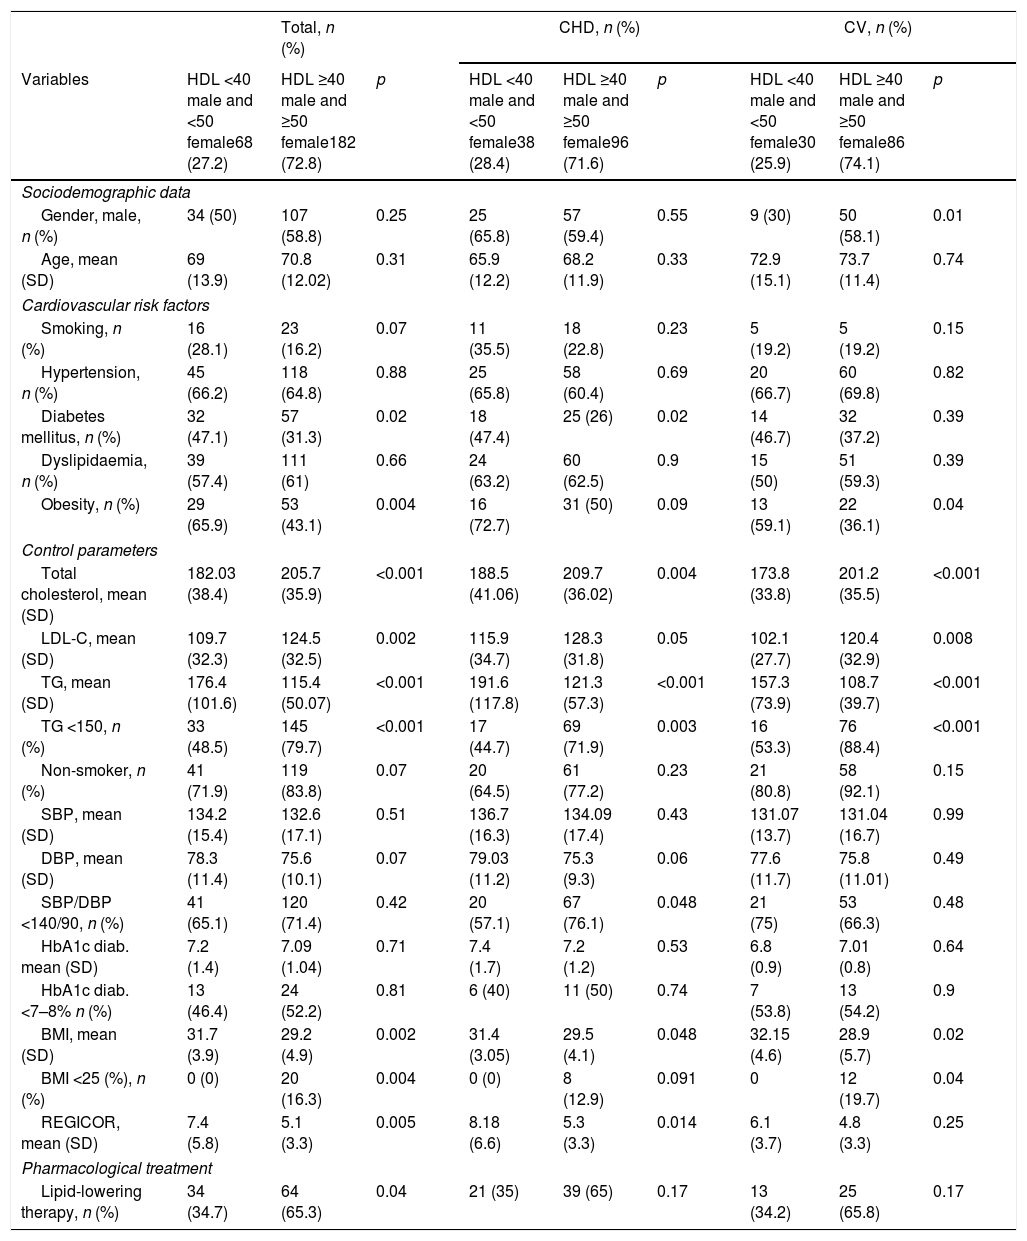
Cardiovascular risk factors, control parameters and use of drugs according to HDL-C levels (mg/dl) prior to the suffering of the first ischaemic cardiovascular event.
| Total, n (%) | CHD, n (%) | CV, n (%) | |||||||
|---|---|---|---|---|---|---|---|---|---|
| Variables | HDL <40 male and <50 female68 (27.2) | HDL ≥40 male and ≥50 female182 (72.8) | p | HDL <40 male and <50 female38 (28.4) | HDL ≥40 male and ≥50 female96 (71.6) | p | HDL <40 male and <50 female30 (25.9) | HDL ≥40 male and ≥50 female86 (74.1) | p |
| Sociodemographic data | |||||||||
| Gender, male, n (%) | 34 (50) | 107 (58.8) | 0.25 | 25 (65.8) | 57 (59.4) | 0.55 | 9 (30) | 50 (58.1) | 0.01 |
| Age, mean (SD) | 69 (13.9) | 70.8 (12.02) | 0.31 | 65.9 (12.2) | 68.2 (11.9) | 0.33 | 72.9 (15.1) | 73.7 (11.4) | 0.74 |
| Cardiovascular risk factors | |||||||||
| Smoking, n (%) | 16 (28.1) | 23 (16.2) | 0.07 | 11 (35.5) | 18 (22.8) | 0.23 | 5 (19.2) | 5 (19.2) | 0.15 |
| Hypertension, n (%) | 45 (66.2) | 118 (64.8) | 0.88 | 25 (65.8) | 58 (60.4) | 0.69 | 20 (66.7) | 60 (69.8) | 0.82 |
| Diabetes mellitus, n (%) | 32 (47.1) | 57 (31.3) | 0.02 | 18 (47.4) | 25 (26) | 0.02 | 14 (46.7) | 32 (37.2) | 0.39 |
| Dyslipidaemia, n (%) | 39 (57.4) | 111 (61) | 0.66 | 24 (63.2) | 60 (62.5) | 0.9 | 15 (50) | 51 (59.3) | 0.39 |
| Obesity, n (%) | 29 (65.9) | 53 (43.1) | 0.004 | 16 (72.7) | 31 (50) | 0.09 | 13 (59.1) | 22 (36.1) | 0.04 |
| Control parameters | |||||||||
| Total cholesterol, mean (SD) | 182.03 (38.4) | 205.7 (35.9) | <0.001 | 188.5 (41.06) | 209.7 (36.02) | 0.004 | 173.8 (33.8) | 201.2 (35.5) | <0.001 |
| LDL-C, mean (SD) | 109.7 (32.3) | 124.5 (32.5) | 0.002 | 115.9 (34.7) | 128.3 (31.8) | 0.05 | 102.1 (27.7) | 120.4 (32.9) | 0.008 |
| TG, mean (SD) | 176.4 (101.6) | 115.4 (50.07) | <0.001 | 191.6 (117.8) | 121.3 (57.3) | <0.001 | 157.3 (73.9) | 108.7 (39.7) | <0.001 |
| TG <150, n (%) | 33 (48.5) | 145 (79.7) | <0.001 | 17 (44.7) | 69 (71.9) | 0.003 | 16 (53.3) | 76 (88.4) | <0.001 |
| Non-smoker, n (%) | 41 (71.9) | 119 (83.8) | 0.07 | 20 (64.5) | 61 (77.2) | 0.23 | 21 (80.8) | 58 (92.1) | 0.15 |
| SBP, mean (SD) | 134.2 (15.4) | 132.6 (17.1) | 0.51 | 136.7 (16.3) | 134.09 (17.4) | 0.43 | 131.07 (13.7) | 131.04 (16.7) | 0.99 |
| DBP, mean (SD) | 78.3 (11.4) | 75.6 (10.1) | 0.07 | 79.03 (11.2) | 75.3 (9.3) | 0.06 | 77.6 (11.7) | 75.8 (11.01) | 0.49 |
| SBP/DBP <140/90, n (%) | 41 (65.1) | 120 (71.4) | 0.42 | 20 (57.1) | 67 (76.1) | 0.048 | 21 (75) | 53 (66.3) | 0.48 |
| HbA1c diab. mean (SD) | 7.2 (1.4) | 7.09 (1.04) | 0.71 | 7.4 (1.7) | 7.2 (1.2) | 0.53 | 6.8 (0.9) | 7.01 (0.8) | 0.64 |
| HbA1c diab. <7–8% n (%) | 13 (46.4) | 24 (52.2) | 0.81 | 6 (40) | 11 (50) | 0.74 | 7 (53.8) | 13 (54.2) | 0.9 |
| BMI, mean (SD) | 31.7 (3.9) | 29.2 (4.9) | 0.002 | 31.4 (3.05) | 29.5 (4.1) | 0.048 | 32.15 (4.6) | 28.9 (5.7) | 0.02 |
| BMI <25 (%), n (%) | 0 (0) | 20 (16.3) | 0.004 | 0 (0) | 8 (12.9) | 0.091 | 0 | 12 (19.7) | 0.04 |
| REGICOR, mean (SD) | 7.4 (5.8) | 5.1 (3.3) | 0.005 | 8.18 (6.6) | 5.3 (3.3) | 0.014 | 6.1 (3.7) | 4.8 (3.3) | 0.25 |
| Pharmacological treatment | |||||||||
| Lipid-lowering therapy, n (%) | 34 (34.7) | 64 (65.3) | 0.04 | 21 (35) | 39 (65) | 0.17 | 13 (34.2) | 25 (65.8) | 0.17 |
BMI: body mass index; DBP: diastolic blood pressure; HbA1c (diab.): glycated haemoglobin in diabetics; HDL: high-density lipoprotein cholesterol; LDL-C: low-density lipoprotein cholesterol; n: number of patients; REGICOR: REGICOR cardiovascular risk; SBP: systolic blood pressure; SD: standard deviation; TG: triglycerides.
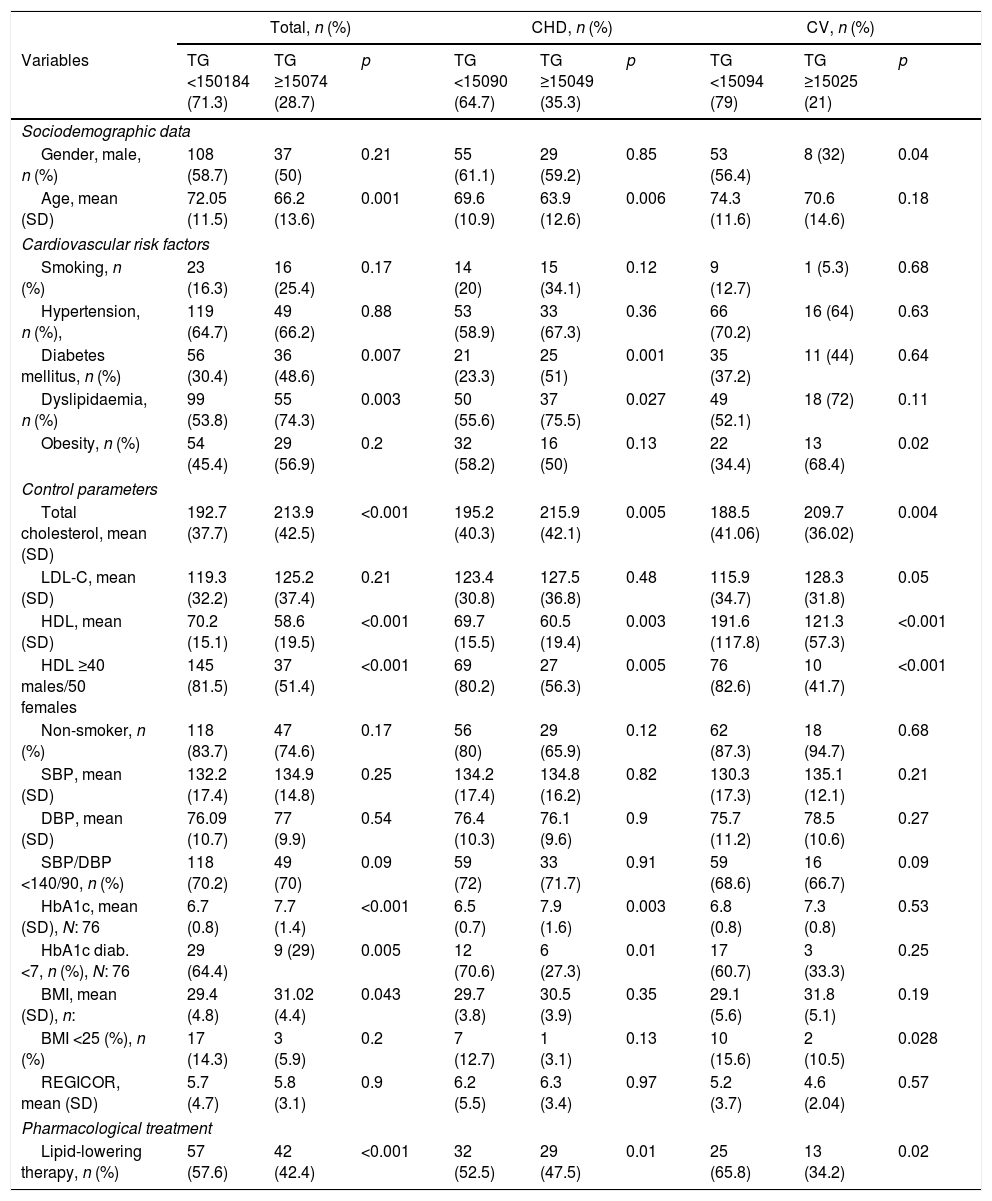
Cardiovascular risk factors, control parameters and use of drugs according to TG levels (mg/dl) prior to the suffering of the first ischaemic cardiovascular event.
| Total, n (%) | CHD, n (%) | CV, n (%) | |||||||
|---|---|---|---|---|---|---|---|---|---|
| Variables | TG <150184 (71.3) | TG ≥15074 (28.7) | p | TG <15090 (64.7) | TG ≥15049 (35.3) | p | TG <15094 (79) | TG ≥15025 (21) | p |
| Sociodemographic data | |||||||||
| Gender, male, n (%) | 108 (58.7) | 37 (50) | 0.21 | 55 (61.1) | 29 (59.2) | 0.85 | 53 (56.4) | 8 (32) | 0.04 |
| Age, mean (SD) | 72.05 (11.5) | 66.2 (13.6) | 0.001 | 69.6 (10.9) | 63.9 (12.6) | 0.006 | 74.3 (11.6) | 70.6 (14.6) | 0.18 |
| Cardiovascular risk factors | |||||||||
| Smoking, n (%) | 23 (16.3) | 16 (25.4) | 0.17 | 14 (20) | 15 (34.1) | 0.12 | 9 (12.7) | 1 (5.3) | 0.68 |
| Hypertension, n (%), | 119 (64.7) | 49 (66.2) | 0.88 | 53 (58.9) | 33 (67.3) | 0.36 | 66 (70.2) | 16 (64) | 0.63 |
| Diabetes mellitus, n (%) | 56 (30.4) | 36 (48.6) | 0.007 | 21 (23.3) | 25 (51) | 0.001 | 35 (37.2) | 11 (44) | 0.64 |
| Dyslipidaemia, n (%) | 99 (53.8) | 55 (74.3) | 0.003 | 50 (55.6) | 37 (75.5) | 0.027 | 49 (52.1) | 18 (72) | 0.11 |
| Obesity, n (%) | 54 (45.4) | 29 (56.9) | 0.2 | 32 (58.2) | 16 (50) | 0.13 | 22 (34.4) | 13 (68.4) | 0.02 |
| Control parameters | |||||||||
| Total cholesterol, mean (SD) | 192.7 (37.7) | 213.9 (42.5) | <0.001 | 195.2 (40.3) | 215.9 (42.1) | 0.005 | 188.5 (41.06) | 209.7 (36.02) | 0.004 |
| LDL-C, mean (SD) | 119.3 (32.2) | 125.2 (37.4) | 0.21 | 123.4 (30.8) | 127.5 (36.8) | 0.48 | 115.9 (34.7) | 128.3 (31.8) | 0.05 |
| HDL, mean (SD) | 70.2 (15.1) | 58.6 (19.5) | <0.001 | 69.7 (15.5) | 60.5 (19.4) | 0.003 | 191.6 (117.8) | 121.3 (57.3) | <0.001 |
| HDL ≥40 males/50 females | 145 (81.5) | 37 (51.4) | <0.001 | 69 (80.2) | 27 (56.3) | 0.005 | 76 (82.6) | 10 (41.7) | <0.001 |
| Non-smoker, n (%) | 118 (83.7) | 47 (74.6) | 0.17 | 56 (80) | 29 (65.9) | 0.12 | 62 (87.3) | 18 (94.7) | 0.68 |
| SBP, mean (SD) | 132.2 (17.4) | 134.9 (14.8) | 0.25 | 134.2 (17.4) | 134.8 (16.2) | 0.82 | 130.3 (17.3) | 135.1 (12.1) | 0.21 |
| DBP, mean (SD) | 76.09 (10.7) | 77 (9.9) | 0.54 | 76.4 (10.3) | 76.1 (9.6) | 0.9 | 75.7 (11.2) | 78.5 (10.6) | 0.27 |
| SBP/DBP <140/90, n (%) | 118 (70.2) | 49 (70) | 0.09 | 59 (72) | 33 (71.7) | 0.91 | 59 (68.6) | 16 (66.7) | 0.09 |
| HbA1c, mean (SD), N: 76 | 6.7 (0.8) | 7.7 (1.4) | <0.001 | 6.5 (0.7) | 7.9 (1.6) | 0.003 | 6.8 (0.8) | 7.3 (0.8) | 0.53 |
| HbA1c diab. <7, n (%), N: 76 | 29 (64.4) | 9 (29) | 0.005 | 12 (70.6) | 6 (27.3) | 0.01 | 17 (60.7) | 3 (33.3) | 0.25 |
| BMI, mean (SD), n: | 29.4 (4.8) | 31.02 (4.4) | 0.043 | 29.7 (3.8) | 30.5 (3.9) | 0.35 | 29.1 (5.6) | 31.8 (5.1) | 0.19 |
| BMI <25 (%), n (%) | 17 (14.3) | 3 (5.9) | 0.2 | 7 (12.7) | 1 (3.1) | 0.13 | 10 (15.6) | 2 (10.5) | 0.028 |
| REGICOR, mean (SD) | 5.7 (4.7) | 5.8 (3.1) | 0.9 | 6.2 (5.5) | 6.3 (3.4) | 0.97 | 5.2 (3.7) | 4.6 (2.04) | 0.57 |
| Pharmacological treatment | |||||||||
| Lipid-lowering therapy, n (%) | 57 (57.6) | 42 (42.4) | <0.001 | 32 (52.5) | 29 (47.5) | 0.01 | 25 (65.8) | 13 (34.2) | 0.02 |
BMI: body mass index; DBP: diastolic blood pressure; HbA1c (diab.): glycated haemoglobin in diabetics; HDL: high-density lipoprotein cholesterol; LDL-C: low-density lipoprotein cholesterol; n: number of patients; REGICOR: cardiovascular risk by REGICOR equation; SBP: systolic blood pressure; SD: standard deviation; TG: triglycerides.
Sixty-eight individuals (27.2%) presented HDL-C figures <40 male and <50 female, and, in this subgroup, in comparison with that of HDL≥40 males/≥50 females, a DM prevalence of 47.1 vs 31.3% p: 0.026, and of obesity 65.9 vs 43.1 p: 0.004 was observed. The mean Tot-C values in the HDL group <40 in males and <50 in females vs that of HDL≥40 males/≥50 females was of 182.03mg/dl (SD 38.4) vs 205.7mg/dl (SD 35.9), p<0.001; those of LDL-C were 109.7 (SD 32.3) vs 124.5 (SD 32.5) p: 0.002, those of TGs 176.4 (SD 101.6) vs 115.4 (SD 50.07) p: <0.001 and those of REGICOR 7.4 (SD 5.8) vs 5.1 (SD 3.3) p: 0.005, respectively. Table 3 shows the differences observed in the comparative analysis according to the affected vascular territory, CHD or CV. Thirty-four individuals with HDL <40 in males and <50 in females (34.7%) received lipid-lowering pharmacological treatment prior to the event, compared to the 64 (65.3%) patients treated from the group with higher HDL values, p: 0.04).
Of the 258 individuals in whom TG values had been recorded, in 74 (28.7%) figures ≥150mg/dl were observed. These had a mean age of 66.2 years (SD 13.6) vs 72.05 years (SD 11.5) of those who reported values <150mg/dl, p: 0.001. The prevalence of DM was 48.6 vs 30.4% p: 0.007 and the mean BMI was 31.02 (SD 4.4) vs 29.4 (SD 4.8), respectively, p: 0.04; in the subgroup of patients with TGs<150mg/dl, 145 (81.5%) presented HDL values ≥40 males/≥50 females compared to the 37 (51.4%) of the subgroup with TGs≥150mg/dl, p<0.001. The mean values of glycated Hb in the subgroup of patients with TGs <150mg/dl was 6.7 (SD 0.8) versus 7.7 (SD 1.4) of those who presented TG figures ≥150mg/dl, p<0.001. Fifty-seven (57.6%) subjects with TGs<150mg/dl received previous lipid-lowering pharmacological treatment compared to the 42 (42.4%) of the subgroup with TGs>150mg/dl (p<0.001). Table 4 shows the comparative analysis according to the affected vascular territory.
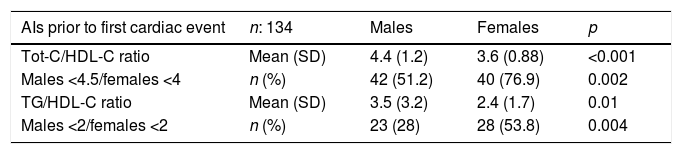
The mean Tot-C/HDL-C value was 5.4 (17.4): 6.0 (21.3) in males vs 4.6 (10.3) in females, and that of TG/HDL-C was 2.8 (2.3): 3.1 (2.7) in males vs 2.5 (1.7) in females. In 67% of the subjects evaluated, Tot-C/HDL-C values <4.5 males/<4 females, and in 39.8% a TG/HDL-C ratio <2 were observed. Table 5 shows the mean values and the degree of control of the main atherogenic indices, according to gender and affected vascular territory, which the patients presented before the suffering of their first cardiovascular event.
Mean values and degree of control of the main atherogenic indices used in PHC before the suffering of the cardiac and cerebral cardiovascular event, according to gender.
| AIs prior to first cardiac event | n: 134 | Males | Females | p |
|---|---|---|---|---|
| Tot-C/HDL-C ratio | Mean (SD) | 4.4 (1.2) | 3.6 (0.88) | <0.001 |
| Males <4.5/females <4 | n (%) | 42 (51.2) | 40 (76.9) | 0.002 |
| TG/HDL-C ratio | Mean (SD) | 3.5 (3.2) | 2.4 (1.7) | 0.01 |
| Males <2/females <2 | n (%) | 23 (28) | 28 (53.8) | 0.004 |
| AIs prior to first CV event | n: 118 | Males | Females | p |
|---|---|---|---|---|
| Tot-C/HDL-C ratio | Mean (SD) | 8.1 (32.8) | 5.4 (14.2) | 0.56 |
| Males <4.5/females <4 | n (%) | 42 (70) | 45 (77.6) | 0.23 |
| TG/HDL-C ratio | Mean (SD) | 2.4 (1.6) | 2.6 (1.7) | 0.52 |
| Males <2/females <2 | n (%) | 25 (41.7) | 24 (42.1) | 0.55 |
AI: atherogenic index; HDL-C: high-density lipoprotein cholesterol; n: number of patients; PHC: primary health care; SD: standard deviation; Tot-C: total cholesterol; TG: triglycerides.
This study aims to show a general overview of the lipid behaviour prior to the suffering of the first major cardiovascular event in real clinical practice conditions in a Primary Care Service of Catalonia.
Of the total number of ischaemic events recorded in our field throughout 2013, a little more than half affected the cardiac territory, with a higher incidence in the male gender and a mean age at the time of suffering from it of 69. Approximately half of patients affected are hypertensive, dyslipidaemic and obese, and almost 30% are diabetic. In Spain, multiple studies have been carried out with the intention of determining the prevalence of the main CVRFs with highly variable results, a variability that is due to the enormous methodological differences between them, and, in the case of DLP, to the different Tot-C and LDL-C values considered for their diagnosis, values that have been subjected to constant modifications to adapt to the new and changing scientific evidence. The HISPALIPID study,23 performed in a population mainly seen in PHC consultations, reports a prevalence of hypercholesterolaemia for Tot-C values ≥250mg/dl of 20%, which would rise to 50% if the cut-off value considered for the diagnosis was 200mg/dl, and already in the population base, the ENRICA study24 reports prevalences of 50.5%, also very similar to the results obtained in our study. The behaviour of the remaining CVRFs in our field presents more discrepancies when we compare them with two large population studies published in Spain in the last decade, Di@betes.es25 and DARIOS,26 with prevalences for HTN, diabetes and obesity lower than those obtained in our study, something that would be within expectations, given that the studies on population seen, like ours, tend to overestimate the results as they are performed on patients who consult the health system and those who are assumed to have a greater underlying pathological burden. In any event, the CVRFs mentioned are those which form part of MS, a clinical condition that, although it has not been without controversy in terms of its concept, has proven its relationship with coronary heart disease very well.27 We do not have the necessary data to be able to guarantee the diagnosis of MS in the patients studied, but, in view of the prevalence reported for each one of its components, we could suggest that at least part of them would fulfil the criteria necessary for its diagnosis.28
The mean Tot-C, LDL-C and HDL-C values obtained in our study are similar to those published in the literature.24,26,29 A total of 58.6% of the individuals who subsequently presented with a cardiac or cerebrovascular accident presented with LDL-C values within the targets marked as optimal, a little higher than the 55.1% reported by ENRICA,24 the protocol of which also considered appropriate management for this lipid parameter to be the obtainment of figures lower than 130mg/dl, while the percentage of patients in optimal range of control for HDL-C and TG was lower in our study, 60.3 and 71.3% vs 74 and 82.6%, respectively.
More than half of the subjects who suffered their first cardiovascular event in 2013 presented with previous values of LDL-C between 100 and 159mg/dl and only 12% exceeded 160; on the other hand, if we observe the distribution of ischaemic episodes according to the degree of control of HDL-C and TG, we see that, in more than 70% of cases, the events occur in patients with satisfactory controls of these lipid fractions. In view of these figures, it seems that quite a number of the patients studied presented a lipid profile that we could consider optimal or acceptable before suffering from the event, which confirms the fact that CVD is not something with a single risk factor, and therefore the approach has to be comprehensive.
Among the results obtained when analysing the behaviour of HDL-C and TGs, it seems important to us to identify that patients with diabetes and who are obese are those who, with a greater prevalence, nourish the group of individuals who showed controls of HDL-C and TGs outside the target, and this is something that is repeated in the references consulted.30,31 In relation to the obesity and HDL-C link, it is striking that, in our study, there was not one individual with suboptimal values of HDL-C in the normal weight range and that, as expected, this group of patients shows mean CVR-REGICOR scores significantly higher than those observed in subjects with higher HDL-C values, reaching statistical significance both in the general analysis and in patients with CHD. The explanation seems logical. As we all know, the value of this lipid fraction is used as a protective cardiovascular factor in the majority of risk scales, and REGICOR is no exception.22 Furthermore, we think it is interesting to point out that diabetics with high TGs present significantly higher HbA1c means and a lower percentage of patients in optimal control range (HbA1c<7%) than the group of patients with TGs in optimal values. With regard to the defining AIs, among others, of DLP-A,15,20 we see that the mean values, both of Tot-C/HDL-C and of TG/HDL-C are located above the levels considered optimal and when the differences in the behaviour of these AIs are analysed according to gender, we observe better control in the female gender among patients who, subsequently, presented a first ischaemic event in the cardiac territory.
It is very striking that only 24 of the 192 individuals in whom BMI values had been recorded (12.5%), were maintained below 25kg/m2, with a mean for the entire group of 29.8kg/m2. The remainder, 168 patients (87.5%) were overweight or obese; these data seem very relevant to us, confirming that, of all the CVRFs studied, this is the one which presents, to a great extent, the worse degree of control, a fact that is repeated when the two vascular territories are analysed individually. In this sense, and given the relationships shown of this CVRF with cardiovascular morbidity and mortality, including heart failure,32,33 its optimisation faces us as a clear opportunity for improvement.
The data that we handled in this study lead us to think that the mean values of the different lipid fractions prior to the first ischaemic cardiovascular accident in our field are not excessively high. Moreover, they can be considered moderate or even acceptable in some cases, and with an estimated mean REGICOR value of 5.8 (SD 4.2), which would fit in a moderate risk level, without forgetting that there are also patients at a moderate risk level verging on high. We do have a high percentage of subjects who are obese or overweight, who present lower levels of HDL-C and higher TGs than individuals who are a normal weight, with some mean values of Tot-C/HDL-C above the acceptable, and with a relevant percentage of cases being carriers of small and dense lipoproteins, with greater atherogenic potency, according to the results obtained when analysing the TG/HDL-C ratio.
This study has several limitations, which requires us to carry out a careful interpretation of the results. The fact that the data collection was performed from the electronic medical history exposes us to a recording bias, in particular taking into account that it is a primary prevention study, and, therefore, we worked with healthy individuals from a cardiovascular point of view during 2011 and 2012, a period of time in which some of the variables analysed must have been recorded. Furthermore, we must not forget that some of the patients included were treated pharmacologically before suffering the cardiovascular event. Therefore, it is foreseeable that their lipid values are lower than those which would correspond if they had not undergone lipid-lowering therapy. This is something to bear in mind, not only due to the analytical value itself, but also due to the potential anti-inflammatory and antioxidant effects inherent to the functioning of these drugs.
In PHC consultations, general practitioners are required to take complex therapeutic decisions every day, and, sometimes, the scientific evidence, often voluminous and not very enlightening, becomes a factor that generates confusion. The approach to DLP is, in our opinion, one of the clearest examples. Every so often, new consensus documents formulated by different scientific societies from all over the world appear. These are renowned societies which invite physicians to implement changes in their actions in pursuit of greater care quality that translates finally into an improvement in the health of our patients and a lower mortality rate. We have drugs of proven quality available, drugs that can reduce the cholesterol and triglyceride figures to bring them closer to targets marked as optimal by the strictest CPGs, or, according to other guidelines, drugs that act on the lipid profile, help to reduce the overall CVR of our patients, and with that promise more disease-free years of life.
We know that lipid control is necessary and, without a doubt, we will have to overcome the inertia that can probably influence the fact that the control results of hypercholesterolaemia in Spain are not those expected, taking into account that very effective drug therapies are available.18 However, there is surely something else. The approach to lifestyle changes is, undoubtedly, a relevant subject; giving up smoking, healthy food advice, regular physical exercise and the obtainment and maintenance of an appropriate weight are the recommendations which provide the highest-quality evidence in the documents and CPGs published in recent years.10 In one way or another, specialists in family medicine, endocrinologists and paediatrics have to find the time and the way to introduce this objective into their minds and consultations, because it seems clear that cardiovascular disease prevention has to start there. A multidisciplinary intervention in the early stages of life, with the participation of educators, healthcare professionals and parents, could be established as a reasonable and realistic strategy in pursuit of the obtainment of improvements in lifestyles and, consequently, on the future cardiovascular health of the population.
ConclusionsMost patients present, before the event, HDL-C and TG values that are relatively adapted to the control targets recommended by the CPGs, while the LDL-C and REGICOR values are classified in a moderate degree of control. The room for improvement is evident, in particular in groups of patients at a high-risk level. Obesity is established, without a doubt, as the worst controlled risk factor, and multidisciplinary measures which are implemented in the early stages of life to address it are urgent.
Ethical considerationsThe authors declare that no experiments on humans or animals were carried out in this research. Before starting the study, the relevant authorisation was requested from the directors of the primary care teams that make up the Primary Care Service Baix Llobregat Nord. In order to comply with the regulation of the Personal Data Protection Law, the identity of the patients included in this study has been processed in a strictly confidential manner. The data were collected anonymously from the electronic medical history, and the base obtained was processed in a way that meant it was not possible to relate the information collected to the patient.
Authors/contributorsPilar Oriol Torón and Teresa Badía Farré contributed to the conception and design of the study, interpretation of the data, writing of the draft of the article and the final approval of the version presented. Amparo Romaguera Lliso contributed to the conception and design of the study, analysis and interpretation of the data and the final approval of the version presented.
FundingNone.
Conflicts of interestThe authors declare that they have no conflicts of interest.
We would like to thank Mariella Cama, María Roselló, Elisabeth Moreira and Aurelio Aznar for the collaboration provided in some phases of this study. Thanks to everyone.
Please cite this article as: Oriol Torón PÁ, Badía Farré T, Romaguera Lliso A. Control lipídico y factores de riesgo asociados, antes del padecimiento del primer evento cardiovascular. Clín Investig Arterioscler. 2019;31:141–151.