


The objective of this paper has focused on assessing the level of health-related lifestyle acquired in Spanish adults in the Spanish cities of Albacete and Murcia, and analyzing the existing differences according to sex and age.
Material and methodsOn a sample of 788 subjects aged between 22 and 72, the Health-related Lifestyle Assessment Scale was applied, consisting of 52 items and structured in 7 dimensions that explained a total variance of 66.87% and a Cronbach’s alpha of 0.894.
ResultsA percentage of 12 of the adults surveyed have a healthy lifestyle, 53% show a trend to health and 35% poor or unhealthy. Pearson’s χ2 tests show a positive and significant association of women with health and a trend of significant improvement in lifestyle with age. The inferential data (t-Student tests and one-factor ANOVA) confirm these differences according to gender and age.
ConclusionsIt is necessary to promote preventive programs to improve health in the habits of the population, especially in the 35% that show a poor or unhealthy level of lifestyle.
El objetivo de la presente investigación se ha centrado en evaluar el nivel del estilo de vida saludable adquirido en adultos españoles de las ciudades españolas de Albacete y Murcia, y analizar las diferencias existentes en función del sexo y la edad.
Material y métodosSobre una muestra de 788 sujetos de edades comprendidas entre los 22 y 72 años de edad se aplicó la Escala de Valoración del Estilo de Vida Saludable Adquirido, formada por 52 ítems y estructurada en 7 dimensiones que explicaron una varianza total de 66,87% y un alfa de Cronbach de 0,894.
ResultadosEl 12% de los adultos encuestados tenía un estilo de vida saludable, el 53% tendente hacia la salud y el 35% nada o poco saludable. Las pruebas de χ2 de Pearson y análisis de residuos muestran una asociación positiva y significativa de las mujeres a la salud y una tendencia a la mejora significativa del estilo de vida con el transcurso de la edad. Los datos inferenciales (pruebas t de Student y ANOVA de un factor) confirman estas diferencias en función del sexo y la edad.
ConclusionesEs necesario promover programas preventivos para la mejora de la salud en los hábitos de la población, sobre todo en el 35% que posee un nivel poco o nada saludable en su estilo de vida.
A person’s state of health is one of the defining aspects of their functionality within a given social context.1–5 In this sense, the level of health that an individual has achieved is largely defined by their lifestyle habits, which are based on the regular behavior they have engaged in over the years.6–9 The overall set of habits regarded as the main factors that determine a person’s health status defines what we call «lifestyle».10–15
People gradually develop stable habits and lifestyles that can yield great health benefits or, on the contrary, represent threats to their future life; they constitute what we have come to call the «acquired healthy lifestyle». Depending on the orientation, lifestyle will become a major predictor of a positive or negative health trend.16–20
From this perspective, it will be essential to be able to evaluate and determine the lifestyle that a subject has at a given time in their life, given that this will enable us to reaffirm certain positive habits and/or redirect others towards healthier models. Knowledge of lifestyle can guide us in introducing modifications in people’s behavior that are aimed at improving their health of lifestyle.21,22 Likewise, it is similarly important to promote knowledge and training in lifestyle habits, inasmuch as there is a direct relationship between the degree of training and the level of healthy lifestyle acquired.23 Depending on the characteristics of the population studied, lifestyle can vary considerably.24–27
Most national and international research probes the habits and lifestyles that have a determining influence on the different aspects that define the holistic concept of health, such as physical (sleep and rest habits; eating habits; physical exercise habits; use of tobacco, alcohol, and other drugs; individual responsibility for care), psychological, and affective-social health. Most research highlights healthier lifestyles among women than among men28–32 and, in turn, improvements with age.33,34
Thus, the aim of the present study was to focus on assessing the healthy lifestyle acquired by Spanish adults with ages of between 22 and 72 years using a rating scale entitled, the Estilo de Vida Saludable Adquirido (Acquired Healthy Lifestyle Assessment Scale or E-VEVSA, its acronym in Spanish), consisting of 52 items and 7 dimensions that include the main lifestyle habits that are predictive of a healthy acquired lifestyle.25
We believe that, by ascertaining the lifestyle, we can contemplate reinforcing those habits that achieve adequate levels of health and/ or reorienting those that score low or are unhealthy, both individually and collectively.
Material and methodsParticipantsThe E-VEVSA was administered by family doctors in primary care centres in the Spanish cities of Albacete and Murcia to a random, incidental sample of 788 adult subjects (49.5% male and 5.5% female) aged between 22 and 77 years. In Albacete, healthcare catchment areas II, III, V, VI, and VII were selected, which meant that five of the nine existing centres took part. In Murcia, six of the 14 existing centres participated, in healthcare catchment areas I (Murcia Oeste), II (Cartagena), V (Altiplano), and VI (Vega Media del Segura). A total of 47.8% of all the existing centres in the cities of Albacete and Murcia were contacted. Participants were selected by non-probabilistic, randomised, intentional sampling.35 Data were collected during the months of January and February 2022.
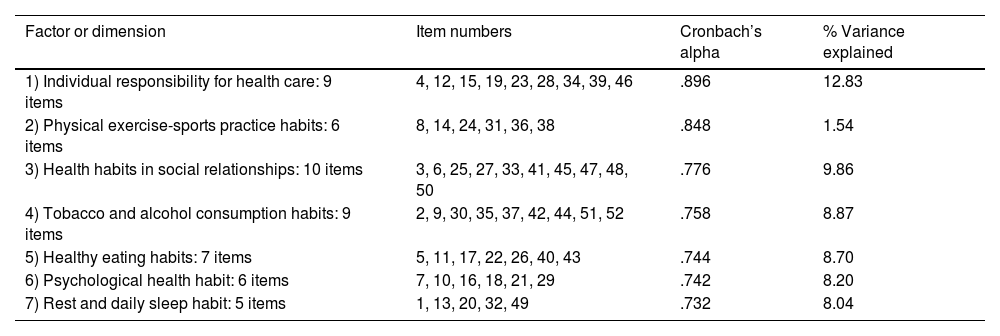
InstrumentThe E-VEVSA (Appendix B Anexo 1), comprising 52 items structured into 7 dimensions25 was used. The exploratory and confirmatory psychometric tests performed yielded an overall reliability of the scale with a Cronbach’s alpha of .894 and explained a total variance of 67.846%. The reliability and the partial explained variance of the various dimensions are displayed in Table 1.
Distribution of the 52 final items, partial Cronbach’s alpha value, and explained variance for each dimension of the E-VEVSA scale.
| Factor or dimension | Item numbers | Cronbach’s alpha | % Variance explained |
|---|---|---|---|
| 1) Individual responsibility for health care: 9 items | 4, 12, 15, 19, 23, 28, 34, 39, 46 | .896 | 12.83 |
| 2) Physical exercise-sports practice habits: 6 items | 8, 14, 24, 31, 36, 38 | .848 | 1.54 |
| 3) Health habits in social relationships: 10 items | 3, 6, 25, 27, 33, 41, 45, 47, 48, 50 | .776 | 9.86 |
| 4) Tobacco and alcohol consumption habits: 9 items | 2, 9, 30, 35, 37, 42, 44, 51, 52 | .758 | 8.87 |
| 5) Healthy eating habits: 7 items | 5, 11, 17, 22, 26, 40, 43 | .744 | 8.70 |
| 6) Psychological health habit: 6 items | 7, 10, 16, 18, 21, 29 | .742 | 8.20 |
| 7) Rest and daily sleep habit: 5 items | 1, 13, 20, 32, 49 | .732 | 8.04 |
Overall Cronbach’s alpha of the scale=.894. Total explained variance of 67.846%.
All research was conducted in accordance with the ethical standards as recognised by the Declaration of Helsinki (2008 revision) and in line with the recommendations of Good Clinical Practice of the EEC (document 111/3976/88 dated July 1990) and the current Spanish legal regulations governing clinical research on humans (Royal Decree 561/1993 regarding clinical trials). All participants completed an informed consent form; the research project and design were approved by the ethics committees of the universities of Murcia and Castilla-La Mancha. Likewise, the following exclusion criteria were established for the selection of participants: age no less than 20 years, given that above this age limit, we could ensure greater stability in the habits acquired by the subjects; having no diagnosis of serious illnesses; subjects with moderate or severe organic ailments, both physical and mental, were therefore not included. Likewise, those individuals who left more than 2 items of the questionnaire unanswered were excluded and, in turn, we determined by consensus that the missing data would be replaced by the mean values of the scores of the items.
ScoresThe highest possible score on the scale was 260 and the lowest possible score was 52. The items were worded with varying positive and negative coding in relation to lifestyle, and although the answer form was always ordered from 1 to 5 (1: never; 2: almost never; 3: sometimes; 4: quite often; 5: very often), some items were scored from 1 to 5 and others from 5 to 1, depending on their positive or negative health orientation. These scores were recoded after data entry for analysis using SPSS® version 28.
The lifestyle classification level (unhealthy: 52–104; unhealthy: 105–156; tending towards health: 157−208; healthy: 209−260) was calculated by dividing the difference between the maximum score (260) and the minimum score (52) into 4 categories. The interpretation of items 69 and 70 should be taken into account when assigning response modalities, bearing in mind the number of cigarettes smoked and the amount of alcohol consumed per week by the participants. Answers were coded a posteriori, once the completed questionnaires had been collected. In relation to the number of cigarettes smoked, we followed the contributions of the Pan American Health Organisation36 and Londoño Pérez et al.37 In the case of alcohol consumption, we followed the contributions of Rodríguez Martos,38 who used the so-called «standard drinking units».
Statistics appliedBasic descriptive statistics (mean, standard deviation, maximum, and minimum) were used for the scores on the different dimensions of the scale. Contingency tables were applied with Pearson’s χ2 tests with corrected standardised residuals analysis (rtc) for the relationship between qualitative variables; similarly, inferential statistics using Student’s t-test for independent samples were used for the differences between the means on the scale according to sex and single-factor ANOVA to contrast the means according to the age groups.
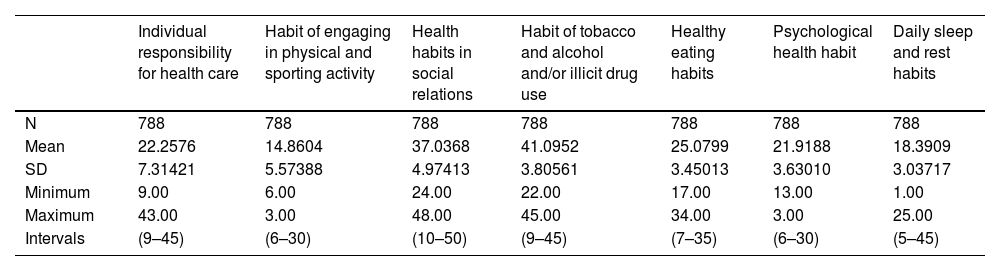
ResultsDescriptive and relational results for lifestyle levelsTable 2 presents the descriptive data corresponding to the scores obtained in each of the dimensions defining the acquired healthy lifestyle.
Mean scores for the different factors of the E-VEVSA scale.
| Individual responsibility for health care | Habit of engaging in physical and sporting activity | Health habits in social relations | Habit of tobacco and alcohol and/or illicit drug use | Healthy eating habits | Psychological health habit | Daily sleep and rest habits | |
|---|---|---|---|---|---|---|---|
| N | 788 | 788 | 788 | 788 | 788 | 788 | 788 |
| Mean | 22.2576 | 14.8604 | 37.0368 | 41.0952 | 25.0799 | 21.9188 | 18.3909 |
| SD | 7.31421 | 5.57388 | 4.97413 | 3.80561 | 3.45013 | 3.63010 | 3.03717 |
| Minimum | 9.00 | 6.00 | 24.00 | 22.00 | 17.00 | 13.00 | 1.00 |
| Maximum | 43.00 | 3.00 | 48.00 | 45.00 | 34.00 | 3.00 | 25.00 |
| Intervals | (9–45) | (6–30) | (10–50) | (9–45) | (7–35) | (6–30) | (5–45) |
The minimum score for the sum of the dimensions could range from 52 to 26.
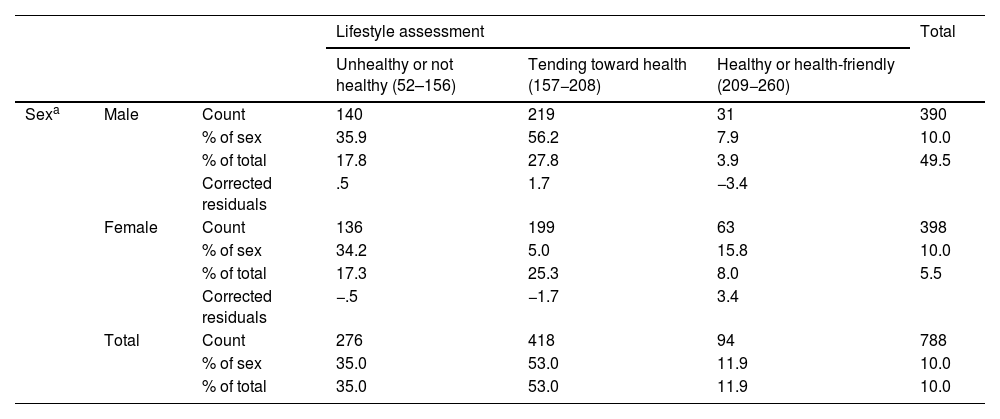
The contingency table with Pearson’s χ2 test and the rtc analysis relating the level of acquired healthy lifestyle and sex (Table 3) indicates a positive and significant association (p<.005) of women with the healthy lifestyle, indicating a rtc=3.4, while men exhibit a negative association with this condition (rtc=3.4).
Contingency tables linking the level of acquired healthy lifestyle to the sex and age of the participants.
| Lifestyle assessment | Total | |||||
|---|---|---|---|---|---|---|
| Unhealthy or not healthy (52–156) | Tending toward health (157−208) | Healthy or health-friendly (209−260) | ||||
| Sexa | Male | Count | 140 | 219 | 31 | 390 |
| % of sex | 35.9 | 56.2 | 7.9 | 10.0 | ||
| % of total | 17.8 | 27.8 | 3.9 | 49.5 | ||
| Corrected residuals | .5 | 1.7 | −3.4 | |||
| Female | Count | 136 | 199 | 63 | 398 | |
| % of sex | 34.2 | 5.0 | 15.8 | 10.0 | ||
| % of total | 17.3 | 25.3 | 8.0 | 5.5 | ||
| Corrected residuals | −.5 | −1.7 | 3.4 | |||
| Total | Count | 276 | 418 | 94 | 788 | |
| % of sex | 35.0 | 53.0 | 11.9 | 10.0 | ||
| % of total | 35.0 | 53.0 | 11.9 | 10.0 | ||
| Lifestyle assessment | Total | |||||
|---|---|---|---|---|---|---|
| Unhealthy or not healthy (52−156) | Tending toward health (105−208) | Healthy or health-friendly (209−260) | ||||
| Age groups (years)b | From 22 to 44 | Count | 139 | 108 | 34 | 281 |
| % of age groups | 49.5% | 38.4% | 12.1% | 10.0% | ||
| % of total | 17.6 | 13.7 | 4.3 | 35.7 | ||
| Corrected residuals | 6.3 | −6.1 | .1 | |||
| From 45 to 52 | Count | 66 | 160 | 37 | 263 | |
| % of age groups | 25.1 | 6.8 | 14.1 | 10.0 | ||
| % of total | 8.4 | 2.3 | 4.7 | 33.4 | ||
| Corrected residuals | −4.1 | 3.1 | 1.3 | |||
| From 53 to 72 | Count | 71 | 150 | 23 | 244 | |
| % of age groups | 29.1 | 61.5 | 9.4 | 10.0 | ||
| % of total | 9.0 | 19.0 | 2.9 | 31.0 | ||
| Corrected residuals | −2.3 | 3.2 | −1.5 | |||
| Total | Count | 276 | 418 | 94 | 788 | |
| % of age groups | 35.0 | 53.0 | 11.9 | 10.0 | ||
| % of total | 35.0 | 53.0 | 11.9 | 10.0 | ||
No cells (0%) with expected frequencies of less than 5.
In the lower part of Table 3, we can observe a tendency toward an improvement in the level of healthy lifestyle acquired with age. Thus, while young people aged 22–44 years have a positive and significant association (p<.005) with a poor or unhealthy condition in their acquired lifestyle (rtc=6.3), in the age groups from 45–52 to 53–72 years there is a positive and significant correlation with the acquired lifestyle, tending toward health (rtc of 3.1 and 3.2, respectively).
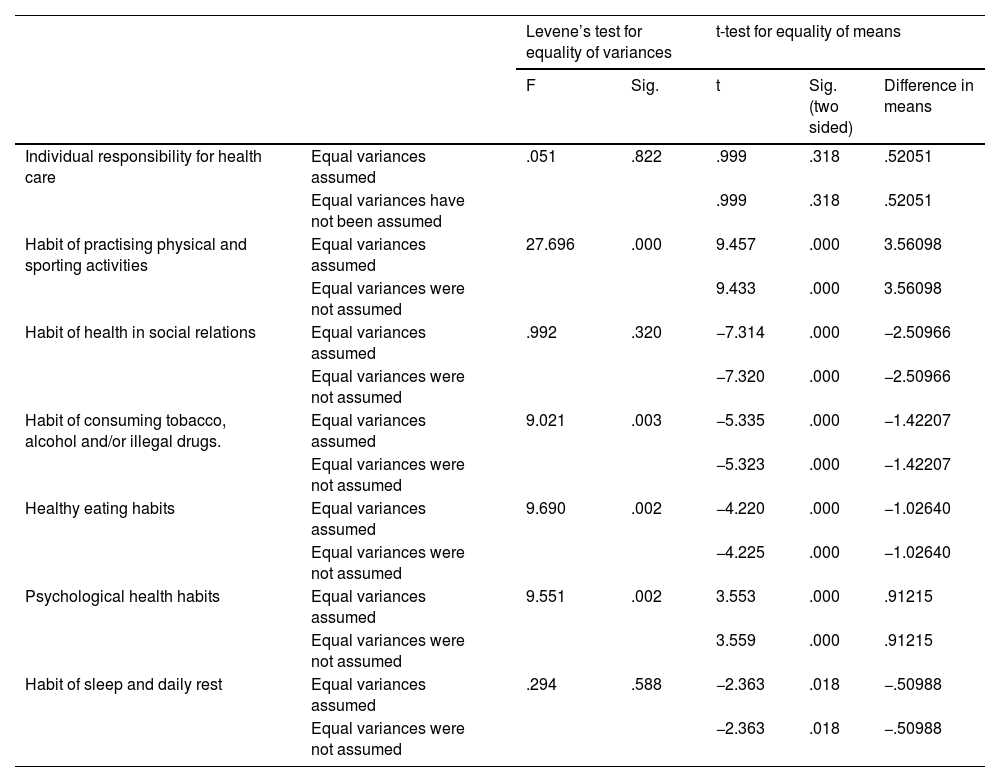
Inferential resultsStudent’s t-test for independent samples (Table 4) reveals significant differences between males and females in five of the dimensions of the E-VEVSA scale, with the exception of the factors «Habit of individual responsibility in health care» and «Health habits in social relations.» Men have a significantly higher mean score (p<.0005) in the habit of physical-sports practice and psychological health habits, while women have higher scores in the habit of smoking, alcohol and other drug use, healthy eating habits, and daily rest and sleep habits.
Differences in mean scores on the E-VEVSA scale factors as a function of sex.
| Levene’s test for equality of variances | t-test for equality of means | |||||
|---|---|---|---|---|---|---|
| F | Sig. | t | Sig. (two sided) | Difference in means | ||
| Individual responsibility for health care | Equal variances assumed | .051 | .822 | .999 | .318 | .52051 |
| Equal variances have not been assumed | .999 | .318 | .52051 | |||
| Habit of practising physical and sporting activities | Equal variances assumed | 27.696 | .000 | 9.457 | .000 | 3.56098 |
| Equal variances were not assumed | 9.433 | .000 | 3.56098 | |||
| Habit of health in social relations | Equal variances assumed | .992 | .320 | −7.314 | .000 | −2.50966 |
| Equal variances were not assumed | −7.320 | .000 | −2.50966 | |||
| Habit of consuming tobacco, alcohol and/or illegal drugs. | Equal variances assumed | 9.021 | .003 | −5.335 | .000 | −1.42207 |
| Equal variances were not assumed | −5.323 | .000 | −1.42207 | |||
| Healthy eating habits | Equal variances assumed | 9.690 | .002 | −4.220 | .000 | −1.02640 |
| Equal variances were not assumed | −4.225 | .000 | −1.02640 | |||
| Psychological health habits | Equal variances assumed | 9.551 | .002 | 3.553 | .000 | .91215 |
| Equal variances were not assumed | 3.559 | .000 | .91215 | |||
| Habit of sleep and daily rest | Equal variances assumed | .294 | .588 | −2.363 | .018 | −.50988 |
| Equal variances were not assumed | −2.363 | .018 | −.50988 | |||
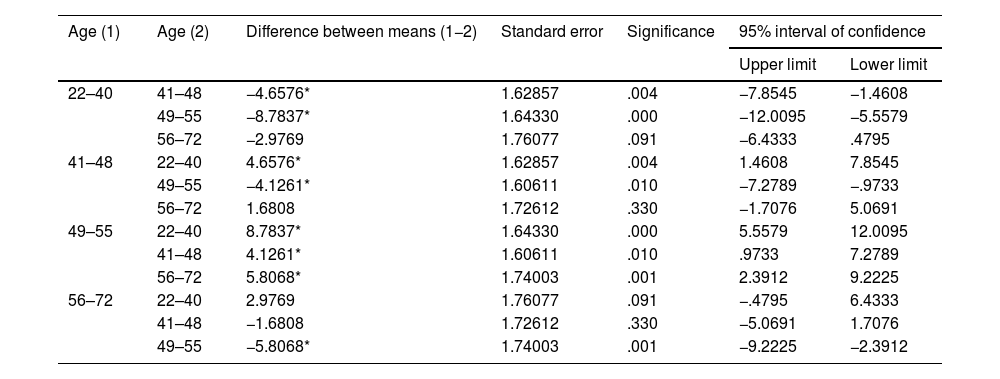
In the general linear model (ANOVA) relating the scores obtained on the E-VEVSA scale to the different age groups (Table 5), we can see that with increasing age, there is a significant increase in the level of healthy lifestyle acquired (p<.0005), with the highest mean score being attained in the 49–55 years age group (185.18).
Analysis of variance of E-VEVSA scale scores by age.
| Age (1) | Age (2) | Difference between means (1−2) | Standard error | Significance | 95% interval of confidence | |
|---|---|---|---|---|---|---|
| Upper limit | Lower limit | |||||
| 22–40 | 41–48 | −4.6576* | 1.62857 | .004 | −7.8545 | −1.4608 |
| 49–55 | −8.7837* | 1.64330 | .000 | −12.0095 | −5.5579 | |
| 56–72 | −2.9769 | 1.76077 | .091 | −6.4333 | .4795 | |
| 41–48 | 22–40 | 4.6576* | 1.62857 | .004 | 1.4608 | 7.8545 |
| 49–55 | −4.1261* | 1.60611 | .010 | −7.2789 | −.9733 | |
| 56–72 | 1.6808 | 1.72612 | .330 | −1.7076 | 5.0691 | |
| 49–55 | 22–40 | 8.7837* | 1.64330 | .000 | 5.5579 | 12.0095 |
| 41–48 | 4.1261* | 1.60611 | .010 | .9733 | 7.2789 | |
| 56–72 | 5.8068* | 1.74003 | .001 | 2.3912 | 9.2225 | |
| 56–72 | 22–40 | 2.9769 | 1.76077 | .091 | −.4795 | 6.4333 |
| 41–48 | −1.6808 | 1.72612 | .330 | −5.0691 | 1.7076 | |
| 49–55 | −5.8068* | 1.74003 | .001 | −9.2225 | −2.3912 | |
Dependent variable: total DMS score.
22–40: 176.40±16.29; 41–48: 181.05±18.17; 49–55: 185.18±14.83; 56−72: 179.37±16.97.
Observed power: .998.
F=9.91; p<.0005.
Calculated using alpha=.05.
R2=.037 (R2 corrected=.033).
Based on observed means.
The results of our research indicate that 53% of the population have an acquired lifestyle that tends towards health; 35% have an unhealthy or poor lifestyle, and only slightly less than 12% have a healthy lifestyle. Likewise, we found a tendency toward a significant improvement in lifestyle with age (χ2=46.67; p<.0005). Similarly, of the 35% of the respondents who rated their lifestyle as unhealthy or poor, half were in the 22–44 age group. On the other hand, we found a positive and significant association between the level of healthy lifestyle in women and men (χ2=12.296; p<.0005).
Espinoza Lara and Vanegas López,33 using the so-called Health-Promoting Lifestyle Profile (HPLP-II) by Walker and Hill-Polerecky,39 confirm the trend toward unhealthy lifestyles among young people, inasmuch as in a sample of Nicaraguan university students, 53.3% of those surveyed had an inadequate or unhealthy lifestyle. They found no significant differences in relation to sex at these young ages.
As in our study, Ventura Sucuple and Zevallos Cotrina34 reported an improvement in lifestyle with increasing age. In a descriptive, cross-sectional study of a sample of 100 older adults, they analysed lifestyle using the Lifestyles questionnaire: diet, physical activity, rest and sleep, and found that 82% had healthy lifestyles, while the remaining 18% had unhealthy or poor lifestyles.
Improving lifestyle over the course of age is important, a circumstance confirmed by Li et al.21 who analysed the 2014 China Longitudinal Healthy Longevity Longitudinal Survey to identify the predominant health lifestyles among Chinese elderly aged 85–105 years. The findings demonstrated that healthy lifestyle behaviours stimulated the positive feelings of Chinese elders and led to a more positive assessment of subjective well-being. In contrast, less healthy lifestyle behaviours may be a predictor for negative feelings. It is important to integrate healthy lifestyle choices to promote psychological well-being among the elderly.
Knowledge about lifestyle is important for the establishment of improvement programmes that generate healthy changes in lifestyle habits. In this regard, Proenza Fernández et al.22 conducted a quasi-experimental study in Cuba of a one-year educational intervention in patients over 60 years of age to modify their knowledge and lifestyles with respect to risk factors for cerebrovascular disease. Before the educational intervention, the level of knowledge concerning modifiable risk factors for cerebrovascular disease was found to be inadequate in 65.4% of the older adults and adequate in 88.5% after the programme was implemented. As for lifestyle modification in older adults with some disease, at the start of the intervention, decompensated HTN predominated (76.9%), followed by no physical exercise (57.6%) and decompensated ischaemic heart disease (11.5%). Once the programme was implemented, 57.6% of the patients normalised their blood pressure; 34.6% took up physical exercise, and 26.9% modified their behaviour in terms of alcohol intake and diet.
Knowledge and education in health is another important element in the acquisition of healthy habits and lifestyles; proof of this are the results obtained by health professionals. Thus, Sanabria-Ferrand et al.23 administered a 57-question questionnaire to a sample of 606 health professionals. The sample consisted of 46.2% (280) men and 53.8% (326) women. They evaluated physical activity, leisure time, self-care, biosafety measures, eating habits, psychoactive substance use, and amount of sleep. The results reveal higher lifestyle levels than those recorded in our research, with 57.5% of the nurses and 77% of the physicians being classified as good, very good, and excellent.
Using the HPLP-II in a sample of 250 Syrian refugees, Alzoubi et al.28 obtained scores for the various dimensions that were similar to the averages obtained with our scale. If we consider the means of the direct scores obtained in the E-VEVSA of between 1 and 5, we find values that can be compared with the subjects in this study. The highest score was found for the domain of interpersonal relationships (2.89, SD .52 vs. E-VEVSA 3.7, SD .49), the domain of stress management (2.48, SD .43 vs. E-VEVSA 3.65, SD .60), the domain of nutrition (2.34, SD .37 vs. E-VEVSA 3.58; SD .49), the health responsibility domain (2.20; SD .62 vs. E-VEVSA 2.47; SD .81), and finally, physical activity (1.35; SD .18 vs. E-VEVSA 2.47; SD .81). Consistent with our results, these researchers find significantly higher mean lifestyle scores among females than among males.
Vidal Gutiérrez et al.29 used the HPLP-II in a sample of 441, Chilean adults, of both sexes, with ages of between and 20| 65, years. The authors found significant differences between men, women on the dimensions of physical activity, stress management, spiritual growth. The mean scores for the various factors are in line with those obtained using the E-VEVSA scale.
Insfrán Falcón et al.24 assessed lifestyle related to overweight and obesity in a sample of 75 individuals aged between 18 and 60 years using a scale created by Pardo et al.,40 which consists of 5 domains that coincide with most of those included in E-VEVSA. The authors obtained results in terms of lifestyle health that were comparable to those recorded using our scale, with 68% of respondents reporting that they needed to make changes in order to improve, while only 32% had a healthy lifestyle. The mean for each of the subscales is also analogous to that obtained with our instrument.
Better results are reported by Triviño et al.26 when analysing lifestyle using the instrument called, “Fantástico” in a sample of 147 Colombian adults. The authors observed an excellent level of lifestyle in 35.5% of the women and 23.9% of the men, as well as a greater proportion of adults with a good lifestyle (56.5% among females and 54.9% among males). The lowest proportion was found among women and men with fair lifestyle ratings, with 7.8% and 21.1%, respectively. They found no subjects with a poor lifestyle.
On the other hand, Tol et al.,30 using the HPLP-II scale in undergraduate students with a mean age of 21.01 years, found that 4.7% of the students had a good lifestyle and 19.8% of them had moderate or average health. The highest and lowest frequencies of health-related quality of life corresponded to very good (58.6%) and excellent (9%) health, respectively. Except for stress management (p<.05) and gender, there were no significant correlations between other aspects of HPLP-II and gender. There was no statistically significant association between students’ overall quality of life and nutrition, physical activity, responsibility for one’s own health, or stress management, while there was a significant association between overall quality of life and students’ spiritual growth.
Grimaldo31 administered a lifestyle assessment questionnaire to a sample of 409s cycle students at a graduate school in the city of Lima. His results demonstrate that the dimension of engaging in sport, in both males and females, was unhealthy, with significantly lower scores among females, as we found in E-VEVSA. The rest of the habits – nutrition and sleep and rest – were within the healthy classification, with women scoring significantly higher.
Monje Mahecha and Figueroa Calderón,32 summing up all the scores of the dimensions of a survey consisting of 27 items given to a sample of 916 secondary school students, refer to 6 domains of healthy lifestyle: physical activity and sport, management of free time and recreation, self-care and medical care, eating habits, use of tobacco, alcohol and other drugs, and sleep. The assessment of lifestyle contrasts with our results, in that only 3.9% of the men had unhealthy, 88% healthy, and 7.8% very healthy habits, compared to women with 4.5% unhealthy, 90% healthy, and 5.2% very healthy. Similarity can be observed in the evaluation in terms of sex, with a slight significant difference in favour of men in the unhealthy and very healthy sections, a result that can probably be attributed to the practice of physical activity.
Rosales Rodríguez et al.27 conducted a descriptive, cross-sectional study in Cuba with 165 older adults (102 women and 63 men) using a structured interview guide that took into account habits, customs and lifestyles, age, sex, smoking habits, alcohol intake, physical exercise practices, participation in games, visits to relatives, cultural activities, participation in clubs or societies, participation in occupations, family activities, and sexuality. They found that only 33.3% of the older adults had a healthy lifestyle. One of the most influential factors for the rest of the seniors was engaging in toxic habits, such as: coffee, smoking, drinking alcoholic beverages, and sedentary lifestyle.
ConclusionsIt is important to assess lifestyle as a predictor of health for a given person or population. The results of our research enable us to plan preventive health programmes to redirect the lifestyle habits of those individuals who score low on health in their lifestyle scores and to reinforce the behaviours and habits of those with healthy lifestyle scores. The strong points of our research are the development of a lifestyle evaluation instrument with very good reliability and validity indices, as there are very few scales in Spain to evaluate lifestyle. Furthermore, it provides us with a tool to detect behaviours or habits that may affect the person’s overall health, both individually and globally. Nevertheless, as a limitation, it does not inform us of the subject’s objective clinical and health status at any given moment, a circumstance that requires the corresponding regular medical check-ups.
Conflict of interestsThe authors have no conflict of interests to declare.
Our appreciation to all the family physicians at the primary care centers of the Autonomous Communities of Murcia (Spain) and Castilla-La Mancha (Spain) who have collaborated on adinistering the questionnaires to the sample of patients who participated in the research.
The following is Supplementary data to this article: