

Physical-sports habits in adulthood constitute one of the predictors of physical, psychological and social health within healthy lifestyles.
MethodsThe Acquired Healthy Lifestyle Assessment Scale was applied to a sample of 788 subjects between the ages of 22 and 72 and the dimension that makes up physical-sports practice habits was analyzed.
Results74.4% of adults have habits of physical-sports practice that are not healthy or unhealthy, 18.8% tend towards health and only 6.9% are healthy. Pearson's 2 tests show a significant association between men and healthy habits, without observing changes associated with the age variable. The t-Student and one-factor ANOVA tests confirm the relationship between the level of health and physical-sports practice habits depending on sex and age.
ConclusionsIt is necessary to promote preventive programs to increase participation in the practice of physical and sports exercise in the adult population that has unhealthy or unhealthy levels of lifestyle.
Los hábitos fisicodeportivos en la edad adulta constituyen uno de los predictores de salud física, psicológica y social dentro de los estilos de vida saludables.
MétodosSe aplicó la escala de evaluación de estilos de vida saludable adquiridos a una muestra de 788 sujetos entre 22 y 72 años y se analizó la dimensión que conforman los hábitos de práctica fisicodeportiva.
ResultadosEl 74,4% de los adultos tiene hábitos de práctica fisicodeportiva que no son saludables, el 18,8% tienden a la salud y solo el 6,9% son saludables. Las 2 pruebas de Pearson muestran una asociación significativa entre hombres y hábitos saludables, sin observarse cambios asociados a la variable edad. Las pruebas t de Student y ANOVA de un factor confirman la relación entre el nivel de salud y los hábitos de práctica fisicodeportiva en función del sexo y la edad.
ConclusionesEs necesario promover programas preventivos para incrementar la participación en la práctica de ejercicio físico y deportivo en la población adulta que tiene estilos de vida poco saludables.
The beneficial effects that physical activity and the regular and systematic practice of physical exercise generate in the body have been widely studied since long time ago.1,2 It is proven scientific evidence that a practice of physical exercise performed continuously at a light to moderate intensity produces significant improvements in general health.3–5 In this sense, physical-sports habits are considered one of the main predictive factors that make up the so-called healthy lifestyles.6 When the habit of exercising is consolidated in the habitual behavior of a subject we say that it is part of their acquired healthy lifestyle.
Among the positive effects of exercise, its influence on the cardiovascular and respiratory system stands out, to the point that it is considered a preventive factor for cardiovascular accidents and morbidity and mortality per number of inhabitants in the most developed countries.7,8
Another direct effect of exercise on health is its impact on the prevention of overweight and obesity,9–11 which is considered one of the chronic diseases or epidemics of the 21st century by the WHO.12
In recent years, the effects on mental and social health have been highlighted, being one of the preventive and treatment factors for anxiety and the initial phases of depression.13,14 Studies have shown a positive effect of exercise on inflammatory markers in older people, interleukin-6 (IL-6), tumor necrosis factor-α (TNF-α), and C-reactive protein.15 Physical activity is also a modifiable lifestyle factor that has been identified as having a positive impact on the cognitive health of older adults.16
The habit of physical-sports practice that is incorporated into the lifestyle can generate health benefits or, on the contrary, threats to the future life of a subject.17–19 In adult subjects from 18 to 64 years old, it is recommended to perform at least 150min of moderate-intensity aerobic physical activity per week, or 75min of vigorous physical activity each week. Each session of aerobic exercise should last a minimum of 10 continuous minutes. In the case of people over 65 years of age, the recommendations are similar, in addition to including activities that improve their balance to avoid falls.20
Knowing the lifestyle can guide us when establishing changes in the subjects’ behaviors that are aimed at improving health.21,22 From this perspective, it will be essential to be able to evaluate and determine the level of health of the habits of practicing physical-sports activity within the lifestyle, since in this way, we will be able to reaffirm certain positive habits and/or redirect others towards models aimed at health.
The majority of national and international research that analyzes lifestyles incorporates the study of physical-sports practice habits, the level of physical condition, physical self-concept and self-perception of motor competence, are factors that have an influence determinant on the various aspects that define the holistic concept of health (physical, psychological and emotional-social health).21–24 Most works that quantify the degree of physical-sports practice in the adult population highlight a high percentage of sedentary lifestyle or low levels of activity that require the incorporation of programs aimed at modifying behaviors towards the search for a more active life linked to regular exercise.25–43 Despite the many known benefits of exercise, 31.1% of adults in the world population are physically inactive.39
For this reason, the objective of this research has focused on evaluating the physical-sports practice habits within the healthy lifestyle acquired by Spanish adults between the ages of 22 and 72, using an evaluation questionnaire called “Scale Evaluation of the Acquired Healthy Lifestyle (E-VEVSA)”, made up of 52 items and 7 dimensions, among which are factor 2, called “Physical-sports practice habits”.
MethodParticipantsAn incidental and random sample of 788 adult subjects (49.5% men and 50.5% women) aged between 22 and 77 years was selected. The selection of participants was carried out through non-probabilistic, random and intentional sampling.
InstrumentThe “Acquired Healthy Lifestyle Assessment Scale” (E-VEVSA) was used (Table 1), which was administered by family doctors in primary care centers in the community of Castilla-La Mancha (Spain) and the community of Murcia (Spain).44,45 This scale is made up of 52 items structured in 7 dimensions: 1. Individual responsibility in health care, 2. Habit of physical-sports practice, 3. Health habits in social relationships, 4. Habit of tobacco consumption, alcohol and other drugs, 5. Healthy eating habits, 6. Psychological health habits and 7. Sleep and daily rest habits. The exploratory and confirmatory psychometric tests carried out yield an overall reliability of the scale in Crombach's alpha (α) test of .848 and explain a total variance of 67.84%. Seven of the items of the global scale were grouped together forming dimension or subconstruct 2 (physical-sports practice habits), which explained a partial variance of 10.54% and a Crombach's α of .848.
All research was carried out following the deontological standards recognized by the Declaration of Helsinki (2008 revision) and following the recommendations of good clinical practice of the EEC document (111/3976/88 of July 1990) and the current Spanish legal regulations that regulates clinical research in humans (Royal Decree 561/1993 on clinical trials). The study was submitted to the Ethics Committee of the University of Murcia. All subjects signed an informed consent where they were guaranteed complete anonymity when processing the data. Likewise, for the selection of the participants were determined as exclusion criteria: not having an age of less than 20 years, since above this limit, we ensure greater stability of the habits acquired by the subjects, not suffering from serious diagnosed pathologies, so they were not included subjects with organic pathologies of medium or severe severity, both physical and mental. Likewise, those subjects who left more than two items of the questionnaire unanswered were discarded and, in turn, we determined by consensus that the lost data would be replaced by the mean values of the item scores.
The maximum possible score on the scale was 260 and the minimum was 52. Likewise, the minimum score for factor No. 2 “Physical-sports practice habits” was 6 and the maximum was 30. The items were written varying the codings positive and negative in relation to the lifestyle and, although the form of response was always ordered with the modalities from 1 to 5 (1: never; 2: almost never; 3: sometimes; 4: quite frequently; 5: with very frequently), some items were scored from 1 to 5 and others from 5 to 1 depending on their positive or negative health orientation. These scores would be recoded after entering the data for analysis using the SPSS version 28 software.
The classification level of physical-sports practice habits (not healthy: 6–12; unhealthy: 12–18; tending towards health: 18–24; healthy: 24–30) was calculated dividing the difference between the maximum score (30) and the minimum (6) into 4 intervals.
ResultsDescriptive and relational resultsIn Table 2, we observe the reliability data (Crombach's α) of the items, the overall reliability and partial variance explained by the factor and the descriptive data corresponding to the scores obtained in each of the items that define the practice habits factor physical-sports performance on the E-VEVSA scale. The mean of all items of the factor (minimum=1; maximum=5) was 2.47±0.92 (2.66±0.98 in men and 2.18±0.76 in women). In the global sum of the factor we find an average of 14.86±5.57 (16.65±5.91 in men and 13.09±4.58 in women).
Descriptive results corresponding to the items of the physical-sports practice habits factor.
| N | α Crombach if item is deleteda | Minimum | Maximum | Mean | Standard deviation | |
|---|---|---|---|---|---|---|
| (8) Engage in physical exercise or sports at least 3–4 days a week. | 788 | 0.79 | 1 | 5 | 3.19 | 1.337 |
| (14) Perform light or moderate exercise for 30–60min per session. | 788 | 0.8 | 1 | 5 | 3.22 | 1.323 |
| (24) Stand out or have stood out in physical education or school sports. | 788 | 0.81 | 1 | 5 | 2.25 | 1.326 |
| (31) Be recognized by others for my physical or sports qualities. | 788 | 0.8 | 1 | 5 | 2.33 | 1.107 |
| (36) Be very good in the practice of exercise or in most sports. | 788 | 0.82 | 1 | 5 | 2.24 | 1.140 |
| (38) Practice or have practiced sports in federated competitions | 788 | 0.82 | 1 | 5 | 1.63 | 1.184 |
| Total factorc: physical exercise habits | 788 | 0.85 | 6 | 30 | 14.86 | 5.57 |
aThe subscale of healthy eating habits obtained a partial Cronbach's alpha of .848 and a partial explained variance of 10.54%.
bIn the total global factor, we found an average of 14.86±5.57 (16.65±5.91 in males and 13.09±4.58 in females).
cThe sum of the scores on each item determines the total obtained in the dimension. The scoring modality ranges from 1 to 5, so the range of scores is within the interval 6–30.
The descriptive results corresponding to the frequency of physical-sports practice carried out and the recommended volume of it for adults can be seen in Table 3. 56.6% of the adults surveyed do not comply with the recommendations of a physical-sports practice. Healthy, since they perform physical-sports exercise at least 3 or 4 times a week (49.7% of men and 63.3% of women) and do not practice between 30 and 60min per exercise session (52.8%; 48% men and 57.5% women).
Descriptives results based on gender corresponding to the recommendations for healthy daily physical-sports practice (items 8 and 14 of the E-VEVSA scale).
| N | Never | Almost never | Sometimes | Quite often | Very often | |
|---|---|---|---|---|---|---|
| Male | ||||||
| (8) Engage in physical exercise or sports at least 3–4 days a week | 390 | 389.7% | 6717.2% | 8922.8% | 9023.1% | 10627.2 |
| (14) Perform light or moderate exercise for 30–60min per session | 379.5% | 6215.9% | 8822. 6% | 11629.7% | 8722.3% | |
| Female | ||||||
| (8) Engage in physical exercise or sports at least 3–4 days a week | 398 | 7218.1% | 7619.1% | 10426.1% | 8220.6% | 6416.1% |
| (14) Perform light or moderate exercise for 30–60min per session | 7919.8% | 5714.3% | 9323.4% | 10225.6% | 6716.8% | |
| (8) Global: 56.6% (never, almost never, or sometimes) and 43.4% (quite often or very often).Male: 49.7% (never, almost never, or sometimes) and 51. 3% (quite often or very often); female: 63.3% 8 (never, almost never, or sometimes) and 36.7% (quite often or very often).(14) Global: 52.8% (never, almost never, or sometimes) and 47.2% (quite often or very often). Male: 48% (never, almost never, or sometimes) and 52% (quite often or very often); female: 57.5% (never, almost never, or sometimes) and 42.5% (quite often or very often). | ||||||
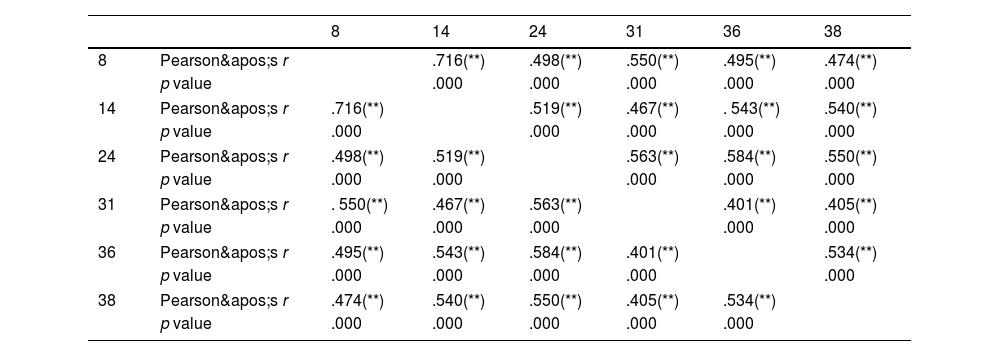
In Table 4 we can see the correlation matrix between the 6 items that we have included within the second factor “Habits of practicing physical-sports activity”. Although all the values are acceptable (greater than 0.3) and significant (p<0.001), we highlight that among the items that refer to the days a week and the time spent practicing physical-sports activity (items 10 and 16) the Pearson r value is the highest (r=0.716; p<0.0001); however, the r correlation indices of these two items decrease when they are related to the rest of the items that refer to qualities and/or abilities of motor competence (47, 40, 66 and 50). All correlations were statistically significant (p<0.05 and p<0.01).
Established correlations between items on physical-sports practice habits.
| 8 | 14 | 24 | 31 | 36 | 38 | ||
|---|---|---|---|---|---|---|---|
| 8 | Pearson's r | .716(**) | .498(**) | .550(**) | .495(**) | .474(**) | |
| p value | .000 | .000 | .000 | .000 | .000 | ||
| 14 | Pearson's r | .716(**) | .519(**) | .467(**) | . 543(**) | .540(**) | |
| p value | .000 | .000 | .000 | .000 | .000 | ||
| 24 | Pearson's r | .498(**) | .519(**) | .563(**) | .584(**) | .550(**) | |
| p value | .000 | .000 | .000 | .000 | .000 | ||
| 31 | Pearson's r | . 550(**) | .467(**) | .563(**) | .401(**) | .405(**) | |
| p value | .000 | .000 | .000 | .000 | .000 | ||
| 36 | Pearson's r | .495(**) | .543(**) | .584(**) | .401(**) | .534(**) | |
| p value | .000 | .000 | .000 | .000 | .000 | ||
| 38 | Pearson's r | .474(**) | .540(**) | .550(**) | .405(**) | .534(**) | |
| p value | .000 | .000 | .000 | .000 | .000 | ||
The contingency table with Pearson's Chi-square test (χ2) and analysis of corrected standardized residuals that relates the level of physical-sports practice habits and sex (Table 5), indicates a positive and significant association (p<0.005) of men with the healthy classification level, indicating a corrected typified residual (rtc)=7.1, while women are positively and significantly associated with the level of the unhealthy habit (rtc=5.6) according to the range of scores assigned to classify the level of health in physical-sports practice habits, we can see that the analyzed sample is distributed as follows: 36.3% have unhealthy habits, 38.1% have unhealthy habits, healthy 18.8% tend towards health and only 6.9% present healthy behavior in physical-sports practice.
Contingency table that relates the level of physical-sport practice habits with sex.
| Levels of physical-sport practice | Total | ||||
|---|---|---|---|---|---|
| Not healthy habit | Little healthy habit | Tending to health habit | Healthy habit | ||
| Sex | |||||
| Male | |||||
| Count | 104 | 140 | 94 | 52 | 390 |
| % of sex | 26.7% | 35.9% | 24.1% | 13.3% | 100.0% |
| % of total | 13.,2% | 17.8% | 11.9% | 6.6% | 49.5% |
| Corrected residues | −5.6 | −1.2 | 3.8 | 7.1 | |
| Female | |||||
| Count | 182 | 160 | 54 | 2 | 398 |
| % of sex | 45.7% | 40.2% | 13.6% | .5% | 100.0% |
| % of total | 23.1% | 20.3% | 6.9% | .3% | 50.5% |
| Corrected residues | 5.6 | 1.2 | −3.8 | −7.1 | |
| Total | |||||
| Count | 286 | 300 | 148 | 54 | 788 |
| % of sex | 36.3% | 38.1% | 18.8% | 6.9% | 100.0% |
| % of total | 36.3% | 38.1% | 18.8% | 6.9% | 100.0% |
Pearson's χ2=79.64; p<0.0005.
Level of classification of the physical-sport practice habit: not healthy (6–12); little healthy (12.01–18); tending to health (18.01–24); healthy (24.01–30).
In Table 6 we observe that in the different age groups there are no significant changes in the levels of physical-sports practice habits, since Pearson's χ2 test with corrected standardized residual analysis is not significant (p>0.05).
Contingency table that relates the level of physical-sport practice habits with age.
| Levels of physical-sport practice | Total | ||||
|---|---|---|---|---|---|
| Not healthy habit | Little healthy habit | Tending to health habit | Healthy habit | ||
| Age | |||||
| 20–40 | |||||
| Count | 74 | 69 | 36 | 20 | 199 |
| % of sex | 37.2% | 34.7% | 18.1% | 10.1% | 100.0% |
| % of total | 9.4% | 8.8% | 4.6% | 2.5% | 25.3% |
| Corrected residues | .3 | −1.1 | −.3 | 2.1 | |
| 41–48 | |||||
| Count | 70 | 97 | 39 | 12 | 218 |
| % of sex | 32.1% | 44.5% | 17.9% | 5.5% | 100.0% |
| % of total | 8.9% | 12.3% | 4.9% | 1.5% | 27.7% |
| Corrected residues | −1.5 | 2.3 | −.4 | −.9 | |
| 49–55 | |||||
| Count | 81 | 79 | 39 | 11 | 210 |
| % of sex | 38.6% | 37.6% | 18.6% | 5.2% | 100.0% |
| % of total | 10.3% | 10.0% | 4.9% | 1.4% | 26.6% |
| Corrected residues | .8 | −.2 | −.1 | −1.1 | |
| 56–72 | |||||
| Count | 61 | 55 | 34 | 11 | 161 |
| % of sex | 37.9% | 34.2% | 21.1% | 6.8% | 100.0% |
| % of total | 7.7% | 7.0% | 4.3% | 1.4% | 20.4% |
| Corrected residues | .5 | −1.1 | .9 | .0 | |
| Total | |||||
| Count | 286 | 300 | 148 | 54 | 788 |
| % of sex | 36.3% | 38.1% | 18.8% | 6.9% | 100.0% |
| % of total | 36.3% | 38.1% | 18.8% | 6.9% | 100.0% |
Pearson's χ2=10.09; p>0.05.
Level of classification of the physical-sport practice habit: not healthy (6–12); little healthy (12.01–18); tending to health (18.01–24); healthy (24.01–30).
The t-Student test for independent samples (Table 7) indicates significant differences favoring men in the means (p<0.0005) of the scores of all the items and in the global mean of the factor in men compared to women.
t-Test for independent samples of the differences in means of item scores for the factor “physical-sporting practice habits” based on sex.
| Levene's test for equality of variances | t-Test for equality of means | |||||
|---|---|---|---|---|---|---|
| F | Sig. | t | Sig. (bilateral) | Mean difference | ||
| (8) Engage in physical exercise or sports at least 3–4 days a week. | Equal variances assumed | 1.067 | .302 | 4.601 | .000 | .433 |
| Equal variances not assumed | 4.602 | .000 | .433 | |||
| (14) Perform light or moderate exercise for 30–60min per session. | Equal variances assumed | 1.699 | .193 | 3.657 | .000 | .342 |
| Equal variances not assumed | 3.660 | .000 | .342 | |||
| (24) Stand out or have stood out in physical education or school sports. | Equal variances assumed | 28.718 | .000 | 8.199 | .000 | .744 |
| Equal variances not assumed | 8.189 | .000 | .744 | |||
| (31) Be recognized by others for my physical or sports qualities. | Equal variances assumed | 12.977 | .000 | 8.123 | .000 | .616 |
| Equal variances not assumed | 8.113 | .000 | .616 | |||
| (36) Be very good in the practice of exercise or in most sports. | Equal variances assumed | 46.100 | .000 | 6.407 | .000 | .507 |
| Equal variances not assumed | 6.394 | .000 | .507 | |||
| 38) Practice or have practiced sports in federated competitions. | Equal variances assumed | 523.840 | .000 | 11.808 | .000 | .919 |
| Equal variances not assumed | 11.722 | .000 | .919 | |||
| Total factor: physical activity habits | Equal variances assumed | 27.696 | .000 | 9.457 | .000 | 3.56098 |
| Equal variances not assumed | 9.433 | .000 | 3.56098 | |||
Mean scores (men–women): (8): 3.41–2.97; (14): 3.39–3.05; (24): 2.96–1.88; (31): 2.64–2.03; (36): 2.09–1.17; (38): 2.09–1.17. Total factor: 16.65–13.09.
In the general linear model (ANOVA) that relates the scores obtained in the global physical-sports practice habits factor with the different age groups (Table 8). We did not find statistically significant differences (p>0.05).
One-factor ANOVA that analyzes the differences in the scores of the “Physical-sports practice habits” depending on the age groups. Dependent variable: physical-sport activity habit; DMS (difference in mean scores).
| (1) Age | (2) Age | Difference between means (I−J) | Std. error | Significance | 95% confidence interval | |
|---|---|---|---|---|---|---|
| Upper bound | Lower bound | |||||
| 20–40 | 41–48 | −.0990 | .54710 | .857 | −1.1729 | .9750 |
| 49–55 | .1222 | .55205 | .825 | −.9614 | 1.2059 | |
| 56–72 | .5102 | .59151 | .389 | −.6509 | 1.6714 | |
| 41–48 | 20–40 | .0990 | .54710 | .857 | −.9750 | 1.1729 |
| 49–55 | .2212 | .53955 | .682 | −.8380 | 1.2803 | |
| 56–72 | .6092 | .57987 | .294 | −.5291 | 1.7475 | |
| 49–55 | 20–40 | −.1222 | .55205 | .825 | −1.2059 | .9614 |
| 41–48 | −.2212 | .53955 | .682 | −1.2803 | .8380 | |
| 56–72 | .3880 | .58454 | .507 | −.7595 | 1.5354 | |
| 56–72 | 20–40 | −.5102 | .59151 | .389 | −1.6714 | .6509 |
| 41–48 | −.6092 | .57987 | .294 | −1.7475 | .5291 | |
| 49–55 | −.3880 | .58454 | .507 | −1.5354 | .7595 | |
Based on observed means. 22–40: (14.96±6.27); 41–48: (15.06±5.00); 49–55 (14.84±5.46); 56–72: (14.45±5.57). Observed power: .131, F=0,40; p>0.05, (a) calculated with alpha=.05 and (b) Eta squared=.002 (corrected Eta squared=.002).
Given the importance that physical-sports practice habits have for health, it is striking to observe how almost two thirds of the subjects participating in our research (74.4%) present a non-healthy or unhealthy level of said habits, a 18.8% are at the level tending towards health and only 6.9% reach a healthy level. Likewise, we found a positive and significant association (χ2=24.50; p<0.0005) of healthy physical-sports practice habits in men, while women are associated with unhealthy levels. On the contrary, we found no significant relationship or association of the level of health in practice habits with the age ranges analyzed that range from 22 to 72 years. These differences based on sex and age are corroborated in the inferential results, such that in the t-Student test, men have significantly higher means (p<0.0005) in all items and in the global mean of the factor. No. 2 “physical-sports practice habits”; On the contrary, the analysis of variance carried out (one-factor ANOVA) did not detect significant variations (p>0.05) between the different age groups. We can interpret that, during adulthood, there are low levels of physical-sports practice that remain constant over time, being significantly lower in the case of women.
The factor that defines physical-sports practice habits in our E-VEVSA scale is made up of 7 items. The analysis of the correlations established between these items allows us to interpret how they are grouped. We found a very high and significant Pearson r value (r=.716; p<0.0005) between items 8 and 14, which conceptually refer to the type of exercise and the volume of practice carried out by the subject in terms of days and hours. On the other hand, items 24, 31, 36 and 38 refer to the physical abilities, motor and sports competence self-perceived by the subject. Among these four items, the Pearson's r value is somewhat lower (Pearson's r<6), a circumstance that detects two conceptually different groupings of items. But, when correlating both groups of items, the Pearson r values are high and significant, a circumstance that indicates, as various research points out, 26–28 the strong relationship between the practice of physical exercise performed and the self-perception of competence motor and sports.
We can verify the low levels of health in physical-sports practice habits in adult subjects in various investigations that indicate results similar to those found in our E-VEVSA scale. In this sense, the National Health Survey in Spain 26 indicates that more than a third of the population (38.3%) from 15 years of age (students, workers or dedicated to housework) remains sitting for most of their day; another 40.8% are standing without making great movements or efforts. Both groups make up almost 80% of the population studied. Men and women spend the day predominantly sitting in similar proportions (38.7% and 37.9% respectively). More than a third (36%) of the population indicates that their leisure time is spent almost entirely sedentary (reading, watching television, going to the movies, etc.) with, as in our results, the highest prevalence in women than in men (40% versus 32%).
Leyton et al.,27 applied the “Healthy Lifestyle Questionnaire (CEVS-II)” in Spain to a sample of 1132 subjects (54.90% men and 45.10% women) aged between 18 and 89 years. One of the dimensions analyzed the subjects’ physical activity practice and was made up of 5 items from the questionnaire valued with a numerical and ranked score between 1 and 5 on the questionnaire. These authors obtained a higher overall record (3.74±1.03) than that observed in our results (2.47±0.92). Perhaps the difference in the records is due to the fact that 469 subjects in the sample in this research belonged to environments in rural regions with populations of less than 2500 inhabitants, where jobs that involve greater physical activity are carried out, while the sample that we have used In the case of E-VEVSA, it comes from health centers in cities with over 30,000 inhabitants, in urban environments where there is more technology and mechanization and fewer possibilities of carrying out tasks with greater physical involvement. This trend is observed in the research carried out by Ding et al., 28 in China on a random sample of 287 adults from a rural environment in Suixi region, Guangdong. The authors highlight that modernization and urbanization have led to changes in lifestyle and increased risks of chronic diseases. Activity patterns differ depending on occupation. Farmers were more active through their work than other occupations, but were less active and more sedentary during the non-agricultural season than during the agricultural season.
It is important to consider the proposal of Aparicio et al.,29 on a sample of 433 subjects (43% men and 57% women) from Madrid (Spain) and Mallorca (Spain), where they classify the level of physical activity in older adults using the combination of physical activity and sedentary behavior. Their results highlight that men spend more time doing regular physical activity but less time walking and working at home than women (p<0.001). Comparing the groups (inactive and high sedentary lifestyle, inactive and low sedentary lifestyle, active and high sedentary lifestyle, and active and low sedentary lifestyle), the worst aerobic resistance (p<0.001) and lower body strength (p<0.05) was obtained in the sex male of both inactive groups. Agility was higher in the active and slightly sedentary group (p<0.05). No significant differences were observed in women.
In the rest of Europe the trend is very variable, but the data on sedentary lifestyle in the adult population are similar to obtained in Spain. In this sense, Van Tuyckom et al.,30 using the survey called “Eurobarometer 62.0” in a sample of 23,909 Europeans from 25 member countries of the European Community, point out that the habit of regular physical-sports practice was less than 40%. The study identifies gender differences, such that in Belgium, France, Greece, Latvia, Lithuania, Slovakia, Spain and the United Kingdom, men were more likely to report playing sports regularly than women, while in Denmark, Finland, Sweden and the Netherlands the opposite was true.
In South America, Rojas-Aboite et al.,31 in a descriptive and cross-sectional investigation on a sample of 165 hospital workers (63% women and 37% men) between 30 and 58 years of age in Mexico, measured physical activity performed using a version in Spanish from the “World Health Organization Global Questionnaire on Physical Activity”. They observe that 20% perform low physical activity and 29.7% appear sedentary. Only 11% perform moderate physical activity at work and 4.2% perform intense activity in their free time. Regarding the possible causes of this reduction in the level of physical-sports practice, we agree with Prince et al., 32 when they point out that the occupational work environment is one of the causes that prevents adults from engaging in regular and systematic physical exercise. In this sense, we support the arguments of González-Cardozo and Riaño,33 when they demand the management of practice spaces in the workplace intended for workers to carry out physical-sports activities.
The low levels of physical activity in adults are also observed by Serón et al.,34 in a descriptive cross-sectional investigation in a sample of 1535 Chilean work-active subjects (27.9% men and 71.1% women) between 35- and 70-year old. The level of physical activity was medium using the “International Physical Activity Questionnaire (IPAQ)” validated by Craig et al.35 As in our results, these authors observed a low level of physical-sports practice (74.4%) in different activities of daily life. It can be seen that there is greater energy expenditure in work-related activities, especially in men, and, on the contrary, energy expenditure related to free-time activities is very low for both sexes and all age groups, which would explain the high degree of sedentary lifestyle, exercising for 30min at least three times a week and outside of work.
As in our research, Ventura and Zeballos 36 found a high degree of sedentary lifestyle when analyzing the lifestyle in a sample of 100 Peruvian adults using the questionnaire “Lifestyles in nutrition, physical activity, rest and sleep.” The authors point out that 63% of older adults do not do physical activity during the week, 70% do not move their whole body, 77% read or watch television programs during their free time and only 12% do breathing exercises. When we talk about adults over 65 years of age, improving lifestyle is very important, a circumstance confirmed by Li et al.,37 when analyzing the 2014 Chinese Longitudinal Healthy Longevity Survey (CLHLS) to identify the predominant health lifestyles among Chinese elderly from 85 to 105 years old. The findings showed that healthy lifestyle behaviors and light physical activities stimulated Chinese elderly's positive feelings and led to better evaluation of subjective well-being. Conversely, less healthy lifestyle behaviors and a sedentary lifestyle may be a predictor of negative feelings. It is important to integrate healthy lifestyle choices to promote the psychological well-being of the elderly.
Records on the prevalence of sedentary lifestyle in the adult population are also very high in North America. Thus, the Centers for Disease Control and Prevention38 has shown that 48.4% of the American population does not comply with the suggestions for aerobic activity and 70.7% does not comply with the recommendations for adequate muscle conditioning.
This study presents the following limitations: habits, thoughts, and attitudes do not conform to numerical scales, and therefore, reducing them to hierarchical responses with numerical measurement ranges introduces a clear bias in their evaluation. Additionally, by restricting participants’ possible responses to predefined options determined a priori, their answers may be conditioned or directed to some extent. Finally, there is the possibility of random error, as the study did not survey all Spanish adults but rather a statistically significant sample, which inherently involves an acknowledged and accepted margin of error.
ConclusionsAccording to our results and the data reported in the research reviewed, the physical-sports habits of adults are unhealthy or unhealthy, finding a very high proportion of sedentary lifestyle that is even more pronounced in the case of women. Having information on collective and individual data on this habit will be essential to plan and develop strategies aimed at promoting the regular practice of physical-sports activity that generates positive effects on health and quality of life.
FundingThe research has not received funding from any public or private institution.
Conflict of interestThe authors declare that they have no conflict of interest.
We thank the family doctors who have held a training seminar and participated in the administration of the scale to the patients who have been included in the sample of this research.


