


Cardiovascular diseases continue to lead the ranking of mortality in Spain. The implementation of geostatistical analysis techniques in the clinical laboratory are innovative tools that allow the design of new strategies in primary prevention of cardiovascular disease. The aim of this study was to study the prevalence and geolocation of severe dyslipidemia in the health areas under study in order to implement prevention strategies in primary care. A retrospective cohort study of low-density protein-bound cholesterol, triglyceride and lipoprotein (a) levels in the years 2019 and 2020 were carried out. In addition, a geostatistical analysis was performed including representation in choropleth maps and the detection of clustering clusters, using geographic information in zip code format included in the demographic data of each analytic.
ResultsThe analytical data included in the study were triglycerides (n=365,384), low density protein-bound cholesterol (n=289,594) and lipoprotein to lipoprotein (a) (n=502). Areas with the highest and lowest percentage of cases were identified for the established cut-off points of LDL-C>190mg/dl and TG>150mg/dl. Two clustering clusters with statistical significance were detected for cLDL>190mg/dl and a total of 6 clusters for TG values>150mg/dl.
ConclusionsThe detection of clusters, as well as the representation of choropleth maps, can be of great help in detecting geographic areas that require greater attention to intervene and improve cardiovascular risk.
Las enfermedades cardiovasculares continúan encabezando la mortalidad en España. Las técnicas de análisis geoestadístico en el laboratorio clínico son herramientas innovadoras que permiten el diseño de nuevas estrategias en prevención primaria de enfermedad cardiovascular. El objetivo fue estudiar la prevalencia y geolocalización de dislipidemias en las áreas sanitarias de estudio para implementar estrategias de prevención en atención primaria. Se llevó a cabo un estudio de cohorte retrospectivo de los niveles de colesterol unido a proteínas de baja densidad, triglicéridos y lipoproteína (a) en los años 2019 y 2020. Además, se realizó un análisis geoestadístico que incluyó la representación en mapas coropléticos y la detección de clústeres de agrupación; para ello, se utilizó la información geográfica en formato de código postal incluida en los datos demográficos de cada analítica.
ResultadosLos datos analíticos incluidos en el estudio fueron triglicéridos (n=365.384), colesterol unido a proteínas de baja densidad (n=289.594) y lipoproteína (a) (n=502). Se identificaron las áreas con mayor y menor porcentaje de casos para los puntos de corte establecidos de cLDL>190mg/dl y TG>150mg/dl. Se detectaron 2 clústeres de agrupación con significación estadística para cLDL>190mg/dl y un total de 6 clústeres para los valores de TG>150mg/dl.
ConclusionesLa detección de clústeres, así como la representación de mapas coropléticos, pueden ser de gran ayuda en la detección de áreas geográficas que requieran de mayor atención para intervenir en el riesgo cardiovascular.
Cardiovascular diseases (CVD) are major health issues worldwide due to their increasing prevalence and mortality and disability, imposing a heavy economic burden.1 In most developed countries, including Spain, CVD is the leading cause of death and causes significant health loss.2 The mortality rate attributed to CVD in 2018 was 258 per 100,000 inhabitants. This figure rises to 270 in Andalusia.3 CVD are also the leading cause of death worldwide and account for an estimated 17.9 million lives lost each year. More than 4 out of every 5 deaths from CVD are due to coronary heart disease and stroke, and one third of these deaths occur prematurely in people under 70 years of age.4
The results of the DRECA study by the Andalusian Health Service in 1998 conducted to determine the risk factors for CVD in a comprehensive and representative way in the Andalusian population, showed a highly worrying picture from a public health perspective, prompting health promotion and education measures, intersectoral action, changes in lifestyles and nutrition in a large number of citizens.5
According to the DARIOS study, the prevalence of hypertension, dyslipidaemia, obesity, smoking, and diabetes mellitus is high, with relatively low variability in the population aged 35–74 years between the autonomous communities. The Canary Islands, Extremadura, and Andalusia show a higher prevalence of cardiovascular risk factors than the average of the 11 component studies.6
Prospective population-based studies have shown that plasma Lp(a) concentration is positively associated with the development of coronary heart disease and stroke independently of the main cardiovascular risk factors.7
CVD prevention is an essential task of primary care.8 Improving cardiovascular prevention requires an alliance between policy makers, administrations, scientific and professional associations, health foundations, consumer associations, patients and their families, to drive population and individual strategy by using the full spectrum of available scientific evidence, from clinical trials in patients to observational studies and mathematical models for the evaluation of population-based interventions, including cost-effectiveness analyses.9
The SARS-CoV-2 pandemic has led to the creation and development of applications and websites to fight COVID-19, both by official institutions and corporate or private initiatives.10
Many projects have emerged that use technologies such as geolocation, geopositioning, geofencing, tracking, and contact registration via Bluetooth to generate a huge amount of data. Big data analysis techniques, geographic information systems (GIS) and artificial intelligence have produced information for health institutions and for society itself, which has helped deal with the health crisis more efficiently.11
For many years, governmental, community, administrative, and political organisations have been trying to understand the relationships between geography and health.12 As a result, GIS systems have been widely used in epidemiology. Initiatives using this technology in heart disease have emerged because of the increased concern regarding CVD over the last decade.13–15
ObjectivesThe aim was to quantify the prevalence of patients with dyslipidaemia and their geolocation in the health areas selected for implementing cardiovascular prevention strategies in primary care and to study whether the distribution of the areas found is statistically significant using cluster analysis.
Material and methodsWe conducted a retrospective cohort study to examine the prevalence of dyslipidaemia in our area. To that end, we consulted the computer systems of the laboratories of Hospital Infanta Elena and Hospital Juan Ramón Jiménez, which contain information on all the tests of interest performed in the population in 2019 and 2020. The Juan Ramón Jiménez Hospital provides healthcare coverage for 264,300 inhabitants at the basic level of care, and the Infanta Elena Hospital provides coverage for an estimated population of 175,000 inhabitants.
Based on the recommendations of the clinical guidelines according to risk, cut-off points were established for each of the parameters, in particular, according to the recommendations of the latest clinical guidelines of the European Atherosclerosis Society.16 The cut-off points chosen were triglycerides (TG)>150mg/dl, LDL cholesterol (LDLC)>190mg/dl (cut-off point established by clinical guidelines as a possible suspicion of familial hypercholesterolaemia) and lipoprotein (a) (Lp[a])>50mg/dl.
The statistical package IBM SPSS Statistics for Windows, version 25.0 (Armonk, IBM Corp, USA) was used for the statistical analysis of the data.
The number of cases with values above the cut-off points established for each postcode was quantified and patients with lower analytical values were established as a control group. The percentage of cases with the selected analytical criteria in the area was calculated for each postcode. Only those areas whose population was higher than .5% of the total population were included in the study to avoid over-representation of outliers in the maps.
The number of Lp[a] measurements was not sufficient to be of interest in the choropleth representation, nor to conduct stratification in postcodes.
The choice of the colorimetric scale for the choropleth maps was adjusted according to the maximum and minimum percentages for each of the parameters studied.
A free and open-source geographic information system (QGIS Geographic Information System 3.16.3-Hannover, QGIS Association) was used to represent the data obtained. GIS is software that allows users to visualise, analyse, and interpret geographic data to help them understand and solve problems related to relationships and patterns. It identifies high-risk areas that require attention and action.17
The maps are delimited by postcodes and were obtained from Andalusia’s Institute of Statistics and Cartography. These maps are licensed under Creative Commons Attribution 4.0 (CC BY 4.0) (Instituto de Estadística y Cartografía de Andalucía, Creative Commons Reconocimiento 4.0, CC BY 4.0).
The spatial analysis was performed with Kulldorff M. and Information Management Services (Inc. SaTScanTM v. 8.0, Software for the spatial and space-time scan statistics)18 to test for the presence of clusters of increased cardiovascular risk and identify their approximate location, so that, for each cluster, the likelihood ratio was calculated assuming an independent Bernoulli distribution of cases, allowing more focused cluster mapping and assessment, as it uses location data directly.19
The Research Ethics Committee of the Centro Hospital Universitario Virgen Macarena de Sevilla approved the study.
ResultsThe number of analytical data included in the study was 289,594 patients for LDL-C, 365,384 patients for TG, and 502 patients for Lp(a). The distribution of patients is not homogeneous between the different postcodes, as shown in Fig. 1, and therefore centralisation measures were used for the calculations; to avoid over-representation of areas with too few cases, a minimum cut-off point of .5% of the total cases was set for the inclusion of postcodes in the study.

The results for the different cut-off points (Table 1) were a total of 405 (.11%) for TG>880mg/dl; 85. 376 (23.37%) with TG between 150−880mg/dl; for LDLC>190mg/dl there were 5907 (2.04%) cases, and for Lp(a)>50mg/dl only 150 (29.88%) were found.
Number and percentage of patients with levels above those of the cut-off points.
| Study parameter mg/dl | Number of analytical measurements (%) |
|---|---|
| TG>880 | 405 (.11) |
| TG 150−880 | 85,376 (23.37) |
| LDLC>190 | 5907 (2.04) |
| Lp(a)>50 | 150 (29.88) |
LDLC: Low-density lipoprotein cholesterol; Lp(a): Lipoprotein (a); TG: Triglycerides.
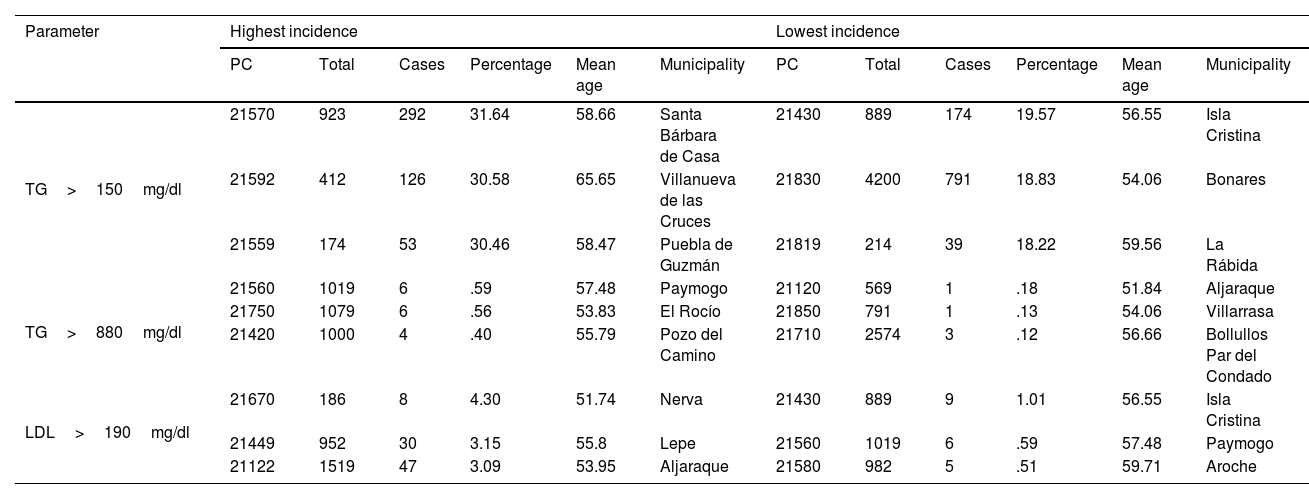
The areas with the highest and lowest percentage of cases are shown in Table 2. Fig. 2 shows the percentages of the population with TG above 150mg/dl. The towns with the highest percentages are Santa Bárbara de Casa (31.64%), Villanueva de las Cruces (30.58%), and Las Herrerías (30.46%); while the towns whose postcodes represented the lowest proportion of cases were Isla Cristina (19.57%), Bonares (18.83%), and Palos de la Frontera (18.22%).
Postcodes with highest and lowest incidence according to cut-off points and average population age.
| Parameter | Highest incidence | Lowest incidence | ||||||||||
|---|---|---|---|---|---|---|---|---|---|---|---|---|
| PC | Total | Cases | Percentage | Mean age | Municipality | PC | Total | Cases | Percentage | Mean age | Municipality | |
| TG>150mg/dl | 21570 | 923 | 292 | 31.64 | 58.66 | Santa Bárbara de Casa | 21430 | 889 | 174 | 19.57 | 56.55 | Isla Cristina |
| 21592 | 412 | 126 | 30.58 | 65.65 | Villanueva de las Cruces | 21830 | 4200 | 791 | 18.83 | 54.06 | Bonares | |
| 21559 | 174 | 53 | 30.46 | 58.47 | Puebla de Guzmán | 21819 | 214 | 39 | 18.22 | 59.56 | La Rábida | |
| TG>880mg/dl | 21560 | 1019 | 6 | .59 | 57.48 | Paymogo | 21120 | 569 | 1 | .18 | 51.84 | Aljaraque |
| 21750 | 1079 | 6 | .56 | 53.83 | El Rocío | 21850 | 791 | 1 | .13 | 54.06 | Villarrasa | |
| 21420 | 1000 | 4 | .40 | 55.79 | Pozo del Camino | 21710 | 2574 | 3 | .12 | 56.66 | Bollullos Par del Condado | |
| LDL>190mg/dl | 21670 | 186 | 8 | 4.30 | 51.74 | Nerva | 21430 | 889 | 9 | 1.01 | 56.55 | Isla Cristina |
| 21449 | 952 | 30 | 3.15 | 55.8 | Lepe | 21560 | 1019 | 6 | .59 | 57.48 | Paymogo | |
| 21122 | 1519 | 47 | 3.09 | 53.95 | Aljaraque | 21580 | 982 | 5 | .51 | 59.71 | Aroche | |
LDLC: Low-density lipoprotein cholesterol; Lp(a): Lipoprotein (a); PC: Postcode; TG: Triglycerides.

With the cut-off point of TG>880mg/dl, the number of total cases detected in the whole region was 405, which represents .11% of the study sample and includes the towns of Paymogo, Almonte, and Cartaya with .59; .56, and .40% of the cases, respectively. Due to the low number of cases, we considered that it was not representative to perform choropleth mapping at this cut-off point.
The cut-off point established for LDLC was 190mg/dl. Fig. 3 shows the percentages of cases by postcode: those with the highest percentage of cases are located in Nerva (4.30%), Lepe (3.15%), and Aljaraque (3.09%). The postcodes with the lowest incidence are the towns of Isla Cristina (1.01%), Paymogo (.59%), and Aroche (.51%).
 values above 190mg/dl by postcode in the province of Huelva.")
The number of Lp(a) measurements made during the study period was 524, insufficient for mapping.
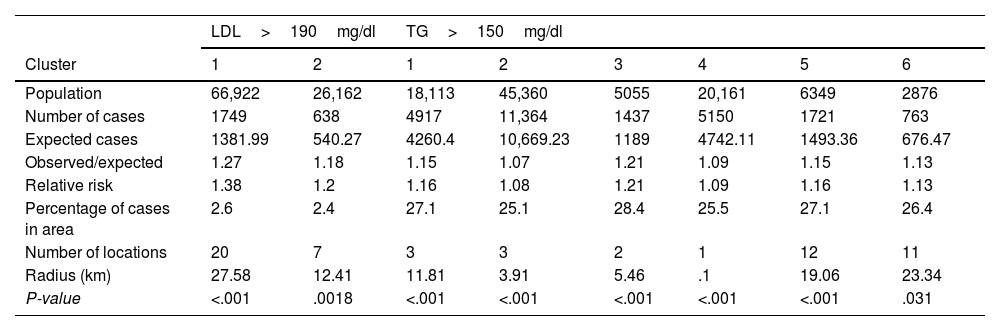
Spatial cluster analysisIn the analysis of LDLC above 190mg/dl, 2 clusters were obtained (Table 3) with statistical significance (P<.001). The first included a population of 66,922 measurements with a total of 1749 detected cases; the expected number of cases in the area was 1,381.99, which implied a relative risk (RR) for being included within the area of 1.38. The second cluster was a population of 26,162 measurements, 638 of which exceeded the cut-off point: this gives a RR of 1.2. The area radius for cluster 1 was 27.58km and 12.41km for cluster 2, shown in Fig. 4.
Description of clusters found.
| LDL>190mg/dl | TG>150mg/dl | |||||||
|---|---|---|---|---|---|---|---|---|
| Cluster | 1 | 2 | 1 | 2 | 3 | 4 | 5 | 6 |
| Population | 66,922 | 26,162 | 18,113 | 45,360 | 5055 | 20,161 | 6349 | 2876 |
| Number of cases | 1749 | 638 | 4917 | 11,364 | 1437 | 5150 | 1721 | 763 |
| Expected cases | 1381.99 | 540.27 | 4260.4 | 10,669.23 | 1189 | 4742.11 | 1493.36 | 676.47 |
| Observed/expected | 1.27 | 1.18 | 1.15 | 1.07 | 1.21 | 1.09 | 1.15 | 1.13 |
| Relative risk | 1.38 | 1.2 | 1.16 | 1.08 | 1.21 | 1.09 | 1.16 | 1.13 |
| Percentage of cases in area | 2.6 | 2.4 | 27.1 | 25.1 | 28.4 | 25.5 | 27.1 | 26.4 |
| Number of locations | 20 | 7 | 3 | 3 | 2 | 1 | 12 | 11 |
| Radius (km) | 27.58 | 12.41 | 11.81 | 3.91 | 5.46 | .1 | 19.06 | 23.34 |
| P-value | <.001 | .0018 | <.001 | <.001 | <.001 | <.001 | <.001 | .031 |
LDLC: Low-density lipoprotein cholesterol; TG: Triglycerides.
 values above 190mg/dl by postcode in the province of Huelva.")
For TG values>150mg/dl, a total of 6 clusters were obtained (P<.001) (Fig. 5). Cluster 1 has a population of 18,113, with a total number of cases of 4917, with 4,260.4 expected cases. The RR was 1.16, with a radius of 11.81km. Cluster 2 had a population of 45,360, 11,364 cases, 10,669.23 expected cases, and an RR of 1.08. Cluster 3 population was 5055, with 1437 cases, 1189 expected and an RR of 1.21 with a radius of 5.46km. The radius of cluster 4 was the smallest of those included, with .1km, and an RR of 1.09 in this area. The last 2 were the largest: cluster 5 had a radius of 19.06km with an RR of 1.16 while cluster 6 had a radius of 23.34 and an RR of 1.13.
Discussion
We found areas with very different prevalence for the selected cut-off points for each variable and, thanks to the representation in choropleth maps (Figs. 2 and 3), we achieved better visualisation of the data to obtain greater impact of the findings. In addition, several clusters were detected with a higher number of cases than expected in their area (Figs. 4 and 5). These findings may be very useful to identify geographical areas in which to initiate cardiovascular prevention strategies.20
Cardiovascular prevention remains one of the great challenges facing our society, as this group of diseases has a high morbidity and mortality rate.20
The cardiovascular epidemic is a serious public health problem in Spain, which can only be tackled by implementing appropriate preventive measures.21
These tools can be of great help in terms of prevention; however, despite their potential, geographically specific intelligence on public health interventions is still rarely used in disease mapping.22
Cardiovascular risk remains a concern for health organisations, and in the Spanish population it is high. Population-based monitoring of cardiovascular risk is essential in the planning of preventive and care measures.23
Hypertriglyceridaemia (HTG) is a risk factor that not only increases the incidence of pancreatitis, but also contributes significantly to an increased residual cardiovascular risk and is important because of its high prevalence and clinical relevance as it is associated with an increased risk of arteriosclerotic CVD.24
The high prevalence of HTG has serious socioeconomic and health consequences because it increases cardiovascular morbidity and mortality. Assessment of the prevalence of HTG is very important to better plan cardiovascular prevention intervention policies, optimise available health resources, and improve patient care and quality of life.24
In a multicentre study conducted in hospitals in Andalusia and Ceuta,25 a geographical triangle of higher prevalence of hypercholesterolaemia was observed between the provinces of Huelva, Seville, and Cadiz. It was detected that .14% of the study population had LDLC values>250mg/dl. In our study, 2.04% had LDLC values>190mg/dl. These data reflect a far from an ideal situation.
One third of the patients whose Lp(a) levels were measured (29.38%) had values above 50mg/dl. This is confirmed by the Spanish SAFEHEART study,26 which was designed to analyse the situation and improve knowledge of heterozygous familial hypercholesterolaemia in Spain and found that 30% of patients with this condition had Lp(a) values above 50mg/dl. Patients with values above this cut-off point had familial hypercholesterolaemia.
Elevated Lp(a) in hospitals in southern Spain is under-diagnosed, and there is no uniformity of protocols for its application or in the analytical methodology used.27
Information technologies, such as GIS, provide cost-effective tools to evaluate interventions and policies that may affect health outcomes.28 The use of GIS and the spatial representation of various health issues enable professionals to reach conclusions faster and better in both public health and decision-making.29
The results of our study could be complemented in the future with the joint representation of geolocated cardiological events to study whether there is a spatial correlation between biochemical parameters and events.
As with the original SARS-CoV epidemic of 2002/2003 and with seasonal influenza, during the COVID-19 pandemic, geographic information systems and methods have proven indispensable for timely and effective surveillance and response to the epidemic.30 It should be noted because of the ease and speed with which maps were produced during the pandemic, many map makers seemed to forget the fundamental principles of good, easy-to-read choropleth maps, which require knowledge of geospatial data for correct representation.31
Advances in health informatics can be made when GIS is applied through research. However, improvements in the quantity and quality of data input into these systems are needed to ensure that better geographic health maps are used so that appropriate conclusions can be drawn between public health and environmental factors.32
Study limitationsThe limitations of our study include the absence of some characteristics, such as the standard of living of the geographical area analysed, or the level of education of the population.
ConclusionsGeolocation techniques are a valuable tool and have been widely used in the epidemiology of diseases with a high capacity to spread; however, their use in prevention has not been as extensive.
CVD is a priority in healthcare systems and the development of efficient prevention remains a major goal. We need, therefore, to make use of new technologies that offer different perspectives to improve prevention.
Cluster detection, and the representation of choropleth maps, can be of great help in detecting geographical areas that require more attention to intervene and improve cardiovascular risk.
FundingThis study was conducted with funding from a research grant awarded in 2019 by the Spanish Atherosclerosis Society.
Conflict of interestsThe authors have no conflict of interests to declare.
We would like to thank the Clinical Analysis Service of Hospital Juan Ramón Jiménez and Hospital Infanta Elena, both in Huelva.
Article sent in reference to the oral communication awarded with the prize: Atención Primaria - Epidemiología del XXXIII Congreso de la Sociedad Española de Arteriosclerosis (Primary Care - Epidemiology of the XXXIII Congress of the Spanish Society of Arteriosclerosis) with the title “Aplicación de big data y análisis geoestadístico desde el laboratorio clínico en prevención cardiovascular para Atención Primaria” (Application of big data and geostatistical analysis from the clinical laboratory in cardiovascular prevention for Primary Care). According to the rules of the call, the prize will be awarded if the journal's committee receives and agrees to publish an original paper referring to the winning publication.