


Lifestyle modifications have been recommended as an essential treatment approach for cardiovascular diseases. Recent studies have shown that eating frequency (EF) correlates with hypertension and related risk of organ damage. This study aimed to examine critical clinical implications to evaluate the association of EF with arterial stiffness parameters as an early marker of atherosclerosis manifestations.
MethodsA cross-sectional descriptive study was performed on 658 participants of the PERSIAN Organizational Cohort study in Mashhad, aged 30–70 years. Arterial stiffness was assessed by measurement markers of arteriosclerosis, including arterial age, augmentation index (AIx), augmentation pressure (AP), carotid-femoral pulse wave velocity (Cf-PWV), and central blood pressure. Differences in anthropometric indices, blood indices, and arterial stiffness parameters were evaluated across EF groups.
ResultsOur data demonstrate that EF was positively correlated with total daily energy intake, and favourable profiles of adiposity and blood lipids. Subjects with an increased EF, had significantly lower AIx, AP, Arterial Age and Central blood pressure (P for trend<0.001) as compared to Lowest EF and not significant with PWV (P for trend, 0.19). Arterial stiffness was also significantly lower in those with increased EF compared with subjects with low EF. By Linear regression analysis, after adjustment for Confounding factors, except PWV, EF showed the associations with all of the non-invasive arterial stiffness parameters.
ConclusionIncreased EF is associated with a lower wave reflection and blood pressure in the central arteries.
Las modificaciones del estilo de vida se han recomendado como un enfoque de tratamiento esencial para las enfermedades cardiovasculares. Estudios recientes han demostrado que la frecuencia de las comidas (EF) se correlaciona con la hipertensión y el riesgo relacionado de daño orgánico. Este estudio tenía como objetivo examinar las implicaciones clínicas críticas para evaluar la asociación de la EF con los parámetros de rigidez arterial como un marcador temprano de las manifestaciones de la aterosclerosis.
MétodosSe realizó un estudio descriptivo transversal en 658 participantes del estudio de cohorte organizativo PERSIAN en Mashhad, de entre 30 y 70 años de edad. La rigidez arterial se evaluó mediante la medición de marcadores de arteriosclerosis, incluyendo la edad arterial, el índice de aumento (AIx), la presión de aumento (AP), la velocidad de la onda del pulso carótido-femoral (Cf-PWV) y la presión arterial central. Se evaluaron las diferencias en los índices antropométricos, los índices sanguíneos y los parámetros de rigidez arterial en los grupos de EF.
ResultadosNuestros datos demuestran que la EF se correlacionó positivamente con la ingesta energética diaria total, los perfiles favorables de adiposidad y los lípidos sanguíneos. Los sujetos con una EF aumentada, tenían un AIx, una AP, una edad arterial y una presión arterial central significativamente menores (p de tendencia <0,001) en comparación con la EF más baja y no significativa con la PWV (p de tendencia, 0,19). La rigidez arterial también fue significativamente menor en los sujetos con una mayor FE en comparación con los sujetos con una FE baja. Mediante un análisis de regresión lineal, después de ajustar los factores de confusión, excepto la VOP, la frecuencia de las comidas se asoció con todos los parámetros de rigidez arterial no invasivos.
ConclusionesEl aumento de la FE se asocia a una menor reflexión de la onda y a una menor presión arterial en las arterias centrales en individuos aparentemente sanos.
Hypertension, a major public health issue that because of its high prevalence, is an important preventable risk factor for cardiovascular disease (CVD) and chronic renal disease (CRD).1,2 Vascular stiffness is correlated, increasing the risk of chronic vascular diseases such as hypertension, stroke, and chronic kidney disease (CKD).3 Moreover, It could be a valid and independent objective for later cardiovascular events.4,5 Carotid-femoral pulse wave velocity (cfPWV), as a non-invasive measurement, is a gold-standard technique for assessing arterial stiffness. The ESC/ESH guidelines advocate using cfPWV for the measurement of large artery stiffness.6 It would be notable to mention that evaluation of total cardiovascular risk helps us to manage the best way to prevent CVD, while some classical risk factors might not be able to do.
Recent evidence shows that eating frequency (EF) inversely correlates with blood pressure and new-onset hypertension as well as subclinical atherosclerosis indices, especially in the carotids.7,8 However, additional investigations are necessary to authenticate these results.
On the other hand, Fabry and colleagues in 1964 observed an inverse association between regular EF and the prevalence of overweight in adults.9 Examinations show an association between higher with a lower BP and healthier bodyweight that may be useful for weight management.10–12 Nevertheless, studies, where EF and body weight were examined, have come to different conclusions, and others have shown no association between EF and markers of adiposity.13,14 Besides, studies have suggested that higher EF is usually associated with a more favourable lipid profile,15,16 lower insulin resistance,16,17 reduced risk of metabolic syndrome18 and a decrease in cardio-metabolic risk factors, like fasting glucose, triglycerides, total cholesterol, LDL-cholesterol, which may be mediated by the concomitant absence of abdominal obesity. Given that these metabolic factors are associated with vascular stiffness, arterial wave reflections, and blood pressure (BP),19,20 increased EF may affect the rate of progress of blood pressure and new-onset hypertension.
Thus, we aimed to evaluate the effect of EF on anthropometric indices and non-invasive arterial stiffness parameters in a sample of healthy adults.
Participants and methodsStudy populationWe selected 658 healthy Iranian adult participants (321 men and 337 women) based on convenience sampling and sample saturation from the PERSIAN Organizational Cohort study at Mashhad University of Medical Sciences. This population-based prospective organization cohort study was conducted among 10,000 randomly selected participants aged 30–70 years in Mashhad, Iran (2017–2020) as part of the “Persian cohort” research project. Detailed information about the PERSIAN Cohort can be found elsewhere.21 People who do not have any non-communicable chronic diseases (self-declaration) are defined as healthy people. According to the Ethical Principles and Declaration of Helsinki, Informed consent was obtained individually from all participants. The ethics committee of the Mashhad University of Medical Sciences approved the study protocol (Code of Ethics: IR.MUMS.MEDICAL.REC.1397.322).
Assessment of baseline covariatesSelf-declaration questionnaires collected data on sex, age, smoking habits, alcohol drinking, and physical activity using a valid and reliable questionnaire designed to collect data for all PERSIAN cohort sites. The physical activity dimension of participants’ lifestyles was assessed by using a validated physical activity questionnaire in the Persian cohort study. This questionnaire consists of 28 items and reports physical activity levels in MET-hours/day. MET values of each activity were extracted to identify activities using the compendium of physical activities. The mean rates of the participants’ metabolic equivalents (38.6METs/hour/day), who had less than 38.6METs/hour/day were defined as individuals with Poor-Physical Activity levels.
Smoking status is evaluated according to the National Health Interview Survey (NHIS). Current smokers were defined as persons who had smoked greater than 100 cigarettes and are currently smokers. Hookah use and alcohol consumption were also investigated in this study.
Assessment of dietary intake and eating frequencyAt baseline, the amount of consumed energy and Eating frequency (EF) during the day were measured from a 24-h dietary recall. We assisted participants in estimating specific quantities of foods and beverages consumed. The instructions were explained to participants on how to report the number of foods and beverages consumed using standard household measurements. Then they were asked to record in detail the type and amount of foods and beverages consumed in the past 24h. An eating episode defines as every eating, drinking, or anything with energy content.
Because there is no consensus about the time interval that identifies one eating occasion, we retained the same cutoff time used in the previous study by Karatzi et al.7 If two Eating frequencies occurred in a 15-min interval or less, they were counted as one episode. Participants were divided into four groups according to the Eating frequency in their 24-h dietary recall as follows: 3≥, 4–5, and ≥6 meals per 24h. Energy intake is defined as the total caloric or energy content of food and beverage consumed that was assessed using modified NUTRITIONIST IV software.
Assessment of under- and over-reporting of energy intakeFor the evaluation of under-reporting, the ratio of the energy intake (EI) to resting metabolic rate (RMR) was determined for each individual. RMR was measured by indirect calorimetry (MetaLyzer 3B, Cortex, Leipzig, Germany). We calculated the EI/RMR ratio and the corresponding cutoff to evaluate the validity of reported energy intakes. To check the relative degree of under- and over-reporting, we used the values defined by Goldberg et al.,22 and also the suggestion of Black et al. On the cutoff ratio of EI/RMR to over-reporting.23 Therefore, in the present study, a range of 1.35–2.39 was considered an acceptable report of energy intake.
Anthropometric analysisAll anthropometric and dietary intake assessments were performed by trained nutritionists. Anthropometric measurements, including body weight, height, and WC, were obtained. A Body Shape Index was calculated based on waist circumference (WC) adjusted for height and weight and using the following equation described by Krakauer et al.24
and Body Round Index, which is calculated using the equation described by Thomas et al.25

Body composition was assessed by bioimpedance analysis (InBody770, Biospance Co., Ltd. Seoul, Korea) following the standard tetrapolar whole-body (hand to foot, HF) technique.
Assessment of cf-PWVThe evaluation of non-invasive arterial stiffness parameters was conducted by trained physicians using the SphygmoCor (SphygmoCor Cardiovascular Management System software version 1.3; AtCor Medical Pty. Ltd., Sydney Australia) that relied on application tonometry for the acquisition of the radial, carotid, and femoral blood pressure waveforms. Briefly, after at least 6h of overnight fast, measurements were performed in the morning in a supine position after at least five minutes of resting in a quiet and room-controlled temperature of 23–25°C.
According to the instructions of the device SphygmoCor XCEL PWA, we used a standard brachial cuff (which was analyzed by SphygmoCor software) to measure brachial pressures and capture a brachial waveform, also measured central blood pressure. For the cfPWV, a cuff was placed around the patient's femoral artery to evaluate the femoral waveform, and a tonometer was applied to measure the carotid waveform. We measured the participant's Carotid to Sternal Notch length (in millimetres) and also the length of Sternal Notch to Cuff (in millimetres). Moreover, the velocity is automatically determined by dividing the distance by the pulse transit time. After 10s of simultaneous valid carotid tonometer signal. The SphygmoCor software derived the ascending aortic pressure wave, predominantly equivalent to the pressure wave measured by an invasive catheter. The number of valuable cardiovascular measurements were determined from the aortic pressure wave, including central aortic systolic pressure, aortic augmentation pressure, and aortic augmentation index (AIx). The SphygmoCor Reference Age (Arterial age) for any given participant, is the age of healthy people in the reference population who have similar average aortic pressure parameters. The cfPWV was calculated using the distance and mean time difference between the two-recorded points.
Laboratory measurementsBlood sampling was drawn in the morning after 10–12h of fasting and collected into vacuum tubes (EDTA and Clot). Biochemical tests were analyzed by using the BT1500 analyzer (BT 1500; Biotecnica Instruments, Rome, Italy). The external quality control process is performed monthly by repeating experiments on two random samples in Mashhad Reference Laboratory (Dr. Ejtehadi Laboratory).
Exclusion criteriaTo examine a sample of healthy individuals based on the entire Persian cohort population, we did not include individuals with the following characteristics: diabetes, deep vein thrombosis (DVT), and self-reported previous cardiovascular disease, presence of prosthetic material (stent-grafts) in the vasculature. Other Exclusion criteria were: pregnancy, lactation, clinical conditions that could hamper haemodynamic measurements (absence of femoral arterial pulse, SBP<90mmHg) and other factors that may have influenced arterial stiffness, e.g. extreme beliefs or behaviour related to diet, regular use of vitamins or mineral supplementation and past medical history of serious diseases.
Statistical analysisA comparison of quantitative categorical variable changes across multivariate qualitative subgroups (EF groups) was assessed using analysis of variance (ANOVA) or nonparametric equivalent tests and performed using Trend analysis and P for trend report. Association of arterial stiffness parameters with behavioural habits, including EF, EI, smoking habits, alcohol use, physical activity, and sleep duration were assessed using different linear regression models by modifying the effect of confounding variables with a significance level of 0.05 and presented as beta and CI 95%. The same was done for the association of EF with anthropometric indices. Analysis of arterial stiffness parameters correlation with behavioural habits was adjusted for age, sex, systolic blood pressure (SBP), diastolic blood pressure (DBP), heart rate, BMI, fasting blood sugar (FBS), and cholesterol (CHOL). Analysis of EF correlation with anthropometric indices as well was adjusted for age, sex, smoking habits, alcohol use, and physical activity. Nutritionist IV was used to analyze dietary energy intakes, and we used SPSS version 25 for statistical analysis.
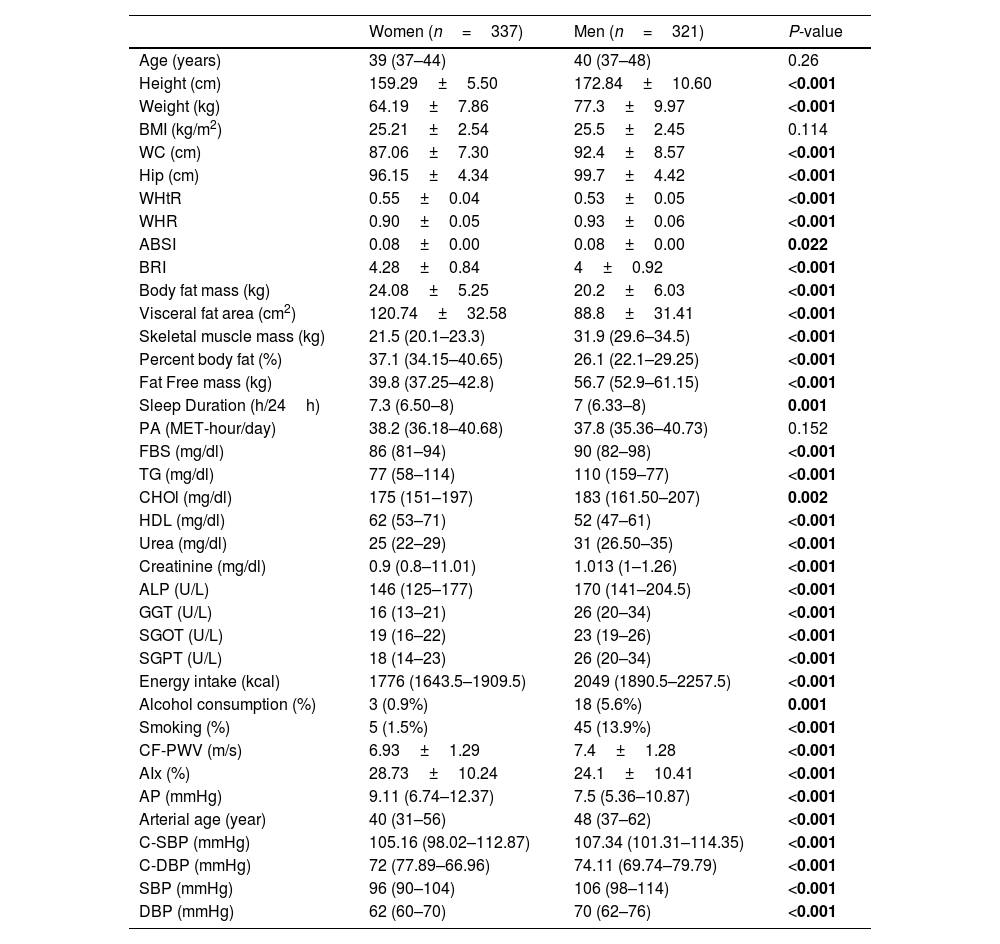
ResultsOverall, data from 658 healthy adults were analyzed. Descriptive baseline characteristics of participants according to sex are shown in Table 1. In this study, 321 men with a mean age of 40 (37–48) years and 337 women with a mean age of 39 (44–37) years (P-value=0.26) were included in the study. Arterial stiffness, central and peripheral blood pressure by sex were significantly different. Given that the distribution of fat differs between men and women, as expected, anthropometric measurements were also significantly different between the two genders.
Basic characteristics of the study participants: the PERSIAN cohort study (n=658).
| Women (n=337) | Men (n=321) | P-value | |
|---|---|---|---|
| Age (years) | 39 (37–44) | 40 (37–48) | 0.26 |
| Height (cm) | 159.29±5.50 | 172.84±10.60 | <0.001 |
| Weight (kg) | 64.19±7.86 | 77.3±9.97 | <0.001 |
| BMI (kg/m2) | 25.21±2.54 | 25.5±2.45 | 0.114 |
| WC (cm) | 87.06±7.30 | 92.4±8.57 | <0.001 |
| Hip (cm) | 96.15±4.34 | 99.7±4.42 | <0.001 |
| WHtR | 0.55±0.04 | 0.53±0.05 | <0.001 |
| WHR | 0.90±0.05 | 0.93±0.06 | <0.001 |
| ABSI | 0.08±0.00 | 0.08±0.00 | 0.022 |
| BRI | 4.28±0.84 | 4±0.92 | <0.001 |
| Body fat mass (kg) | 24.08±5.25 | 20.2±6.03 | <0.001 |
| Visceral fat area (cm2) | 120.74±32.58 | 88.8±31.41 | <0.001 |
| Skeletal muscle mass (kg) | 21.5 (20.1–23.3) | 31.9 (29.6–34.5) | <0.001 |
| Percent body fat (%) | 37.1 (34.15–40.65) | 26.1 (22.1–29.25) | <0.001 |
| Fat Free mass (kg) | 39.8 (37.25–42.8) | 56.7 (52.9–61.15) | <0.001 |
| Sleep Duration (h/24h) | 7.3 (6.50–8) | 7 (6.33–8) | 0.001 |
| PA (MET-hour/day) | 38.2 (36.18–40.68) | 37.8 (35.36–40.73) | 0.152 |
| FBS (mg/dl) | 86 (81–94) | 90 (82–98) | <0.001 |
| TG (mg/dl) | 77 (58–114) | 110 (159–77) | <0.001 |
| CHOl (mg/dl) | 175 (151–197) | 183 (161.50–207) | 0.002 |
| HDL (mg/dl) | 62 (53–71) | 52 (47–61) | <0.001 |
| Urea (mg/dl) | 25 (22–29) | 31 (26.50–35) | <0.001 |
| Creatinine (mg/dl) | 0.9 (0.8–11.01) | 1.013 (1–1.26) | <0.001 |
| ALP (U/L) | 146 (125–177) | 170 (141–204.5) | <0.001 |
| GGT (U/L) | 16 (13–21) | 26 (20–34) | <0.001 |
| SGOT (U/L) | 19 (16–22) | 23 (19–26) | <0.001 |
| SGPT (U/L) | 18 (14–23) | 26 (20–34) | <0.001 |
| Energy intake (kcal) | 1776 (1643.5–1909.5) | 2049 (1890.5–2257.5) | <0.001 |
| Alcohol consumption (%) | 3 (0.9%) | 18 (5.6%) | 0.001 |
| Smoking (%) | 5 (1.5%) | 45 (13.9%) | <0.001 |
| CF-PWV (m/s) | 6.93±1.29 | 7.4±1.28 | <0.001 |
| AIx (%) | 28.73±10.24 | 24.1±10.41 | <0.001 |
| AP (mmHg) | 9.11 (6.74–12.37) | 7.5 (5.36–10.87) | <0.001 |
| Arterial age (year) | 40 (31–56) | 48 (37–62) | <0.001 |
| C-SBP (mmHg) | 105.16 (98.02–112.87) | 107.34 (101.31–114.35) | <0.001 |
| C-DBP (mmHg) | 72 (77.89–66.96) | 74.11 (69.74–79.79) | <0.001 |
| SBP (mmHg) | 96 (90–104) | 106 (98–114) | <0.001 |
| DBP (mmHg) | 62 (60–70) | 70 (62–76) | <0.001 |
BMI, body mass index; WC, waist circumference; WHtR, waist-to-height ratio; WHR, waist-to-hip ratio; ABSI, A Body Shape Index; BRI, Body Roundness Index; PA, Physical Activity Scores; TG, Triglycerides; FBS, Fasting Blood Glucose; CHO, Total Cholesterol; ALP, Alkaline Phosphatase; GGT, Gamma-Glutamyl Transpeptidase; SGPT, Aspartate transaminase(AST); SGPT, Alanine transaminase(ALT); CF- PWV, carotid femoral pulse wave velocity; AIx, Augmentation index; AP, Augmentation pressure; C-SBP, Central Systolic Blood Pressure; C-DBP, Central Diastolic Blood Pressure; SBP, Brachial Systolic Blood Pressure; DBP, Brachial Diastolic Blood Pressure.
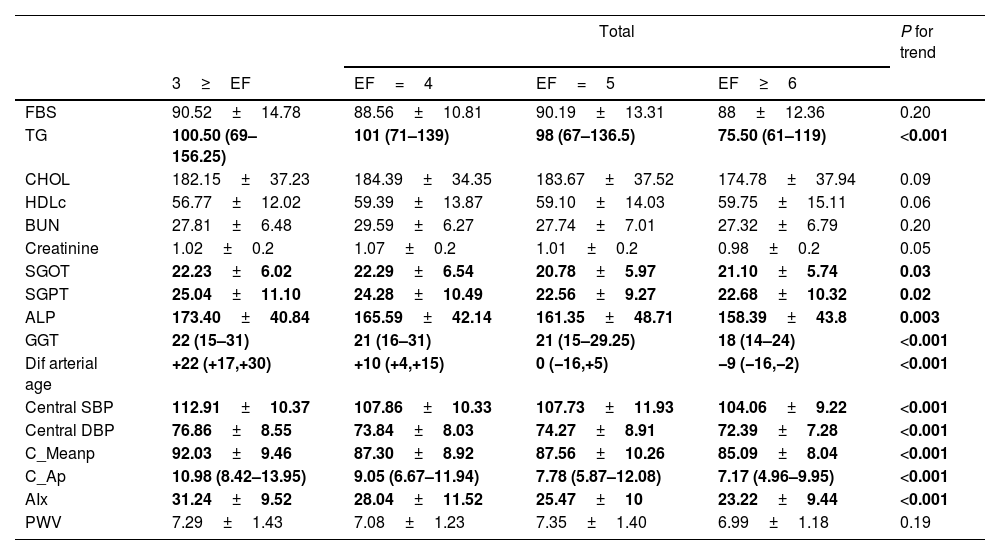
Table 2 shows that there was a significant difference in the comparison of variables of arterial stiffness and central blood pressure in different groups of EF. The incremental trend was significant for all variables (P for trend<0.001) except PWV. For biochemistry tests, lipid profile, and liver enzymes were inversely correlated with the number of meals: those who consumed a larger number of meals had better blood lipid profiles. Liver enzymes (alkaline phosphatase and gamma glutamine transferase) were also significantly lower in subjects with higher EF. The incremental trend was also significant for all variables except blood cholesterol and urea nitrogen.
Biochemistry tests, non-invasive arterial stiffness parameters, and central blood pressure in participants according to their EF: the PERSIAN cohort study (n=658).
| Total | P for trend | ||||
|---|---|---|---|---|---|
| 3≥EF | EF=4 | EF=5 | EF≥6 | ||
| FBS | 90.52±14.78 | 88.56±10.81 | 90.19±13.31 | 88±12.36 | 0.20 |
| TG | 100.50 (69–156.25) | 101 (71–139) | 98 (67–136.5) | 75.50 (61–119) | <0.001 |
| CHOL | 182.15±37.23 | 184.39±34.35 | 183.67±37.52 | 174.78±37.94 | 0.09 |
| HDLc | 56.77±12.02 | 59.39±13.87 | 59.10±14.03 | 59.75±15.11 | 0.06 |
| BUN | 27.81±6.48 | 29.59±6.27 | 27.74±7.01 | 27.32±6.79 | 0.20 |
| Creatinine | 1.02±0.2 | 1.07±0.2 | 1.01±0.2 | 0.98±0.2 | 0.05 |
| SGOT | 22.23±6.02 | 22.29±6.54 | 20.78±5.97 | 21.10±5.74 | 0.03 |
| SGPT | 25.04±11.10 | 24.28±10.49 | 22.56±9.27 | 22.68±10.32 | 0.02 |
| ALP | 173.40±40.84 | 165.59±42.14 | 161.35±48.71 | 158.39±43.8 | 0.003 |
| GGT | 22 (15–31) | 21 (16–31) | 21 (15–29.25) | 18 (14–24) | <0.001 |
| Dif arterial age | +22 (+17,+30) | +10 (+4,+15) | 0 (−16,+5) | −9 (−16,−2) | <0.001 |
| Central SBP | 112.91±10.37 | 107.86±10.33 | 107.73±11.93 | 104.06±9.22 | <0.001 |
| Central DBP | 76.86±8.55 | 73.84±8.03 | 74.27±8.91 | 72.39±7.28 | <0.001 |
| C_Meanp | 92.03±9.46 | 87.30±8.92 | 87.56±10.26 | 85.09±8.04 | <0.001 |
| C_Ap | 10.98 (8.42–13.95) | 9.05 (6.67–11.94) | 7.78 (5.87–12.08) | 7.17 (4.96–9.95) | <0.001 |
| AIx | 31.24±9.52 | 28.04±11.52 | 25.47±10 | 23.22±9.44 | <0.001 |
| PWV | 7.29±1.43 | 7.08±1.23 | 7.35±1.40 | 6.99±1.18 | 0.19 |
EF, eating frequency; TG, triglycerides; FBS, fasting blood glucose; CHO, total cholesterol; ALP, alkaline phosphatase; GGT, gamma-glutamyl transpeptidase; SGPT, aspartate transaminase (AST); SGPT, alanine transaminase (ALT); Dif arterial age, differences between arterial and biological age; CF- PWV, carotid femoral pulse wave velocity; AIx, Augmentation index; AP, Augmentation pressure; C-SBP, central systolic blood pressure; C-DBP, central diastolic blood pressure.
Effect estimates with a p-value <0.05 are indicated in bold.
dif arterial age was calculated by subtracting the chronological age from arterial age (arterial age−chronological age).
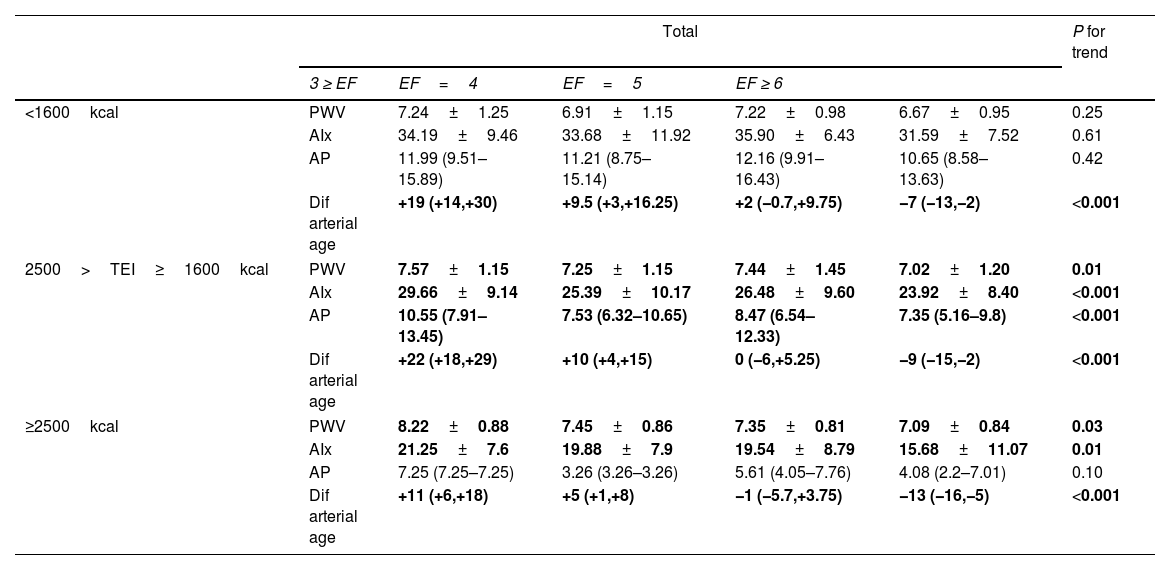
By stratifying the energy intake with arterial stiffness, we reported an inverse correlation between those who consumed 2500>TEI≥1600kcal or ≥2500kcal and arterial stiffness parameters (Table 3, P values<0.05) while participants who had lower total energy intake showed just a meaningful change in arterial age, which decreased significantly with an increasing number of meals.
EF and the non-invasive arterial stiffness parameters by total energy intake level: the PERSIAN cohort study (n=658).
| Total | P for trend | |||||
|---|---|---|---|---|---|---|
| 3 ≥ EF | EF=4 | EF=5 | EF ≥ 6 | |||
| <1600kcal | PWV | 7.24±1.25 | 6.91±1.15 | 7.22±0.98 | 6.67±0.95 | 0.25 |
| AIx | 34.19±9.46 | 33.68±11.92 | 35.90±6.43 | 31.59±7.52 | 0.61 | |
| AP | 11.99 (9.51–15.89) | 11.21 (8.75–15.14) | 12.16 (9.91–16.43) | 10.65 (8.58–13.63) | 0.42 | |
| Dif arterial age | +19 (+14,+30) | +9.5 (+3,+16.25) | +2 (−0.7,+9.75) | −7 (−13,−2) | <0.001 | |
| 2500>TEI≥1600kcal | PWV | 7.57±1.15 | 7.25±1.15 | 7.44±1.45 | 7.02±1.20 | 0.01 |
| AIx | 29.66±9.14 | 25.39±10.17 | 26.48±9.60 | 23.92±8.40 | <0.001 | |
| AP | 10.55 (7.91–13.45) | 7.53 (6.32–10.65) | 8.47 (6.54–12.33) | 7.35 (5.16–9.8) | <0.001 | |
| Dif arterial age | +22 (+18,+29) | +10 (+4,+15) | 0 (−6,+5.25) | −9 (−15,−2) | <0.001 | |
| ≥2500kcal | PWV | 8.22±0.88 | 7.45±0.86 | 7.35±0.81 | 7.09±0.84 | 0.03 |
| AIx | 21.25±7.6 | 19.88±7.9 | 19.54±8.79 | 15.68±11.07 | 0.01 | |
| AP | 7.25 (7.25–7.25) | 3.26 (3.26–3.26) | 5.61 (4.05–7.76) | 4.08 (2.2–7.01) | 0.10 | |
| Dif arterial age | +11 (+6,+18) | +5 (+1,+8) | −1 (−5.7,+3.75) | −13 (−16,−5) | <0.001 | |
EF, eating frequency; Dif arterial age, differences between arterial and biological age; CF-PWV, carotid-femoral pulse wave velocity; AIx, augmentation index; AP, augmentation pressure;
Effect estimates with a p-value <0.05 are indicated in bold.
dif arterial age was calculated by subtracting the chronological age from arterial age(arterial age−chronological age).
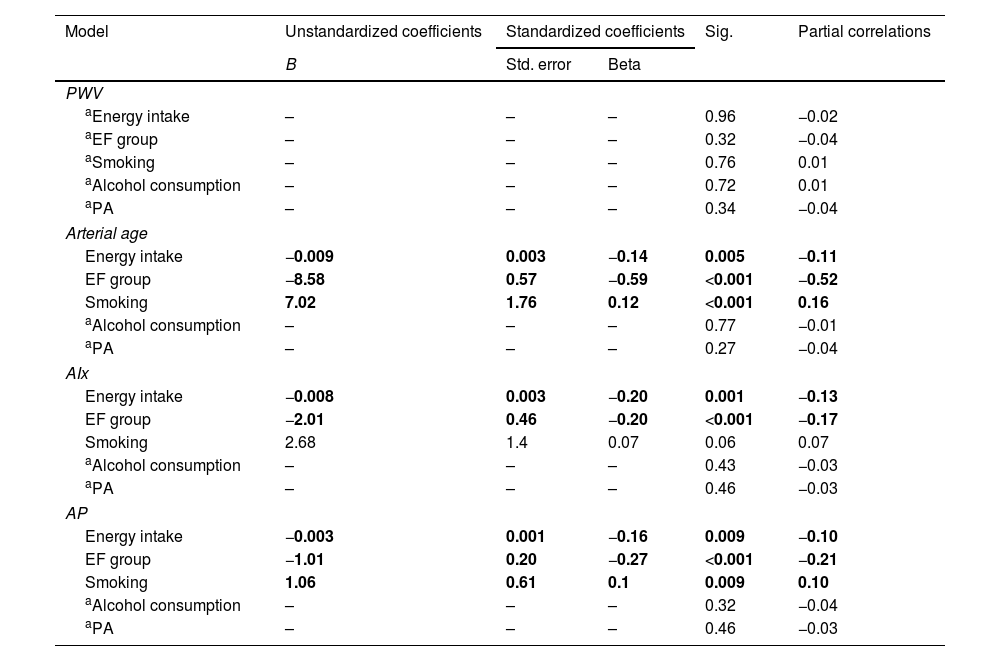
In the linear regression model (Table 4), energy intake was inversely correlated with AIx, AP and arterial age (improvement status by increasing energy). In contrast, when each sex was examined individually, PWV was positively correlated in females (Beta=0.25, sig=0.002, PWV increased by increasing energy). EF was inversely associated with all indices of arterial stiffness except PWV.
Comparison of the association of lifestyle with non-invasive arterial stiffness parameters, after adjustment for age, heart rate, BMI and cardiovascular risk factors.
| Model | Unstandardized coefficients | Standardized coefficients | Sig. | Partial correlations | |
|---|---|---|---|---|---|
| B | Std. error | Beta | |||
| PWV | |||||
| aEnergy intake | – | – | – | 0.96 | −0.02 |
| aEF group | – | – | – | 0.32 | −0.04 |
| aSmoking | – | – | – | 0.76 | 0.01 |
| aAlcohol consumption | – | – | – | 0.72 | 0.01 |
| aPA | – | – | – | 0.34 | −0.04 |
| Arterial age | |||||
| Energy intake | −0.009 | 0.003 | −0.14 | 0.005 | −0.11 |
| EF group | −8.58 | 0.57 | −0.59 | <0.001 | −0.52 |
| Smoking | 7.02 | 1.76 | 0.12 | <0.001 | 0.16 |
| aAlcohol consumption | – | – | – | 0.77 | −0.01 |
| aPA | – | – | – | 0.27 | −0.04 |
| AIx | |||||
| Energy intake | −0.008 | 0.003 | −0.20 | 0.001 | −0.13 |
| EF group | −2.01 | 0.46 | −0.20 | <0.001 | −0.17 |
| Smoking | 2.68 | 1.4 | 0.07 | 0.06 | 0.07 |
| aAlcohol consumption | – | – | – | 0.43 | −0.03 |
| aPA | – | – | – | 0.46 | −0.03 |
| AP | |||||
| Energy intake | −0.003 | 0.001 | −0.16 | 0.009 | −0.10 |
| EF group | −1.01 | 0.20 | −0.27 | <0.001 | −0.21 |
| Smoking | 1.06 | 0.61 | 0.1 | 0.009 | 0.10 |
| aAlcohol consumption | – | – | – | 0.32 | −0.04 |
| aPA | – | – | – | 0.46 | −0.03 |
Linear Regression: Model was adjusted for gender, age, SBP, DBP, heart rate, BMI, FBS, CHOL
EF Group, EF Group; PA, Physical Activity Scores; Dif arterial age, differences between arterial and biological age; CF-PWV, carotid femoral pulse wave velocity; AIx, Augmentation index; AP, Augmentation pressure.
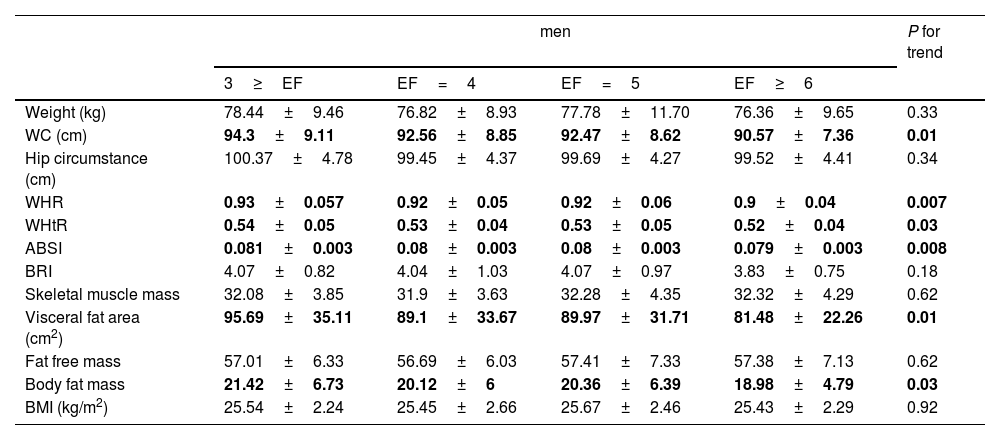
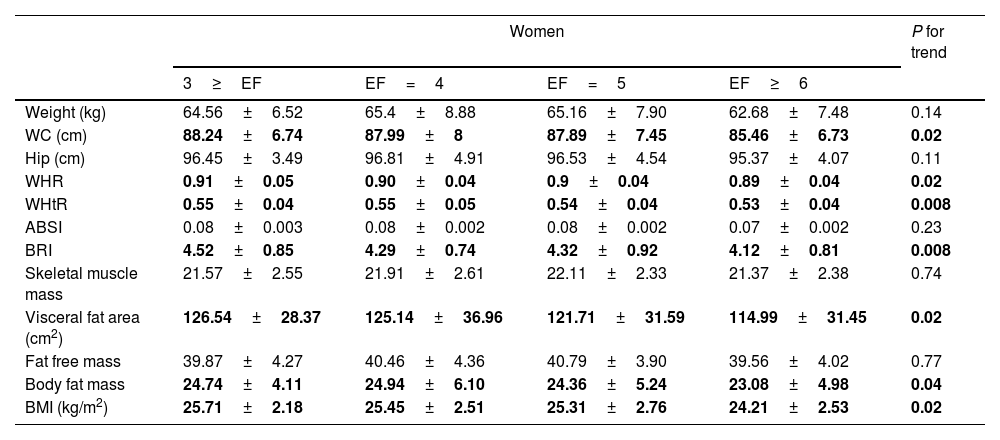
ANOVA tests comparing anthropometric indices and metabolic variables in different groups of EF showed that in both sexes (Tables 5 and 6) for most variables significantly increased with an increasing number of meals. It is observed that with an increasing number of meals, there is a significant decrease in abdominal obesity (WHtR, WHR, and WC), visceral fat surface, and body fat mass.
Anthropometric indices in men participants according to their EF: the PERSIAN Cohort Study (n=658).
| men | P for trend | ||||
|---|---|---|---|---|---|
| 3≥EF | EF=4 | EF=5 | EF≥6 | ||
| Weight (kg) | 78.44±9.46 | 76.82±8.93 | 77.78±11.70 | 76.36±9.65 | 0.33 |
| WC (cm) | 94.3±9.11 | 92.56±8.85 | 92.47±8.62 | 90.57±7.36 | 0.01 |
| Hip circumstance (cm) | 100.37±4.78 | 99.45±4.37 | 99.69±4.27 | 99.52±4.41 | 0.34 |
| WHR | 0.93±0.057 | 0.92±0.05 | 0.92±0.06 | 0.9±0.04 | 0.007 |
| WHtR | 0.54±0.05 | 0.53±0.04 | 0.53±0.05 | 0.52±0.04 | 0.03 |
| ABSI | 0.081±0.003 | 0.08±0.003 | 0.08±0.003 | 0.079±0.003 | 0.008 |
| BRI | 4.07±0.82 | 4.04±1.03 | 4.07±0.97 | 3.83±0.75 | 0.18 |
| Skeletal muscle mass | 32.08±3.85 | 31.9±3.63 | 32.28±4.35 | 32.32±4.29 | 0.62 |
| Visceral fat area (cm2) | 95.69±35.11 | 89.1±33.67 | 89.97±31.71 | 81.48±22.26 | 0.01 |
| Fat free mass | 57.01±6.33 | 56.69±6.03 | 57.41±7.33 | 57.38±7.13 | 0.62 |
| Body fat mass | 21.42±6.73 | 20.12±6 | 20.36±6.39 | 18.98±4.79 | 0.03 |
| BMI (kg/m2) | 25.54±2.24 | 25.45±2.66 | 25.67±2.46 | 25.43±2.29 | 0.92 |
Effect estimates with a p-value <0.05 are indicated in bold.
BMI, body mass index; WC, waist circumference; WHtR, waist-to-height ratio; WHR, waist-to-hip ratio; ABSI, A Body Shape Index; BRI, Body Roundness Index.
Anthropometric indices in women participants according to their EF: the PERSIAN cohort study (n=658).
| Women | P for trend | ||||
|---|---|---|---|---|---|
| 3≥EF | EF=4 | EF=5 | EF≥6 | ||
| Weight (kg) | 64.56±6.52 | 65.4±8.88 | 65.16±7.90 | 62.68±7.48 | 0.14 |
| WC (cm) | 88.24±6.74 | 87.99±8 | 87.89±7.45 | 85.46±6.73 | 0.02 |
| Hip (cm) | 96.45±3.49 | 96.81±4.91 | 96.53±4.54 | 95.37±4.07 | 0.11 |
| WHR | 0.91±0.05 | 0.90±0.04 | 0.9±0.04 | 0.89±0.04 | 0.02 |
| WHtR | 0.55±0.04 | 0.55±0.05 | 0.54±0.04 | 0.53±0.04 | 0.008 |
| ABSI | 0.08±0.003 | 0.08±0.002 | 0.08±0.002 | 0.07±0.002 | 0.23 |
| BRI | 4.52±0.85 | 4.29±0.74 | 4.32±0.92 | 4.12±0.81 | 0.008 |
| Skeletal muscle mass | 21.57±2.55 | 21.91±2.61 | 22.11±2.33 | 21.37±2.38 | 0.74 |
| Visceral fat area (cm2) | 126.54±28.37 | 125.14±36.96 | 121.71±31.59 | 114.99±31.45 | 0.02 |
| Fat free mass | 39.87±4.27 | 40.46±4.36 | 40.79±3.90 | 39.56±4.02 | 0.77 |
| Body fat mass | 24.74±4.11 | 24.94±6.10 | 24.36±5.24 | 23.08±4.98 | 0.04 |
| BMI (kg/m2) | 25.71±2.18 | 25.45±2.51 | 25.31±2.76 | 24.21±2.53 | 0.02 |
Effect estimates with a p-value <0.05 are indicated in bold.
BMI, body mass index; WC, waist circumference; WHtR, waist-to-height ratio; WHR, waist-to-hip ratio; ABSI, A Body Shape Index; BRI, Body Roundness Index.
A comparison of the results of mean arterial stiffness parameters in the number of meal groups in both sexes (Fig. 1) has shown that all parameters except PWV have a decreasing slope as the number of meals increases.
. Participants in each group (EF≤3, EF=4, EF=5 and EF≥6) were 110(16.71%), 186(28.27%), 163(24.78%) and 199(30.24%), respectively. P-value derived using Oneway ANOVA analyses or Kruskal–Wallis Test for comparison mean or median of variables in each group of EF.")
Comparison of mean values of arterial stiffness markers among EF groups (stratified by gender). Participants in each group (EF≤3, EF=4, EF=5 and EF≥6) were 110(16.71%), 186(28.27%), 163(24.78%) and 199(30.24%), respectively. P-value derived using Oneway ANOVA analyses or Kruskal–Wallis Test for comparison mean or median of variables in each group of EF.
In our study, the mean AIx in subjects with EF≤3 per day was about 25% higher compared to those with EF≥6. Considering that every 10% increase in cAIx was associated with an increase of 1.48-fold in cardiovascular mortality risk,26 we can expect that an increase of 30% of AIx may be related to increasing a 3.8-fold in cardiovascular mortality. Besides, arterial age, on average, was also higher (for about 30 years) in subjects with EF≤3, compared to those with EF≥6.
EF reflects the distribution of daily food intake, energy intake, and regular intake of nutrients in one or more meals. We have shown a significant inverse relationship between increased EF with abdominal obesity indices (WC, WHtR, and WHR), BMI, and visceral fat area in both sexes. However, previous studies have reported mixed results. Several studies have demonstrated an inverse relationship between EF and obesity.27,28 As Wang et al. In a meta-analysis study in 2016, reported that adults with higher EF had 17% lower probabilities of getting overweight and obese.29 In another study, Kim et al. in an adult Korean population have revealed that when diet quality is high, EF is inversely associated with obesity indicators.30 Zhu et al. suggested that adults with a higher EF in the USA had a healthier diet with lower energy density and better diet quality, and EF was inversely associated with body weight status.31 In contrast, a cross-sectional study of British adults showed positive associations of EF with BMI and WC,32 and some clinical trials, despite limitations (small sample size and insufficient follow-up time) found no association between weight loss and EF.33,34
The mechanisms underlying this inverse relationship are not fully clarified. It has been suggested that increased daily eating frequency, by a decrease in fasting intervals, might lead to higher thermogenesis, the decline means blood glucose concentrations and insulin secretion, which altogether would make higher insulin sensitivity.17,35,36 Moreover, higher EF is associated with better diet quality and lower energy density.31,37 According to the Healthy Eating Index (HEI), high quality of diet requires 30% or less energy intake (EI) of fat, limiting calories from saturated fats to less than 10% and lower protein intake.38 High EF is associated with low EI from fat and protein but high EI from carbohydrates due to the increased consumption of healthy-ingredient snacks like fruits.39–41 On the other hand, available data show that the Small, frequent meals per day may lead to improved lipid profiles, less insulin resistance, reduced lipogenesis and a lower risk of metabolic syndrome.16–18
Similarly, as the number of meals increased, we also saw an improvement in the lipid profile. Besides, we observed an inverse association of liver cell integrity markers (AST and ALT) and cholestasis parameters (GGT and ALP) with EF. Thus, it may be of particular value to separate large amounts of food consumed in a meal into more Eating frequencies.
The innovative finding of the present study was that high EF was associated with a fall in BP, wave reflections in the overall population and by subgroup analysis at three different levels of the total energy consumed.
In the regression model, we also observed that EF and EI were inversely associated with Arterial age, cAIx and AP in both sexes. On the other hand, EI had a positive relationship with PWV in men. On the other hand, EI had a positive relationship with PWV in men. A recent study found that in apparently healthy adults, intima-media thickness (IMT) differed as a function of EF by a greater degree for those who had higher EI.7 In another study, the benefits of higher EF on cardiovascular mortality risk appeared to be greater in people who had reported higher EI (≥2500kcal) than among those who had reported lower EI.42
However, it is often difficult to determine if a high daily EF in itself has beneficial health effects, because dietary behaviours in the real world are much more complicated, and people should monitor the quantity and quality of each meal. Increasing the frequency of meals with high-energy foods results in more energy consumption, which can have a negative impact on health through increased calorie intake, energy imbalance, and, eventually obesity.42 Calorie intake is a significant health factor. Low energy and excessive energy consumption indicate various forms of malnutrition that lead to undesirable changes in body composition, body function, and premature mortality.43,44 The exact amount of calories needed for optimal health and performance varies by individual, depending on their genetic history, age, energy intake, and diet composition. Also, the amount of calories needed to slow down the ageing process is unclear.44
However, existing data support the notion that calorie restriction with adequate human nutrient intake causes many metabolic adaptions and reduces the risk of multiple chronic diseases.45 However, any amount of calorie restriction can be disadvantageous to specific populations, e.g. lean people, who have minimal body fat storage capacity. For example, it has been suggested that in people with lean body mass, there is no beneficial effect of calorie restriction on life expectancy can be expected. Nevertheless, for overweight or obese people, a decrease in excessive food intake can be partially beneficial.46
In this study, we did not observe a significant sex difference in arterial stiffness markers regarding EF. However, female participants had a higher difference between central and peripheral BP than males. Also, AP and, consequently, AIx were higher in women (Table 1 and Fig. 1). The higher AIx in women compared to men might be a possible explanation for the difference between central and peripheral BP. Age as a primary predictor of increasing AIx, but body height and heart rate also may have contributed.47,48 Nevertheless, overall, PWV was higher in men.
A major limitation of this study is the cross-sectional design, as we cannot draw conclusions in terms of causal relationships and cannot provide information about changes in cfPWV over time. Another disadvantage might be choosing a healthy population based on strict criteria for exclusion of those with risk factors, as it is expected that older adults were more affected by prohibitions. Also, because of inaccessibility and inadequate collaboration, only a 24-h dietary recall had been taken.
Our study has multiple strengths. First, an illustrated food model booklet and clear instructions, which assist in estimating specific quantities of consumed foods and beverages. Second, the level of dietary consciousness and desire for weight change may severely bias reported food intake in dietary reports. Therefore we used the Goldberg and Black et al. cutoff for the assessment of under- and over-reporting.22,23 Third, strict criteria to attain healthy participants as being strengths of our analyses and support the reliability of our reference values for cfPWV. Fourth, use the gold-standard method to evaluate arterial stiffness and estimate resting metabolic rate.
ConclusionsIn conclusion, the main findings of this research include: 1-Increased EF was associated with a lower incidence of manifestations of arterial stiffness in central arteries in healthy subjects. 2-There was a significant inverse relationship between EF and the measures of abdominal adiposity in both genders. 3-Increased EF correlated with a better lipid profile and biochemical liver function tests. However, clinical research is required to confirm these results and public health recommendations should be cautious, as higher EF is associated with total energy intake, which could promote weight gain.
FundingIran Ministry of Health and Medical Education and Mashhad University of Medical Sciences.
Conflict of interestThe authors declare that they have no conflict of interest.
This study was supported by the Iran Ministry of Health and Medical Education and Mashhad University of Medical Sciences as part of the “Persian cohort” research project.