


Ischemic diseases are the second leading cause of death in Mexico and account for over 30% of deaths worldwide. Atherosclerosis, in particular, obstructs arteries and impairs blood circulation, contributing to increased mortality and reduced quality of life.
ObjectiveIn this study, adhesion energies and their influence on the structural arrangement of an atheroma were determined.
MethodologyAdhesion energies were measured for each main component of the atheroma, including arteries and plaque components such as cholesterol, calcium, collagen, glucose, and elastin. The relationship between adhesion and atheroma formation is demonstrated, highlighting the significant interaction of adhesion energies between fibrinogen and cholesterol. Numerical results showed that fibrinogen and cholesterol have the highest adhesion energy, followed by collagen-glucose and cholesterol-elastin combinations.
ResultsAdditionally, interactions with the highest adhesion energy, such as Fib-Fib with an energy value of 9.60x10⁻⁵J/m2, CML-GB with a value of 2.76x10⁻⁹J/m2, along with LDL-LDL with an adhesion value of 6.35x10⁻⁵J/m2 and Elas-LDL with a J value of 3.40x10⁻⁵J/m2, influence the atheroma structure formation.
ConclusionsThese results demonstrate the association between adhesion energy in forming an atheroma that obstructs arteries, reduces blood flow, and the pathology of thrombus formation.
Las enfermedades isquémicas son la segunda causa principal de muerte en México y representan más del 30% de los fallecimientos a nivel mundial. En particular la aterosclerosis que obstruye arterias y deteriora la circulación sanguínea, contribuyendo a un aumento de la mortalidad y una disminución en la calidad de vida.
ObjetivoEn este trabajo se comprobaron las energías de adhesión y su influencia en el acomodo estructural de un ateroma.
MetodologíaSe determinaron las energías de adhesión de cada uno de los componentes principales del ateroma, como las energías de adhesión en arterias y componentes de placas tales como: colesterol, calcio, colágeno, glucosa y elastina. Se muestra la relación entre adhesión y formación del ateroma, resaltando la significativa interacción de las energías de adhesión entre el fibrinógeno y el colesterol. Los resultados numéricos mostraron como que el fibrinógeno y el colesterol tienen una energía de adhesión superior, seguido por combinaciones de colágeno con glucosa y colesterol con elastina.
ResultadosTambién que las interacciones con mayor energía de adhesión, como Fib-Fib un valor de energía 9.60x10⁻⁵J/m2, CML-GB con un valor de 2.76x10⁻⁹J/m2, junto con LDL-LDL el valor de adhesión 6.35x10⁻⁵J/m2 y Elas-LDL valor de J de 3.40x10⁻⁵J/m2 influyen en la formación de la estructura del ateroma.
ConclusionesEstos resultados demuestran la asociación existente entre la energía de adhesión para formar un ateroma que obstruye las arterias y disminuye el flujo de sangre y la patología de la formación de trombos.

Diseases caused by atheroma obstruct blood flow and increase mortality rates. According to the INEGI, heart disease was the leading cause of death in Mexico from January to June 2023, with 97,187 cases recorded.1 This research study aims to analyse the relationship between molecular adhesion energies2 in the formation of atheroma and arterial obstruction and thrombus generation. The mechanical properties of atherosclerotic tissue were evaluated in order to gain insight into plaque and clot formation.3 Additionally, the correlation between cholesterol deposition in the arteries and thrombotic diseases such as heart attacks, embolisms, and strokes was investigated. The physical properties of atheroma elements were also studied, and the use of Hamaker and van der Waals theory was explored to model electrostatic interactions and obtain parameters of materials.4 The aim of this research study is to enhance our understanding of the physical and molecular mechanisms underlying thrombus formation and its association with cardiovascular diseases.5
The adhesion of blood elements plays a role in thrombus formation, contributing to haemostasis and, under certain conditions, to the pathogenesis of thrombotic diseases. Wagner et al. in 2013 described that red blood cells can form aggregates known as rouleaux, a coin-stack-like arrangement that is reversible and influenced by plasma proteins such as fibrinogen. This phenomenon is common in normal and pathological conditions.6 In certain diseases, such as Plasmodium falciparum malaria, Vásquez and Tobón in 2012 reported that parasitised red blood cells adhere to endothelial cells, which may contribute to thrombus formation.7 Deep vein thrombosis (DVT) is characterised by the formation of clots in the deep veins, often in the lower limbs. According to a supplement published in 2018 by the Mexican Social Security Institute (IMSS), erythrocytes may contribute to thrombus formation through their aggregation and adhesion to the vascular endothelium.8 Eryptosis is a process of programmed cell death in blood cells that can be induced by various stimuli. Manzur et al. in 2015 mentioned that blood cells and cells undergoing eryptosis could increase thrombin generation in plasma and promote its adhesion to endothelial cells, contributing to thrombus formation.9 Haemorheology refers to the rheological properties of blood, such as viscosity and erythrocyte deformability, which influence thrombus formation. In 2020, Feldman et al. mentioned that some alterations in these properties can increase erythrocyte aggregation and the adhesion of elements to the arteries.10 Understanding these biological processes is essential for the development of diagnostics and therapies aimed at preventing and treating thrombotic diseases.
The notable advantages of this research include the analysis of the correlation between blood element adhesion and thrombus formation, which offers multiple benefits in biomedical research and clinical practice. These include early detection of clot-related diseases, development of new therapeutic strategies improving differential diagnoses between different types of coagulopathies, greater understanding of haematological and vascular diseases, as well as applications in personalised medicine, allowing therapies to be tailored to the patient's profile of erythrocyte adhesion, and greater advances in medical devices. This would improve the design of biomaterials and devices such as stents, heart valves, and vena cava filters to reduce thrombus formation. In general, the analysis of blood element adhesion and its relationship with thrombus formation has great potential to optimise the diagnosis, treatment, and prevention of thrombotic and cardiovascular diseases.
When interpreting the results, some limitations of the analysis of the correlation between blood component adhesion and thrombus formation should be considered. These include the formation of thrombi, which is a multifactorial process involving platelets, coagulation factors, endothelial cells, and components of the immune system. Individual factors such as age, sex, inflammatory status and plasma composition can influence adhesion, making it difficult to standardise results and evaluation techniques. While various methodologies exist, such as microscopy, flow cytometry, and rheometry, there is no consensus as to which is most appropriate for each research context. Interference from medical treatments such as anticoagulants, antiplatelet agents, and other drugs that can modify the adhesion of blood elements, altering the correlation between adhesion and clots, constitute another factor. There is also limited implementation in clinical practice: despite the scientific evidence, adhesion analysis has not yet been widely adopted as a diagnostic tool. While adhesion analysis shows promise as a tool, caution should be exercised in research to avoid misinterpretation or incomplete conclusions.
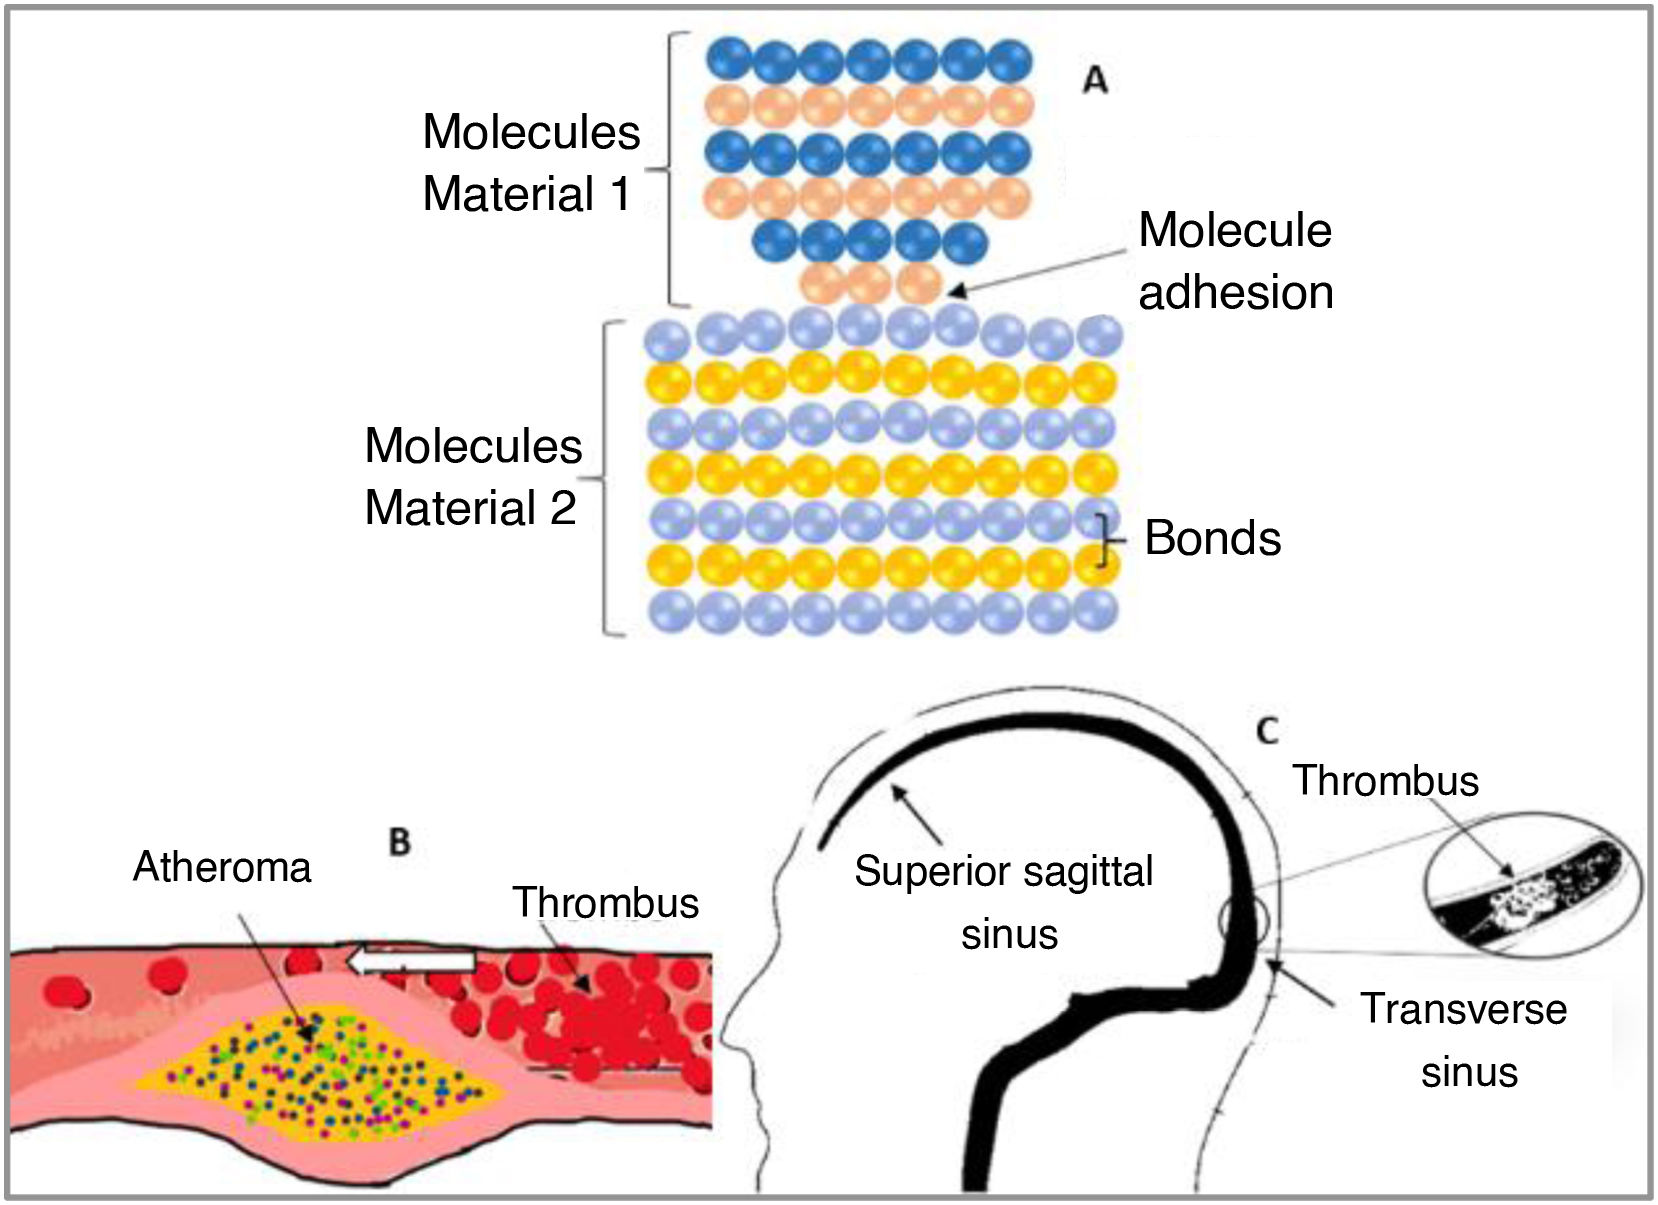
Research methodologyThe surface energy of materials in contact is key to molecular adhesion, which is defined as twice the surface energy of the material2 (2·Se). Adhesion is influenced by van der Waals forces, particularly in interactions between spherical particles, the calculation of which depends on their diameters and the distance between them. These include London-van der Waals forces,11 which generate attraction and are used to estimate Hamaker constants in organic and inorganic systems, facilitating data results for solids and liquids, as shown in Fig. 1A). Adhesion energy allows molecules to bind to a surface and is described as the amount of surface energy (J/m2).12,13 This analysis can therefore be applied to atheroma, since when molecules bind to substances such as cholesterol, elastin, or fibrin, or to cells such as platelets, red blood cells, etc., they obstruct blood flow within the arteries.5 These elements become trapped, causing ischaemia in the tissues and triggering the formation of clots. Following the model described in Israelachvili's book Intermolecular and Surface Forces,2,11 the molecules were analysed as spheres to calculate adhesion by evaluating the energy mechanisms involved in these molecular processes. This research focuses on molecular adhesion considering the interaction of molecules and their adhesion bonds. Although there are interactions between more than two elements, only pair interactions were analysed. According to Guenthera and Arauz,14 a thrombus that breaks off can travel to various parts of the body, such as the brain, heart, or lungs, causing serious conditions such as cerebral venous thrombosis (CVT). Diagnosis and treatment of CVT present challenges due to its clinical variability.14Fig. 1B) shows how cholesterol accumulates in the intima of the artery, forming an atheroma that obstructs it and causes a decrease in blood flow. This leads to elements sticking together and the formation of a thrombus. Fig. 1C) illustrates how, over time, the thrombus can break off and travel through the bloodstream, towards the head as described.
A) Molecular interaction system: this bond of molecules adheres based on the distances between their adhesion bonds. As the distance decreases, the orange molecules bond to the blue molecules to form a new set of molecules. Source: image based on Israelachvili.2 B) Atheroma obstructing the artery, decreasing blood flow, and causing a thrombus. C) Sagittal projection showing the absence of filling of the superior sagittal sinus (SSS) and transverse sinus (ST) along its entire length corresponding to CVT (arrows). Source: image based on Guenther and Arauz.14
Adherent bonds are mechanical connections that hold neighbouring cells together involving adhesion energies measured in microjoules and picojoules. Atheroma contains various cells and molecules, including endothelial cells, fibrinogen, white blood cells, fibroblasts, platelets, collagen, elastin, smooth muscle cells, LDL-C, macrophages, and glucose. This is as described by Israelachvili2 in his studies on adhesion molecules. It can be said that the adhesion between these bodily elements is key to the development of thrombi. Studies by García Fernández et al.15 suggest that mobile thrombi in transit, with an elongated, snake-like appearance, are rare findings. These thrombi typically migrate from the deep venous system, and are shaped by the venous ducts due to obstruction caused by cholesterol plaques. Although these patients had no history of deep vein disease, cholesterol accumulation was a determining factor in thrombus formation.15 These applications are useful in specialised anticoagulation units, but do not offer significant positive results at the general clinical level, which limits their comparison with standard studies.16,18 Venous thromboembolic disease (VTD) is an important manifestation of these cardiovascular complications, comparable in severity to myocardial infarction (MI) and cerebrovascular disease (CVD). Although VTD is common, it is often underdiagnosed, increasing the risk of pulmonary embolism (PE), a potentially fatal complication. Furthermore, it is the third leading cause of in-hospital death after MI and CVD. Population studies indicate that the incidence of VTD is .2% per year, doubling every 10 years in age to reach 11% at age 80.17
Analysing adhesion energy in thrombus formation is crucial for understanding the mechanisms underlying thrombosis and for designing therapeutic strategies. This requires a methodology that integrates experimental techniques and computational modelling in order to quantify the adhesion of platelets and other blood components under different physiological and pathological conditions. Several important concepts must be considered when analysing adhesion energy. These include molecular adhesion, referring to the interaction between biomolecules and surfaces or receptors, and cell adhesion, whereby cells adhere to other cells through adhesion molecules. Molecular interactions in adhesion are influenced by different forces, such as van der Waals forces, which are weak interactions between polar and non-polar molecules, and hydrogen bonds, which correspond to the specific bond between molecules with hydrogen and electronegative atoms. Covalent bonds are also relevant, as they represent a strong adhesion between molecules or cells. The physical-chemical properties of the cell area, such as roughness and topography, are also fundamental, as rough surfaces increase adhesion by increasing the contact area. Additionally, surface energy relates to the ability of a cell or molecule to adhere to a material. Mathematical and statistical models applied to the study of adhesion also include adhesion kinetics equations, as well as the Hamaker11 and van der Waals2 analyses, in addition to the generation of obstruction of arteries that form thrombi, since these concepts make it possible to determine adhesion and separation rates in dynamic studies.
This research study aims to analyse the adhesion of molecules and cells to a surface under different conditions, and to determine its relationship with thrombosis. In designing the methodology, the study variables were considered and the adhesion energy, measured in pJ or nJ, as well as the molecular interactions and the stability of the adhesion over time, were identified as dependent variables. The independent variables in the analysis include the type of molecule or cell and specific interactions, which may be mediated by the centre-to-centre distance of the molecule or cell and the Hamaker energy.11 This research study employs a block design, since different types of elements, such as cells and molecules, were analysed in order to minimise the influence of uncontrolled variables and obtain the relationship with thrombosis. While this research study addressed the probabilistic calculation of adhesion energy, there are other methods for evaluating it. These include atomic force microscopy, which measures molecular adhesion force at the nanometre level; surface plasmon resonance spectroscopy, which enables real-time analysis of molecular adhesion kinetics; and confocal and fluorescence microscopy techniques, which are used to visualise and quantify adhered cells. Furthermore, no statistical analysis has been performed in relation to the results presented on molecular adhesion and its relationship with thrombosis, such as in this research study.
DevelopmentAdhesion is a key physical-chemical phenomenon in numerous industrial and biological processes. Mittal, in his book published in 2011, mentioned that, in the case of elements and molecules, the energy of adhesion is influenced by intermolecular interactions, chemical composition, and some external factors such as temperature and humidity.19
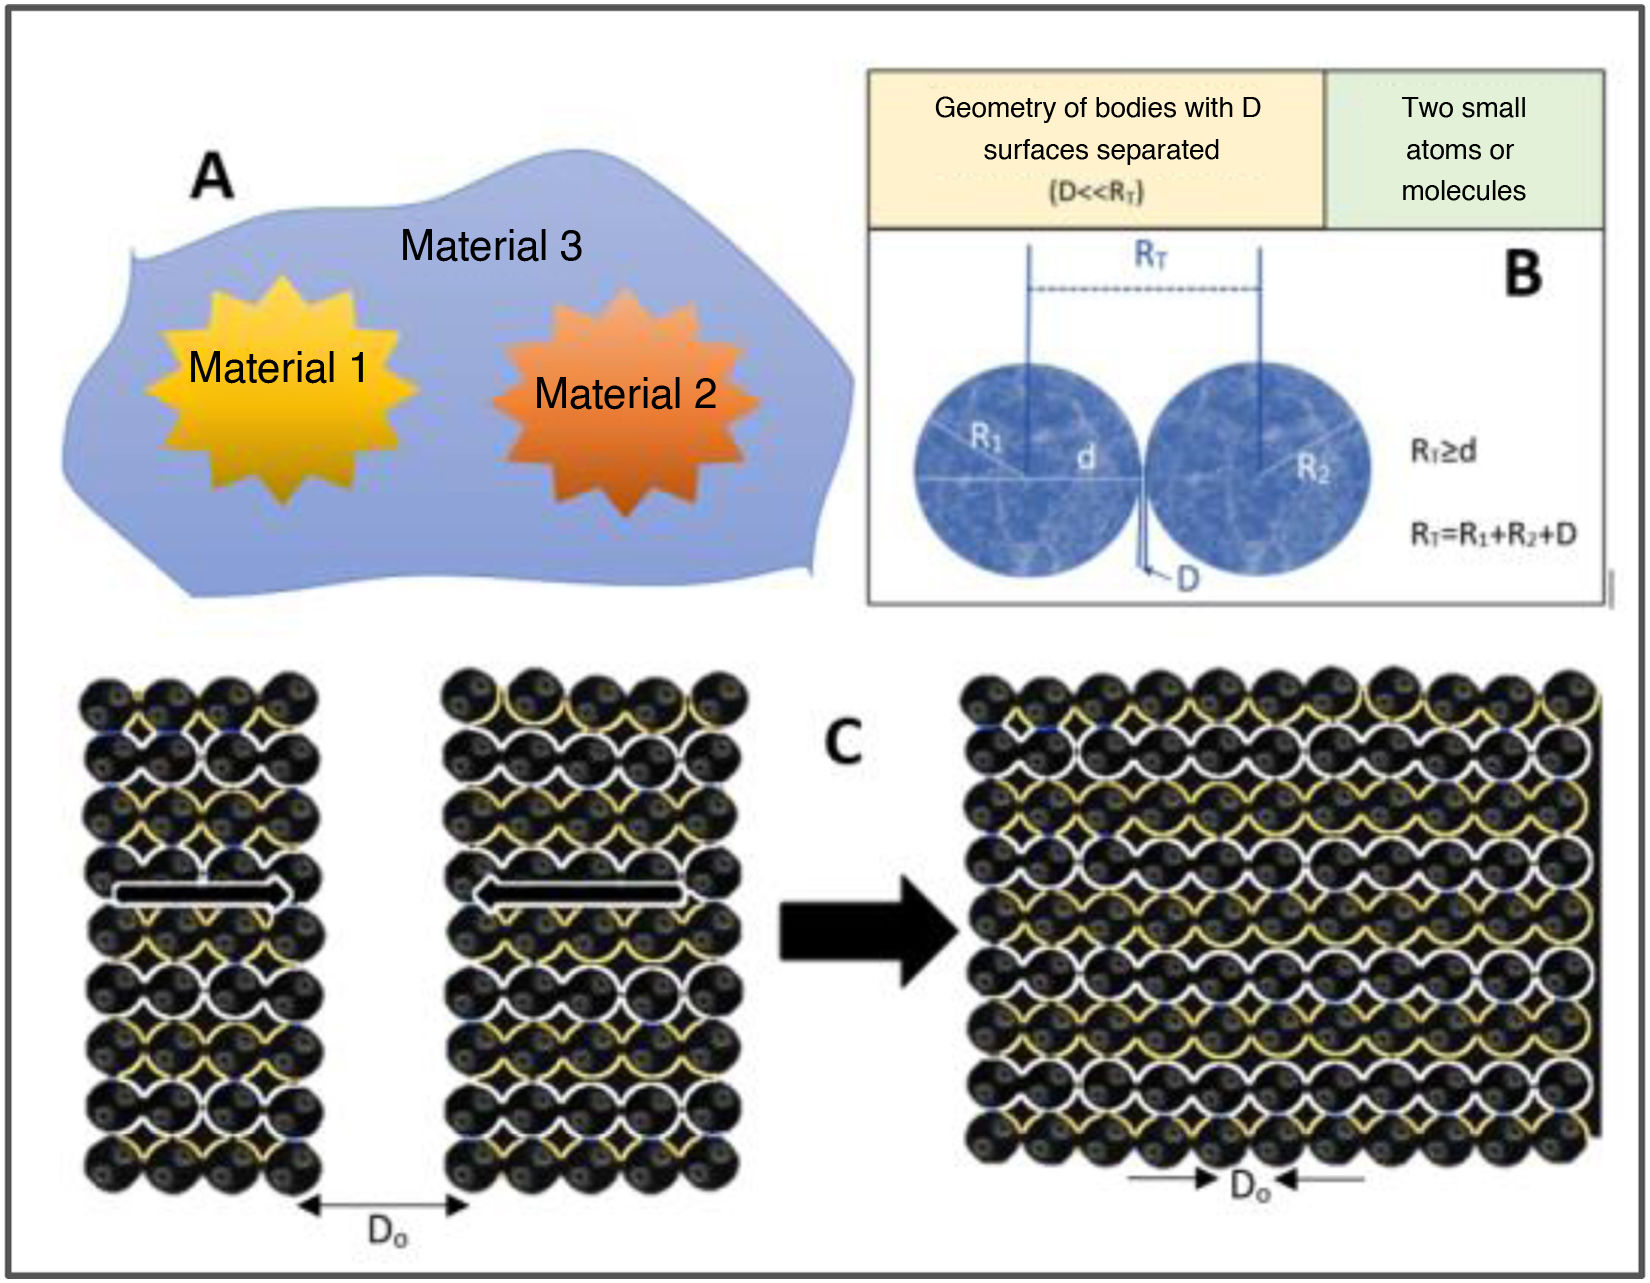
The Hamaker constant is defined as a van Der Waals body-body interaction, as shown in Eq. 1. Hamaker combinations are specific to each interaction since each element has particular properties and configurations. According to Butt and Kappl20 all these interactions follow the same fundamental principle of adhesion. To select the first case, it is necessary to perform an analysis of the elements. Hamaker depends on the optical properties and geometry of the interacting bodies. Positive represents repulsion and negative represents intermolecular attraction. The resulting force is always attractive between similar molecules or materials. If the Hamaker constant of material 1 and interaction material 311,20 is known, the case is A131 where A131≈A11-A332, if the Hamaker constant of material 2 is known, and it has very similar properties that are almost equal to material 1, then the 2 materials interact but through the same medium 3, the case20 is A132 where A132≈A131A232, whose physical properties are very similar, now when there is interaction between material 1 and material 2, different through medium 3, then the Hamaker constant is described20 as Eq. 1 which is A132. The calculation of the Hamaker constant using the above approximations depends on the arrangement of the materials and the area where the adhesion needs to be known, A represents any material and the subscript indicates the order number of the material.11Fig. 2A) shows the arrangement for determining the Hamaker constant in the interaction according to the corresponding case of case A132. The interaction between elements of any material can be analysed as illustrated in Fig. 2B). In this representation, it is established that, when working with scales of the order of molecules or atoms, it is feasible to apply a simplified approach that considers these interactions as if they were spheres.2,20 Therefore, the adhesion of molecules, as shown in Fig. 2C), can be described in terms of the surface energy γ of a material. This quantity corresponds to half the energy required to join two contact surfaces, since the surface energy of a material20 is equal to 2γ.
A) Representation of the interaction between the molecules of the material and the medium, materials 1 and 2 being separated by a material 3. Source: image based on Bergstrom.4 B) Potential interaction between microbodies, whether molecules or atoms. This geometry is based on the diameter being smaller than the distance separating them. Source: image based on Hamaker,11 and Butt and Kappl.20 C) Representation of a microscopic system composed of n number of molecules, where if 2 systems separated by a distance Do reduce their distance, if their adhesion energy, Eadh, increases, they bond to form a single system of molecules. Source: image based on Butt and Kappl.20
In 1987, Kinloch mentioned that there are several mechanisms by which materials and molecules can adhere to either the same or a different material. An example is mechanical adhesion, which occurs when a rough surface allows another substance to physically anchor itself to it.21 Pocius, in his 2012 book, described chemical adhesion as involving the formation of covalent or ionic bonds between materials that are in contact.22 According to Israelachvili (2011), van der Waals interactions are intermolecular forces that can facilitate adhesion without the need for strong chemical bonds.2 In 2002, Dillard and Pocius described hydrogen bonds as bonds that form between polar functional groups.23
In cases where two materials with different properties are present within a medium, according to Butt and Kappl, this can be expressed using Eq. 1:
The analysis of adhesion energies at the atomic or molecular level has a dipole-dipole that could be governed by van Der Waals. If both dipoles are charged, it is Keesom; if one dipole is charged and the other is induced, it is Debye; and if both dipoles are induced, it is London. This is how the van Der Waals configuration is formulated: VDW=Keesom+Debye+London, which results in (Cvdwr6) the value of r6 is due to the distance between one particle and another, and the value of 6 is due to the moments of movement experienced by the particle. This representation is relevant when the distance is equal to or greater than the diameter of the particles. Molecules are grouped together under the influence of surface energy. Eq. 2, according to Israelachvili,2 explains that the adhesion energy of intermolecular interactions and forces on the surface of a material is:
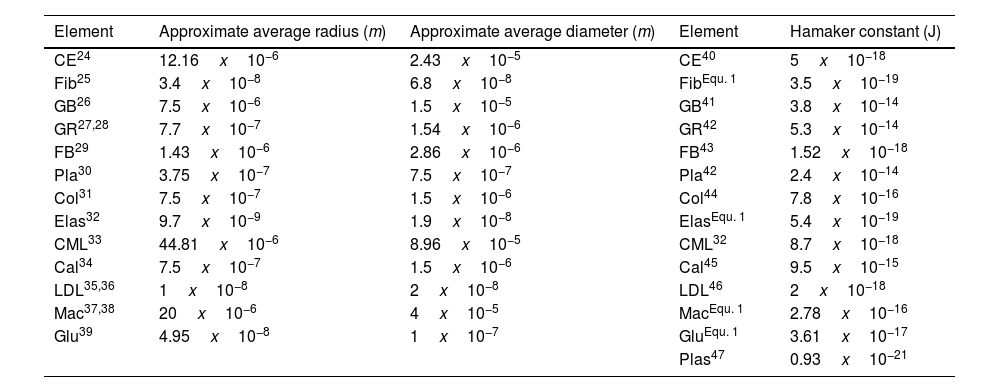
Where: Eadh represents the energy required to bond two surfaces, AH is the Hamaker constant, and D0 is the equilibrium distance or minimum distance of attraction between the particles that form the bond of the materials, as mentioned in the work of Butt and Kappl.20 The adhesion energy required to join molecular surfaces is divided into two components: physical and chemical. Physical energy comes from the forces of weak electrostatic interactions between molecules, but their accumulation generates significant adhesion. These forces depend on molecular polarity and electron distribution.2 On the other hand, chemical energy arises from the formation of chemical bonds, being greater in polar molecules and with dipole-dipole interactions. Rough surfaces increase the adhesion energy compared to smooth ones, affecting the interaction between molecules. In biology, this adhesion is relevant for cell and tissue bonding, making it easy to understand these mechanisms for the development of technologies in areas such as biomedicine.21 In this study, the elements of atheroma were modelled as spheres, and the Hamaker constants specific to each atheroma material obstructing the artery were calculated. It should be noted that many venous thrombi initially show no obvious symptoms, probably because they do not completely obstruct the artery, allowing low blood circulation. For this research study, the elements of the atheroma were considered as spheres, with values from Table 1, which presents approximate dimensions of the elements based on their volume. The Hamaker constants11 of the elements present in the atheroma are also detailed in Table 1. It is important to remember that constants are specific to each material and medium, as shown in Fig. 2A), in which they interact. The values were obtained from sources in the literature, however, in some cases the Hamaker constants were calculated using Eq. 1.Radii, approximate diameters and Hamaker constants of the main elements that form the atheroma plaque.
| Element | Approximate average radius (m) | Approximate average diameter (m) | Element | Hamaker constant (J) |
|---|---|---|---|---|
| CE24 | 12.16x10⁻⁶ | 2.43x10⁻⁵ | CE40 | 5x10⁻¹⁸ |
| Fib25 | 3.4x10⁻⁸ | 6.8x10⁻⁸ | FibEqu. 1 | 3.5x10⁻¹⁹ |
| GB26 | 7.5x10⁻⁶ | 1.5x10⁻⁵ | GB41 | 3.8x10⁻¹⁴ |
| GR27,28 | 7.7x10⁻⁷ | 1.54x10⁻⁶ | GR42 | 5.3x10⁻¹⁴ |
| FB29 | 1.43x10⁻⁶ | 2.86x10⁻⁶ | FB43 | 1.52x10⁻¹⁸ |
| Pla30 | 3.75x10⁻⁷ | 7.5x10⁻⁷ | Pla42 | 2.4x10⁻¹⁴ |
| Col31 | 7.5x10⁻⁷ | 1.5x10⁻⁶ | Col44 | 7.8x10⁻¹⁶ |
| Elas32 | 9.7x10⁻⁹ | 1.9x10⁻⁸ | ElasEqu. 1 | 5.4x10⁻¹⁹ |
| CML33 | 44.81x10⁻⁶ | 8.96x10⁻⁵ | CML32 | 8.7x10⁻¹⁸ |
| Cal34 | 7.5x10⁻⁷ | 1.5x10⁻⁶ | Cal45 | 9.5x10⁻¹⁵ |
| LDL35,36 | 1x10⁻⁸ | 2x10⁻⁸ | LDL46 | 2x10⁻¹⁸ |
| Mac37,38 | 20x10−6 | 4x10⁻⁵ | MacEqu. 1 | 2.78x10⁻¹⁶ |
| Glu39 | 4.95x10⁻⁸ | 1x10⁻⁷ | GluEqu. 1 | 3.61x10⁻¹⁷ |
| Plas47 | 0.93x10⁻²¹ |
Source: elaborated by the authors.
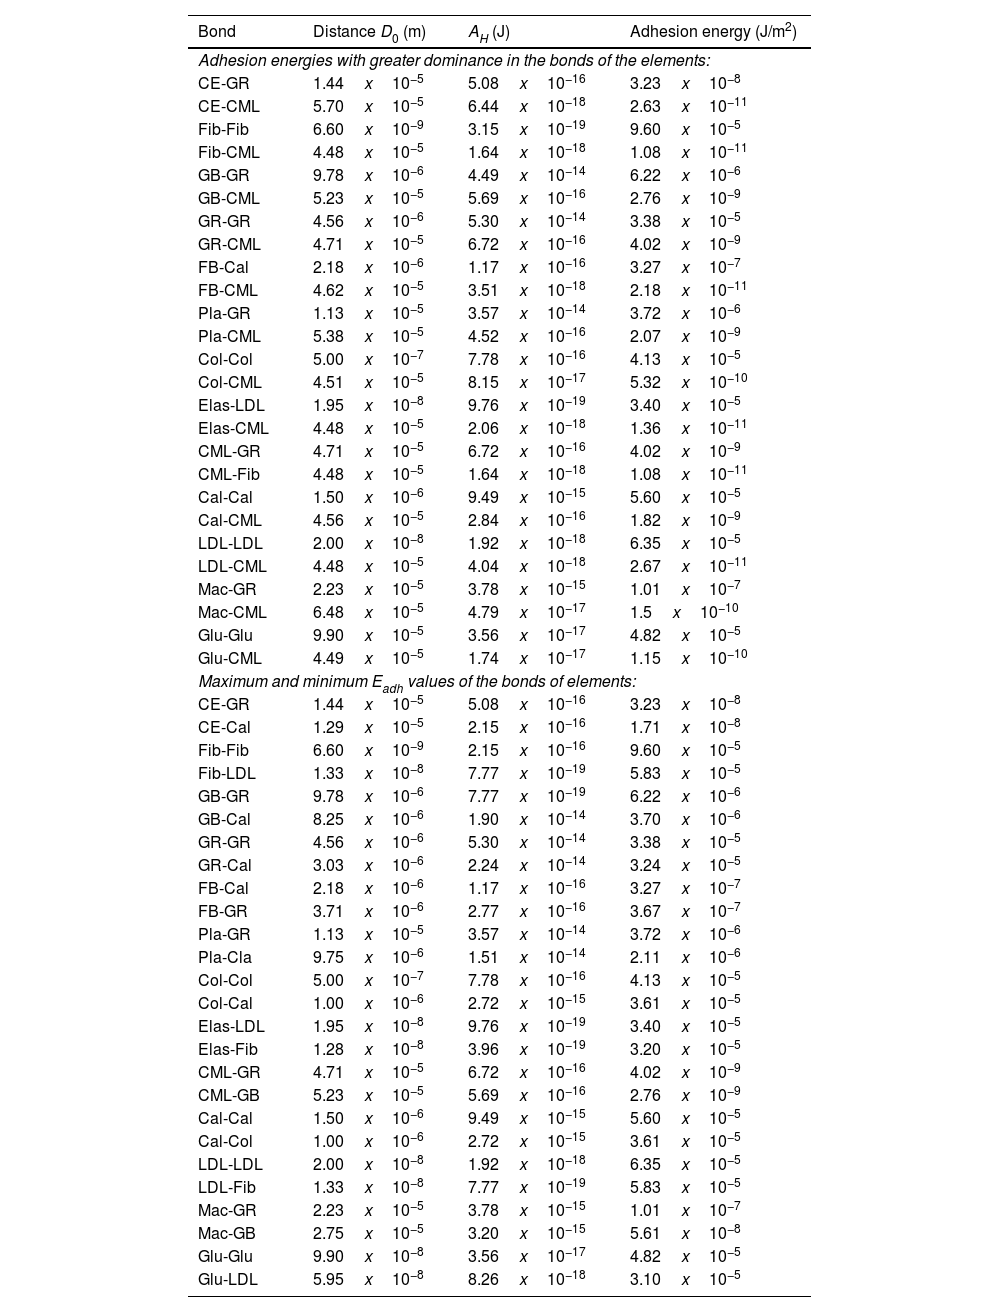
In patients with DVT in the lower extremities, fewer than a third exhibit typical symptoms such as pain, oedema, and venous distension. When these symptoms are evaluated in isolation, DVT is confirmed by objective methods in fewer than half of cases.48 Thrombi are primarily formed by red blood cells, thrombin, and collagen, and typically appear in arteries narrowed by cholesterol plaques. Due to low medical awareness, few patients receive timely treatment, with echocardiographic detection in only 10%–18% of cases.15 Mobile thrombi in the right atrium are a critical medical emergency, where any delay in treatment can be fatal. The computational and graphical analyses presented in this research study were performed using numerical systems to ensure accurate results. The results shown in Table 2 were derived from Eq. 2, and show multiple interactions occurring for each pair of elements. Similarly, Table 2 shows the two most relevant bonds of each element in the interactions. These were analysed to determine the pair of molecules with the highest and lowest adhesion energy interaction.
Adhesion energies with greater dominance and maximum and minimum values of adhesion energies in the bonds of the main elements that form the atheroma plaque.
| Bond | Distance D0 (m) | AH (J) | Adhesion energy (J/m2) |
|---|---|---|---|
| Adhesion energies with greater dominance in the bonds of the elements: | |||
| CE-GR | 1.44x10⁻⁵ | 5.08x10⁻¹⁶ | 3.23x10⁻⁸ |
| CE-CML | 5.70x10⁻⁵ | 6.44x10⁻¹⁸ | 2.63x10⁻¹¹ |
| Fib-Fib | 6.60x10⁻⁹ | 3.15x10⁻¹⁹ | 9.60x10⁻⁵ |
| Fib-CML | 4.48x10⁻⁵ | 1.64x10⁻¹⁸ | 1.08x10⁻¹¹ |
| GB-GR | 9.78x10⁻⁶ | 4.49x10⁻¹⁴ | 6.22x10⁻⁶ |
| GB-CML | 5.23x10⁻⁵ | 5.69x10⁻¹⁶ | 2.76x10⁻⁹ |
| GR-GR | 4.56x10⁻⁶ | 5.30x10⁻¹⁴ | 3.38x10⁻⁵ |
| GR-CML | 4.71x10⁻⁵ | 6.72x10⁻¹⁶ | 4.02x10⁻⁹ |
| FB-Cal | 2.18x10⁻⁶ | 1.17x10⁻¹⁶ | 3.27x10⁻⁷ |
| FB-CML | 4.62x10⁻⁵ | 3.51x10⁻¹⁸ | 2.18x10⁻¹¹ |
| Pla-GR | 1.13x10⁻⁵ | 3.57x10⁻¹⁴ | 3.72x10⁻⁶ |
| Pla-CML | 5.38x10⁻⁵ | 4.52x10⁻¹⁶ | 2.07x10⁻⁹ |
| Col-Col | 5.00x10⁻⁷ | 7.78x10⁻¹⁶ | 4.13x10⁻⁵ |
| Col-CML | 4.51x10⁻⁵ | 8.15x10⁻¹⁷ | 5.32x10⁻¹⁰ |
| Elas-LDL | 1.95x10⁻⁸ | 9.76x10⁻¹⁹ | 3.40x10⁻⁵ |
| Elas-CML | 4.48x10⁻⁵ | 2.06x10⁻¹⁸ | 1.36x10⁻¹¹ |
| CML-GR | 4.71x10⁻⁵ | 6.72x10⁻¹⁶ | 4.02x10⁻⁹ |
| CML-Fib | 4.48x10⁻⁵ | 1.64x10⁻¹⁸ | 1.08x10⁻¹¹ |
| Cal-Cal | 1.50x10⁻⁶ | 9.49x10⁻¹⁵ | 5.60x10⁻⁵ |
| Cal-CML | 4.56x10⁻⁵ | 2.84x10⁻¹⁶ | 1.82x10⁻⁹ |
| LDL-LDL | 2.00x10⁻⁸ | 1.92x10⁻¹⁸ | 6.35x10⁻⁵ |
| LDL-CML | 4.48x10⁻⁵ | 4.04x10⁻¹⁸ | 2.67x10⁻¹¹ |
| Mac-GR | 2.23x10⁻⁵ | 3.78x10⁻¹⁵ | 1.01x10⁻⁷ |
| Mac-CML | 6.48x10⁻⁵ | 4.79x10⁻¹⁷ | 1.5x10⁻¹⁰ |
| Glu-Glu | 9.90x10⁻⁵ | 3.56x10⁻¹⁷ | 4.82x10⁻⁵ |
| Glu-CML | 4.49x10⁻⁵ | 1.74x10⁻¹⁷ | 1.15x10⁻¹⁰ |
| Maximum and minimum Eadh values of the bonds of elements: | |||
| CE-GR | 1.44x10⁻⁵ | 5.08x10⁻¹⁶ | 3.23x10⁻⁸ |
| CE-Cal | 1.29x10⁻⁵ | 2.15x10⁻¹⁶ | 1.71x10⁻⁸ |
| Fib-Fib | 6.60x10⁻⁹ | 2.15x10⁻¹⁶ | 9.60x10⁻⁵ |
| Fib-LDL | 1.33x10⁻⁸ | 7.77x10⁻¹⁹ | 5.83x10⁻⁵ |
| GB-GR | 9.78x10⁻⁶ | 7.77x10⁻¹⁹ | 6.22x10⁻⁶ |
| GB-Cal | 8.25x10⁻⁶ | 1.90x10⁻¹⁴ | 3.70x10⁻⁶ |
| GR-GR | 4.56x10⁻⁶ | 5.30x10⁻¹⁴ | 3.38x10⁻⁵ |
| GR-Cal | 3.03x10⁻⁶ | 2.24x10⁻¹⁴ | 3.24x10⁻⁵ |
| FB-Cal | 2.18x10⁻⁶ | 1.17x10⁻¹⁶ | 3.27x10⁻⁷ |
| FB-GR | 3.71x10⁻⁶ | 2.77x10⁻¹⁶ | 3.67x10⁻⁷ |
| Pla-GR | 1.13x10⁻⁵ | 3.57x10⁻¹⁴ | 3.72x10⁻⁶ |
| Pla-Cla | 9.75x10⁻⁶ | 1.51x10⁻¹⁴ | 2.11x10⁻⁶ |
| Col-Col | 5.00x10⁻⁷ | 7.78x10⁻¹⁶ | 4.13x10⁻⁵ |
| Col-Cal | 1.00x10⁻⁶ | 2.72x10⁻¹⁵ | 3.61x10⁻⁵ |
| Elas-LDL | 1.95x10⁻⁸ | 9.76x10⁻¹⁹ | 3.40x10⁻⁵ |
| Elas-Fib | 1.28x10⁻⁸ | 3.96x10⁻¹⁹ | 3.20x10⁻⁵ |
| CML-GR | 4.71x10⁻⁵ | 6.72x10⁻¹⁶ | 4.02x10⁻⁹ |
| CML-GB | 5.23x10⁻⁵ | 5.69x10⁻¹⁶ | 2.76x10⁻⁹ |
| Cal-Cal | 1.50x10⁻⁶ | 9.49x10⁻¹⁵ | 5.60x10⁻⁵ |
| Cal-Col | 1.00x10⁻⁶ | 2.72x10⁻¹⁵ | 3.61x10⁻⁵ |
| LDL-LDL | 2.00x10⁻⁸ | 1.92x10⁻¹⁸ | 6.35x10⁻⁵ |
| LDL-Fib | 1.33x10⁻⁸ | 7.77x10⁻¹⁹ | 5.83x10⁻⁵ |
| Mac-GR | 2.23x10⁻⁵ | 3.78x10⁻¹⁵ | 1.01x10⁻⁷ |
| Mac-GB | 2.75x10⁻⁵ | 3.20x10⁻¹⁵ | 5.61x10⁻⁸ |
| Glu-Glu | 9.90x10⁻⁸ | 3.56x10⁻¹⁷ | 4.82x10⁻⁵ |
| Glu-LDL | 5.95x10⁻⁸ | 8.26x10⁻¹⁸ | 3.10x10⁻⁵ |
Source: compiled by the authors.
Owens and Wendt mentioned that adhesion energy is affected by certain factors, such as surface area and free energy. The latter describes the surface energy of a material and influences its ability to adhere to other components.49 Similarly, Zhang et al. (2020) described how environmental conditions such as temperature and humidity can also affect molecular adhesion.50 In their 2012 book, Ratner et al. described the applications of adhesion in biomedicine, such as cell adhesion and biomaterials. The latter involves the interaction between cells and biomimetic surfaces and is key to the design of implants,51 nanotechnology, and coatings. In 2017, Bhushan mentioned that molecular adhesion plays a fundamental role in the stability of nanocomposites, making the study of the adhesion of materials and molecules essential in various disciplines, from engineering to biomedicine.52 Understanding the mechanisms and factors involved in adhesion enables improved material design and facilitates the diagnosis of thrombosis-related conditions.
ResultsAll elements have an irregular geometry that varies depending on their nature. Some, such as glucose, calcium, and blood cells, have specific shapes, while others, such as collagen, fibrinogen, and elastin, form networks from multiple components with amorphous and irregular geometries. For this reason, the dimensions of the elements were approximated to regular, morphic geometries in the proposed analysis, in line with the usual practice in the literature.2,20
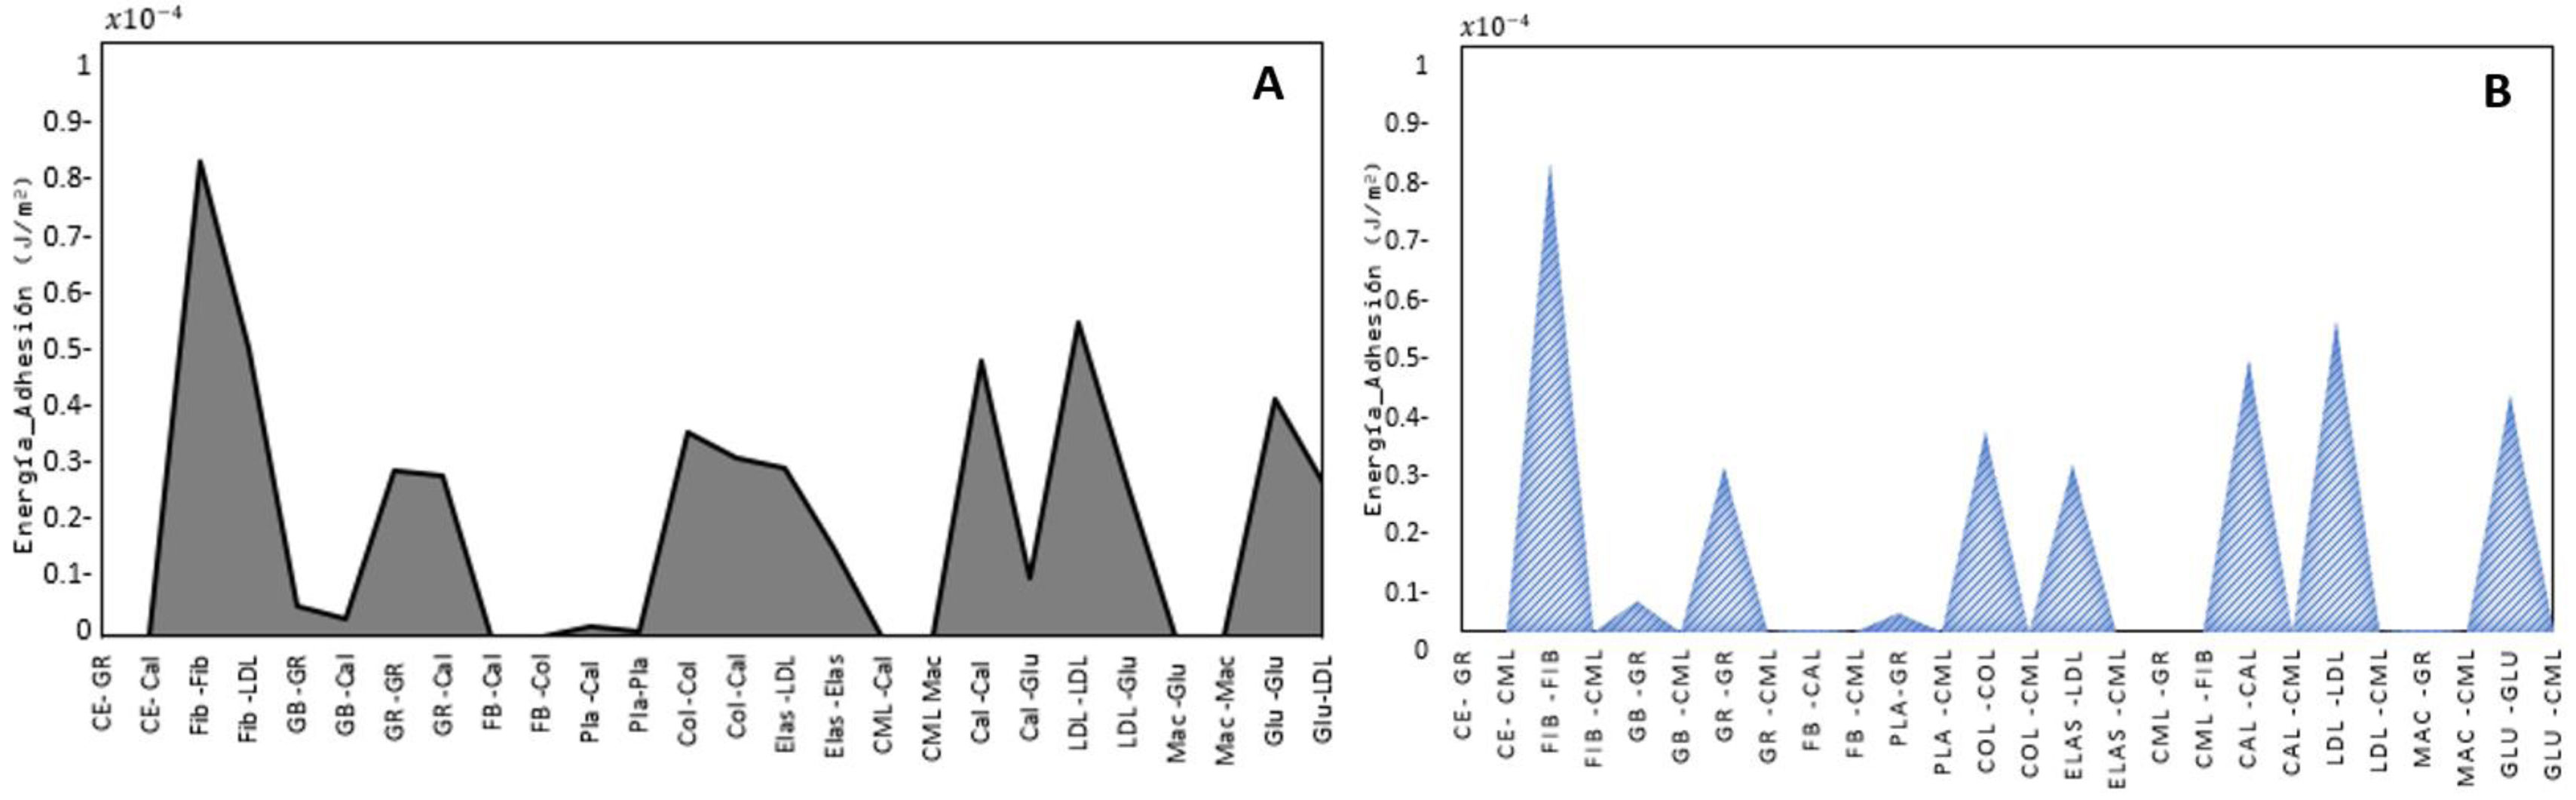
Fig. 3A) shows the data derived from Table 2, which represents the maximum adherent bonds in the pair of molecules, including the relevant combinations of endothelial cells and molecules such as glucose. The two bonds with the highest and lowest adhesion are both significant, as they provide an indication of the amount of energy with which they are bound. The GR-GR bond with a value of 3.38x10(−11)J/m2 and the Cal-Cal bond with a value of 5.60x10⁻⁵J/m2. In contrast, the Fib-CML bond has an energy value of 2.18x10⁻¹¹J/m2 and the LDL-CML interaction has a value of 2.67x10⁻¹¹J/m2. These values are relevant because they enable us to identify which bonds are subject to lower and higher adhesion energy.
A) Adhesion energies, Eadh, with greater influence from molecule combinations, where the greater contact is found in the bonds with fibroblasts and cholesterol molecules, in which the bond between cholesterol and cholesterol is significant for the contacts. B) Maximum and minimum adhesion energies, Eadh, of the combinations of molecules, where the greatest contact is found in the bonds with fibroblasts, cholesterol molecules, and collagen fibres, in which the bond between cholesterol and cholesterol is relevant for the contacts. Source: compiled by the authors.
Similarly, Table 2 shows the combinations of molecules with the two highest adhesion energies. The energy required for their bonding is calculated based on this Table. Fig. 3(B) illustrates the two maximum interactions in these molecular pair bonds, including the Fib-LDL interaction with a value of 5.38x10⁻⁵J/m2, which also interacts with Elas-LDL with a value of 3.40x10(−5)J/m2. Less relevant combination are also depicted, including the CML-GR bonds 4.02x10⁻⁹J/m2 and the CML-GB bonds 2.76x10⁻⁹J/m2. These findings show that the bonds with the highest adhesion are those that interact with cholesterol molecules.
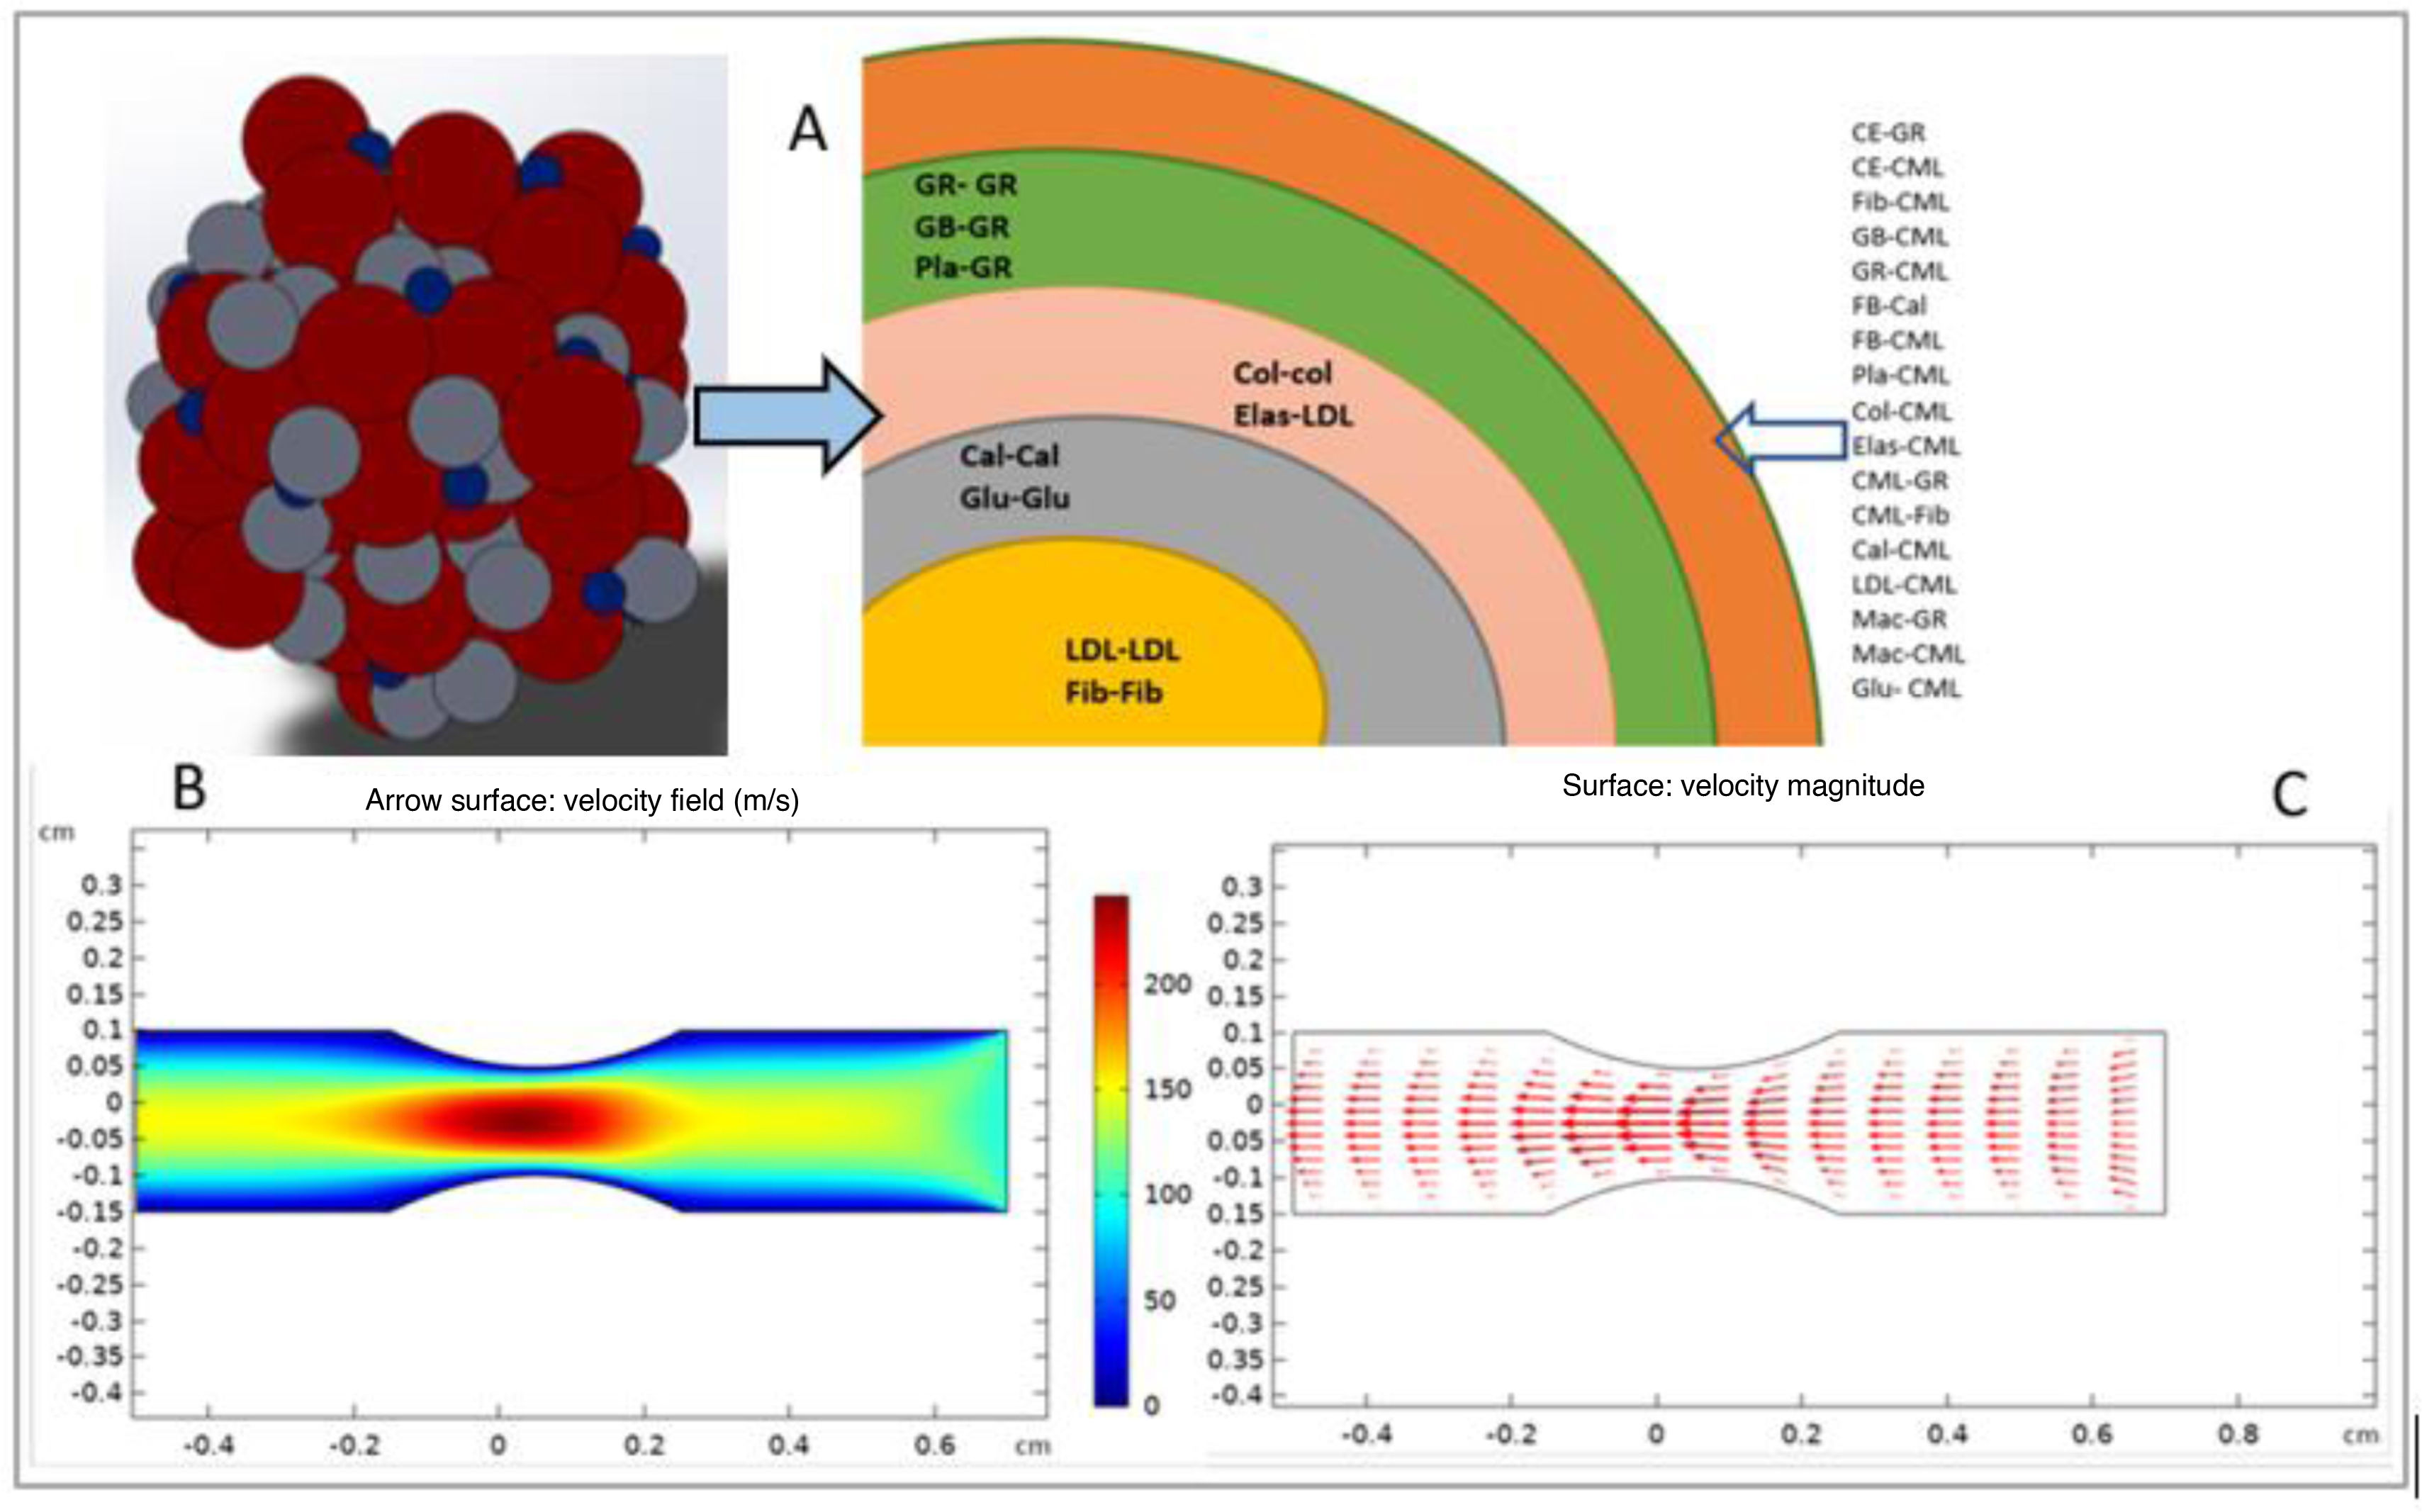
Fig. 4A) shows the CAD design describing the structure of the atheroma. LDL cholesterol and fibroblasts adhere first due to their high adhesion energy. They are followed by glucose and calcium, with muscle cells and macrophages showing the lowest adhesion. Fig. 4B) shows how the narrowing of the artery by fatty plaque facilitates the adhesion of red blood cells and other elements to form a thrombus. Fig. 4C) describes the need for increased blood flow velocity to compensate for the narrowed artery. This is due to the increased adhesion of elements such as fibrin and collagen, which can cause the thrombus to detach and become potentially fatal. Although drugs are available to reduce fatty plaques, they are only moderately effective due to a lack of follow-up and analysis of risk factors in patients with atheroma.
A) Probability of adhesion of bonds in an atheroma. B) Simulation of the concentration of the force exerted by the bloodstream in the artery, where enough elements adhere to form the thrombus. C) Increase in blood flow velocity compensated by narrowing of the artery. Source: compiled by the authors.
Atheroma and thrombosis are closely related in the development of cardiovascular diseases, particularly atherosclerosis. An atheroma is an accumulation of cholesterol, inflammatory cells, and fibrous tissue in the walls of arteries, reducing blood flow by narrowing the arterial lumen. This arterial lesion can trigger chronic inflammation and promote the formation of thrombi and blood clots that partially or completely block blood flow.
DiscussionThe data presented in Table 2 and Fig. 3A) highlight that the Fib-Fib molecule pair exhibits the highest adhesion energy, with a value of 9.60x10⁻⁵J/m2, while the GB-CML molecule pair shows an adhesion energy of 2.76x10⁻⁹J/m2. It is noteworthy that combinations that share bonds with collagen and cholesterol have a significant influence on adhesion energy compared to other molecules. This is due to the nature of collagen, which forms fibres and interactive networks with neighbouring molecules in various combinations, as mentioned by Cadroy et al.53 Similarly, cholesterol molecules (LDL) play a crucial role in atheroma formation and accumulate in considerable amounts in the blood. In relation to Table 2 and Fig. 3B), it is confirmed that the elements that interact with fibroblasts, collagen, glucose, and cholesterol show higher adhesion energy, as described by Díaz Casasola and Luna Pichardo.54 Examples of this are the LDL-LDL molecular bond with an energy value of 6.35x10⁻⁵J/m2 and the Elas-LDL combination with a value of 3.40x10⁻⁵J/m2, both of which are noteworthy for their high adhesion. Furthermore, it can be seen that the bonds with lower adhesion energy, such as the CML-GR bond with a value of 4.02x10⁻⁹J/m2, suggest that these combinations of molecules could be the last to bond during atheroma formation. It can be inferred that molecules that interact with higher adhesion energy, such as fibroblasts, collagen, glucose, and cholesterol, are the first to adhere to initiate atheroma plaque formation. While molecules with minimal adhesion energy, such as macrophages and smooth muscle cells, could be the last to bond to complete plaque formation, these results reveal the influence of adhesion energy on thrombus formation, as red blood cells are exposed at the end with lower adhesion binding and easily detach compared to the results of Douketis.55 It is worth mentioning that the most direct relationship between an atheroma and thrombosis occurs when an atherosclerotic plaque ruptures or erodes, the fibrous layer covering the atheroma can tear, exposing the internal contents of the plaque, such as cholesterol and fatty material, to the circulating blood. Exposure of the blood to the components of the plaque triggers a coagulation process, which causes a thrombus to form at the site of the lesion, as mentioned by Streiff.56 This is particularly dangerous if it occurs in the coronary or cerebral arteries, as it can cause an MI or stroke, respectively. The research study we conducted is original, as no studies have specifically related the adhesion energy of blood elements to thrombus formation. While previous studies have mainly focussed on the medical perspective, this paper is the first to address the adhesion phenomenon from an engineering and probabilistic perspective.
ConclusionThe conclusions are obtained from Table 2 and Fig. 3, which show a range of adhesion energies from 1.08x10⁻¹¹J/m2 to 9.60x10⁻⁵J/m2. Both the methodology and the results obtained in this research study revealed that the bonding of Fib-Fib fibrinogen molecule pairs has an adhesion energy value of 9.60x10⁻⁵J/m2, and of collagens Col-Col a value of 4.13x10⁻⁵J/m2. This is based on the fact that fibrinogens and collagens are networks and fibres that are in contact with various elements of the atheroma. The bonds of cholesterol molecules that are LDL–LDL contain an adhesion value of 6.35x10⁻⁵J/m2. This result is due to the fact that these molecules are the basis for the formation of the plaque structure. Muscle cells have lower adhesion values, and when they bond to endothelial cells CE-CML, their value is only 2.63x10⁻¹¹J/m2, whereas when they bond to fibroblast FB-CML, their adhesion value is 2.18x10⁻¹¹J/m2. It can be stated, therefore, that muscle cells are the last to adhere to form the plaque structure. In conclusion, atheroma creates the right conditions for thrombosis by damaging and narrowing the arteries and when it ruptures, can initiate the process of thrombus formation, leading to serious complications in blood circulation.
CRediT authorship contribution statement- -
Contribution to the literature on Hamaker constants in the interaction of cholesterol molecules with cells and other molecules.
- -
Numerical analyses were performed on cholesterol plaques adhering to other molecules and cells.
- -
The probability of molecule and cell adhesion in arterial obstruction and thrombus formation.
- -
The correlation between atheroma formation due to fat accumulation and thrombosis was calculated.
- -
The statistics of the placement of molecules and cells in the atheroma in relation to their adhesion energy were analysed.
The authors have no conflict of interest to declare.
We would like to thank the National Technological Institute of Mexico (TecNM), the National Centre for Research and Technological Development (CENIDET), the Department of Mechanics, the Tribology and Biomechanics Laboratory for allowing data collection, and the Mexican National Council for Humanities, Sciences, and Technology (CONAHCYT).


