


To estimate the prevalence of an inter-arm blood pressure difference greater than 10mmHg in patients with type 2 diabetes, and the association of this measurement with the presence of a low ankle–brachial index and mortality at 5-year follow-up.
MethodA validated blood pressure measurement protocol was used. The blood pressure was calculated for each arm to obtain mean systolic differences. Peripheral arterial disease was confirmed by an ankle–arm index less than 0.9. The medical history of the patient was reviewed in the computerized clinical notes after 5 years of follow-up.
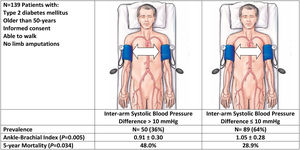
ResultsThe study included 139 patients with a mean age of 70.1 years (49% male), and a mean duration of diabetes mellitus of 10.8 years. A total of 50 (36%) patients had an inter-arm systolic blood pressure difference greater than 10mmHg. Patients with an inter-arm systolic blood pressure greater than 10mmHg had lower ankle–arm index (0.91±0.30 vs. 1.04±0.28, P=0.005), and higher mortality rates from all causes (48.0% vs. 28.9%; hazard ratio 1.64; 95% confidence interval: 1.06–2.53; P=0.03), compared with those with lower inter-arm systolic blood pressure difference.
ConclusionA high proportion of patients with type 2 diabetes have an elevated systolic blood pressure difference between arms. A significant relationship was found between elevated inter-arm systolic blood pressure difference, lower ankle–brachial index and greater all-cause mortality.
Estimar la prevalencia de una diferencia de presión arterial entre brazos superior a 10mmHg en pacientes con diabetes tipo 2, y su asociación con el índice tobillo-brazo y la mortalidad a los 5 años de seguimiento.
MétodoSe utilizó un protocolo validado de medición de presión arterial. La presión sanguínea se calculó para cada brazo para obtener diferencias sistólicas medias. La enfermedad arterial periférica fue confirmada por un índice tobillo-brazo inferior a 0,9. El estado vital del paciente se revisó en la historia clínica electrónica a los 5 años de seguimiento.
ResultadosEstudiamos a 139 pacientes con una edad media de 70,1 años (49% hombres) y una duración media de diabetes mellitus de 10,8 años. Un total de 50 (36%) pacientes tenía una diferencia de presión arterial sistólica entre brazos mayor de 10mmHg. Los pacientes con diferencia elevada de presión arterial sistólica entre los brazos mostraron un menor índice tobillo-brazo (0,91±0,30 vs. 1,04±0,28; P=0,005), y una mayor tasa de mortalidad por todas las causas (48,0% vs. 28,9%; cociente de riesgo 1,64; intervalo de confianza al 95%: 1,06-2,53; P=0,03), respecto a los pacientes con menores diferencias de presión sistólica entre brazos.
ConclusiónEncontramos una alta proporción de pacientes con diabetes tipo 2 que tenían una diferencia elevada de presión arterial sistólica entre los brazos. Existe una asociación significativa entre la diferencia elevada de la presión arterial sistólica entre brazos, el índice tobillo-brazo y mortalidad.
Clinical practice guidelines advise measuring blood pressure in both arms and if the reading is different, it is recommended to use the arm with the highest measurement for subsequent controls.1,2 The blood pressure measured in the right arm is usually higher than that of the left arm. This is explained because the left subclavian artery originates directly in the aorta, and its path forms an acute angle that produces turbulence reducing blood flow. A difference of less than 10mmHg is considered normal, while differences equal to or greater than 10mmHg have been associated with the presence of atherosclerotic subclavian stenosis, increased incidence of cardiovascular events and mortality.3,4
The prevalence of finding a difference greater than 10mmHg in the systolic blood pressure of both arms varies according to populations; being 11.2% in the hypertensive patients, 7.4% in patients with diabetes and 3.6% in the general adult population.5 However, in patients with chronic renal disease or peripheral arterial disease, the probability of finding a systolic blood pressure differences between arms of more than 10mmHg is about 25%.6,7 Patients with diabetes may frequently suffer from peripheral arterial disease or chronic kidney disease, which may warrant a higher frequency for significant differences in systolic blood pressure between arms.
The objectives of the present study were to assess the prevalence of an inter-arm blood pressure difference greater than 10mmHg in patients with diabetes mellitus and, to evaluate the association between an inter-arm blood pressure difference greater than 10mmHg and the presence of cardiovascular complications and all-cause mortality after 5 years of follow-up.
MethodsPatient populationPatients with diabetes mellitus were considered for enrollment in the study. Eligibility criteria included: (i) age greater than 50 years old and diagnosed of diabetes mellitus; (ii) attending the Department of Internal Medicine at our institution; (iii) able to walk; (iv) given informed consent. The exclusion criteria used were: (i) obese individual requiring special cuffs; (ii) presence of painful inflammatory processes, wounds, phlebitis or extreme edema; (iii) presence of revascularization procedures or amputation in any of the limbs. Patients were prospectively enrolled during times the investigators were available. The inclusion period started on February 2010, and ended in December 2011.
Data collectionBaseline data collection included: age, sex, duration of diabetes mellitus, smoking habit, diagnosis of hypertension or hyperlipidemia and past history of coronary artery disease or cerebrovascular disease. Laboratory data obtained were fasting blood glucose, hemoglobinA1c, total cholesterol, high density lipoprotein cholesterol, triglycerides, creatinine, and estimated glomerular filtration rate. Chronic kidney disease was defined according to criteria K/DOQI (Kidney Disease Quality Outcome Initiative) based on a reduction of the estimated glomerular filtration rate lower than 60mL/min/1.73m2 during 3 or more months or the presence of an albumin to creatinine ratio greater than 30mg/g in at least two isolated urine samples. The estimation of glomerular filtration rate was performed using the CKD-EPI equation.8 We checked patients’ vital status in the electronic records after a 5-year of follow-up period to assess all-cause mortality (censored date November 21, 2016).
ProceduresPatients were examined by one of four authors (JE, SPM, TL, CRA). Patients were examined after 5min of rest in a comfortable room according guidelines.1 We used an upper arm blood pressure automated device (Omron M6 Comfort HEM-700E; Omron Healthcare, Japan).1
After using the automated device, the systolic blood pressure at the brachial, dorsalis pedis and posterior tibial arteries were measured at each limb using a handheld Doppler device with an 8MHz continuous wave probe (Minidop ES-100 VX, Hadeco Inc., Japan). Once the pulse sound was located by the handheld Doppler probe, a 24–32cm cuff of an aneroid sphygmomanometer (Riester Minimus III, Germany) was inflated until the signal disappeared. The cuff was then slowly deflated and the pressure at which the signal reappeared was recorded.
Ankle–brachial index estimationAnkle–brachial index was calculated in every patient after collection of all data. We used the ratio of the highest registered measurements of ankle and brachial blood pressure. With a patient at rest, a normal ankle–brachial index ranges from 0.91 to 1.40. A reading above 1.40 (non-interpretable) is usually suggestive of incompressible tibial arteries. No studies were further carried out to assess the presence of peripheral arterial disease. Decreases in the ankle–brachial index are consistent with peripheral arterial disease. Mild-to-moderate peripheral arterial disease usually produces an ankle–brachial index in the range of 0.41–0.90. A reading below 0.40 suggests the presence of severe peripheral arterial disease.14,15
Sample size calculationAccording to literature data, the prevalence of finding a difference in systolic pressure between arms of more than 10mmHg is 10%. To estimate the 95% confidence interval with an accuracy of ±5% the sample size called for a total of 139 patients.
Statistical analysisContinuous variables are expressed as mean (standard deviation). Categorical variables are expressed as frequency (percentage). The comparison between continuous variables was performed using the Student t test. Multiple group comparisons were tested using ANOVA. The comparison between categorical variables was carried out using the ?2 test or the Fisher exact test. We used the Kaplan–Meier method for the univariate analysis of survival and assessed the difference between survival curves (for inter-arm systolic blood pressure difference >10mmHg vs. =10mmHg) by the log-rank test. Cox's proportional hazards univariate analysis was used to calculate hazard ratios and 95% confidence intervals. Estimated P values <0.05 for 2 tails were considered statistically significant. Statistical analysis was performed with the SPSS package.
Ethical reviewThe protocol was approved by the institutional review board of the Hospital Marina Baixa. All patients gave informed consent. Information obtained was recorded in such a manner that subjects cannot be recognized, directly or through identifiers linked to the subjects.
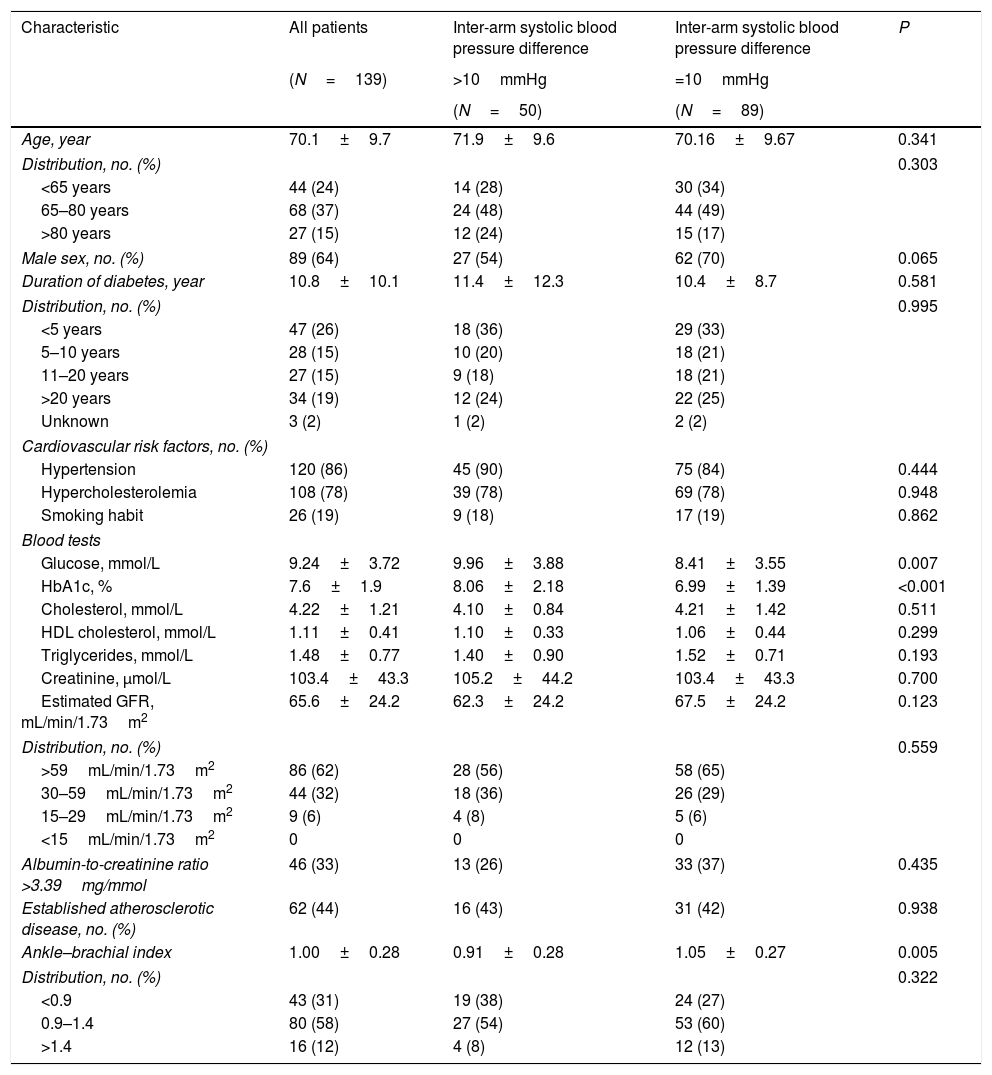
ResultsWe studied a total of 139 patients with a mean age of 70.1 years (range 50–90), being 64% male and with an average duration of diabetes from the diagnosis of 10.8 years (Table 1).
Patients characteristics.
| Characteristic | All patients | Inter-arm systolic blood pressure difference | Inter-arm systolic blood pressure difference | P |
|---|---|---|---|---|
| (N=139) | >10mmHg | =10mmHg | ||
| (N=50) | (N=89) | |||
| Age, year | 70.1±9.7 | 71.9±9.6 | 70.16±9.67 | 0.341 |
| Distribution, no. (%) | 0.303 | |||
| <65 years | 44 (24) | 14 (28) | 30 (34) | |
| 65–80 years | 68 (37) | 24 (48) | 44 (49) | |
| >80 years | 27 (15) | 12 (24) | 15 (17) | |
| Male sex, no. (%) | 89 (64) | 27 (54) | 62 (70) | 0.065 |
| Duration of diabetes, year | 10.8±10.1 | 11.4±12.3 | 10.4±8.7 | 0.581 |
| Distribution, no. (%) | 0.995 | |||
| <5 years | 47 (26) | 18 (36) | 29 (33) | |
| 5–10 years | 28 (15) | 10 (20) | 18 (21) | |
| 11–20 years | 27 (15) | 9 (18) | 18 (21) | |
| >20 years | 34 (19) | 12 (24) | 22 (25) | |
| Unknown | 3 (2) | 1 (2) | 2 (2) | |
| Cardiovascular risk factors, no. (%) | ||||
| Hypertension | 120 (86) | 45 (90) | 75 (84) | 0.444 |
| Hypercholesterolemia | 108 (78) | 39 (78) | 69 (78) | 0.948 |
| Smoking habit | 26 (19) | 9 (18) | 17 (19) | 0.862 |
| Blood tests | ||||
| Glucose, mmol/L | 9.24±3.72 | 9.96±3.88 | 8.41±3.55 | 0.007 |
| HbA1c, % | 7.6±1.9 | 8.06±2.18 | 6.99±1.39 | <0.001 |
| Cholesterol, mmol/L | 4.22±1.21 | 4.10±0.84 | 4.21±1.42 | 0.511 |
| HDL cholesterol, mmol/L | 1.11±0.41 | 1.10±0.33 | 1.06±0.44 | 0.299 |
| Triglycerides, mmol/L | 1.48±0.77 | 1.40±0.90 | 1.52±0.71 | 0.193 |
| Creatinine, µmol/L | 103.4±43.3 | 105.2±44.2 | 103.4±43.3 | 0.700 |
| Estimated GFR, mL/min/1.73m2 | 65.6±24.2 | 62.3±24.2 | 67.5±24.2 | 0.123 |
| Distribution, no. (%) | 0.559 | |||
| >59mL/min/1.73m2 | 86 (62) | 28 (56) | 58 (65) | |
| 30–59mL/min/1.73m2 | 44 (32) | 18 (36) | 26 (29) | |
| 15–29mL/min/1.73m2 | 9 (6) | 4 (8) | 5 (6) | |
| <15mL/min/1.73m2 | 0 | 0 | 0 | |
| Albumin-to-creatinine ratio >3.39mg/mmol | 46 (33) | 13 (26) | 33 (37) | 0.435 |
| Established atherosclerotic disease, no. (%) | 62 (44) | 16 (43) | 31 (42) | 0.938 |
| Ankle–brachial index | 1.00±0.28 | 0.91±0.28 | 1.05±0.27 | 0.005 |
| Distribution, no. (%) | 0.322 | |||
| <0.9 | 43 (31) | 19 (38) | 24 (27) | |
| 0.9–1.4 | 80 (58) | 27 (54) | 53 (60) | |
| >1.4 | 16 (12) | 4 (8) | 12 (13) | |
Continuous variables are expressed as mean±standard deviation. Categorical variables are expressed as frequency (percentage). GFR: glomerular filtration rate CKD EPI (Chronic Kidney Disease Epidemiology Collaboration).
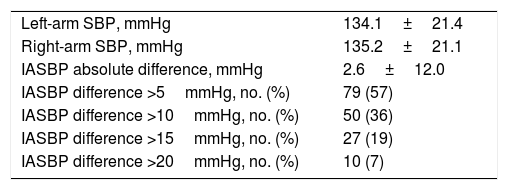
A total of 50 patients (36%; 95% confidence interval [CI]=28–45) presented a difference greater than 10mmHg in the systolic blood pressure between arms (Fig. 1). Ten patients (7%; CI=4–13) presented a difference greater than 20mmHg in the systolic blood pressure between arms (Table 2).

Systolic blood pressure values in the study population.
| Left-arm SBP, mmHg | 134.1±21.4 |
| Right-arm SBP, mmHg | 135.2±21.1 |
| IASBP absolute difference, mmHg | 2.6±12.0 |
| IASBP difference >5mmHg, no. (%) | 79 (57) |
| IASBP difference >10mmHg, no. (%) | 50 (36) |
| IASBP difference >15mmHg, no. (%) | 27 (19) |
| IASBP difference >20mmHg, no. (%) | 10 (7) |
SBP: systolic blood pressure; IASBP: inter-arms systolic blood pressure.
Variables are expressed as mean±SD or frequency (percentage).
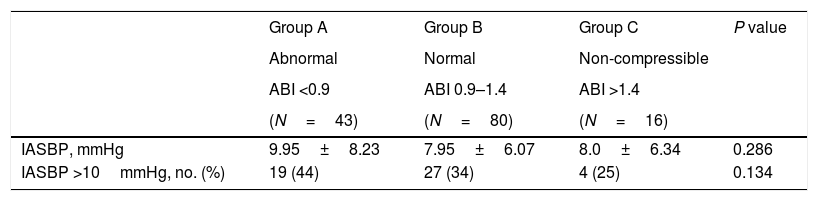
The presence of a difference greater than 10mmHg in the systolic blood pressure between arms was associated with a poorer control of blood glucose metabolism, measured as fasting blood glucose and hemoglobinA1c values compared to patients with lower systolic blood pressure differences (Table 1). Related with ankle–brachial index, patients with a systolic blood pressure difference between arms greater than 10mmHg showed a lower ankle–brachial index than that those with smaller differences in systolic blood pressure (0.91±0.28 vs. 1.05±0.27; P=0.006) (Table 1). Nevertheless, we could only find a trend between inter-arm systolic blood pressure and different categories of ankle–brachial index (Table 3).
Inter-arm systolic blood pressure difference values according to the ABI strata.
| Group A | Group B | Group C | P value | |
|---|---|---|---|---|
| Abnormal | Normal | Non-compressible | ||
| ABI <0.9 | ABI 0.9–1.4 | ABI >1.4 | ||
| (N=43) | (N=80) | (N=16) | ||
| IASBP, mmHg | 9.95±8.23 | 7.95±6.07 | 8.0±6.34 | 0.286 |
| IASBP >10mmHg, no. (%) | 19 (44) | 27 (34) | 4 (25) | 0.134 |
ABI: ankle–brachial index; IASBP: inter-arm systolic blood pressure.
When we compared the vital status after 5 years of follow-up between those patients with an inter-arm difference greater than 10mmHg with those with smaller differences, we found a significant difference in all-cause mortality rates (Fig. 2). Along the follow-up period, 24 (48%) patients died among those with high inter-arm systolic blood pressure difference compared to 26 (28.9%) patients who died among those with lower inter-arm systolic blood pressure difference. The hazard ratio was 1.64 (95% confidence interval: 1.06–2.53; P=0.03).
DiscussionSummary of main findings
In this study the prevalence of a difference greater than 10mmHg in the systolic blood pressure of both arms in patients with type 2 diabetes was 36%. When the cut-off point was set at a difference greater than 20mmHg in the systolic arterial pressure between arms the prevalence found was 7%. We could not confirm our hypotheses of association between an increased inter-arm blood pressure difference with the presence of established cardiovascular disease nor the presence of chronic kidney disease. However, we found an association between increased inter-arm blood pressure difference and ankle–brachial index, and mortality at 5-year follow-up.
The population we studied is representative of patients with type 2 diabetes who come to the clinic. A difference greater than 10mmHg between systolic pressure in both arms has also been found in a similar proportion of patients with diabetes in other studies, such as that of Kleefstra et al., which was 33%.9 However, other publications have also shown a much smaller prevalence of around 10%.10,11 The age of the study patients and the longer evolution of diabetes could be the explanation for such differences among studies.
Regarding the presence of peripheral arterial disease found in our patients, which was 31%, it was been quite similar to that found in a national primary care study in the United States that was 28%.12 We used an automatic oscillometric device (Omron-M6) validated by the Association for the Advancement of Medical Instrumentation13; and a portable Doppler device with a probe of 8mHz which is considered as a reference method for assessing the ankle brachial index by several societies.14 The ankle–brachial index is considered a good screening test for peripheral arterial disease. An ankle–brachial index of 0.9 or less measured by Doppler, has a sensitivity of 95% and a specificity of 100%, when it is compared with angiography in the detection of arterial stenosis greater than 50% of the diameter of the light.15
This study included patients with type 2 diabetes who underwent sequential blood pressure measurement using an automatic oscillometric device. It is known that the differences in systolic pressure between the two arms are lower when the measurement is performed simultaneously.9 Nevertheless, the differences tend to be smaller when the measures are averaged.16
It has been described that the increase in blood pressure difference between both arms is a cardiovascular risk factor. In longitudinal studies carried out in hypertensive patients, it has been shown that every 10mmHg difference increases the risk of mortality 1.24 times.17 In patients with high cardiovascular risk, the difference in systolic pressure greater than 10mmHg between both arms is associated with a 1.12-fold increase in future cardiovascular events.18 In patients with coronary heart disease, a difference greater than 10mmHg in systolic blood pressure between arms is associated with a 2.90-fold increase in the risk of cardiovascular events.19 In relation to the association between difference in blood pressure between arms and peripheral arterial disease there are few studies. In patients referred to vascular surgery for suspected peripheral arterial disease, the association between the increase in systolic pressure difference and the presence of peripheral arterial disease has been shown. However, only differences greater than 25mmHg had an acceptable positive predictive value to be used in the clinic as predictors of peripheral arterial disease.20 A recent study in which the difference in blood pressure was evaluated after simultaneous measurement in the 4 extremities showed a good correlation between systolic blood pressure difference between arms, or legs, with the presence of peripheral arterial disease.21
Moreover, we confirmed that a difference of systolic blood pressure between arms greater than 10mmHg is associated with a 5-year mortality risk in patients with diabetes. Such association has been also found in previous studies.22,23
Strengths and limitations of the studyWe have studied a representative sample of patients with type 2 diabetes who went to a local referral hospital. We have used measurement techniques and blood pressure measurement and ankle–arm estimation devices validated by scientific societies, such as the Omron-M6 device20 and the portable doppler with 8mHz probe.21 The statistical analysis showed the association between an increase in the blood pressure difference and the presence of a worse glucose control or a lower ankle–brachial index. However, the most important limitation of our study lies in having made a consecutive measurement of blood pressure in both arms. Compared to the simultaneous measurement of blood pressure in both arms, the consecutive measurement overestimates the differences, although this overestimation presents regression to the average in relation to the number of measurements. Nevertheless, the use of simultaneous arm blood pressure measuring devices is not widely available in the clinic, being more commonly used single arm automated blood pressure devices. An additional limitation of our study is its external validity. Since patients were recruited at a hospital clinic, the burden of cardiovascular disease of our population is probably much greater than that found in patients attending primary health clinics. On the other hand the small simple size precluded an analysis of individual risk factors on the presence of peripheral arterial disease. Finally, our electronic records do not provide information about the cause of mortality in many of the patients; the information is only available for those patients who died at the hospital.
Implications of the studySimultaneous measurement of blood pressure in both arms should be a standard of care in daily clinical practice, since a difference greater than 10mmHg would indicate the presence of a lower ankle–brachial index and a greater risk of all-cause mortality at 5 years. Although the use of automatic devices with simultaneous measurement of blood pressure in both arms reduces blood pressure variability, serial measurements with single-arm automated devices would also provide enough accuracy.
Role of sponsorsFundación Mutua Madrileña played any role in the planning, design, or conduct of this study; the collection, analysis or interpretation of data; the writing of this report; or in the decision to submit this manuscript for publication.
FundingFundación Mutua Madrileña para la Investigación, through its competitive peer-reviewed granting process partly funded this study.
Authors’ contributionJE conceived and designed the study, undertook the statistical analysis and drafted the paper; TL, SPM, CRA and assisted in study design, collected data and reviewed the paper. All authors reviewed and approved the final manuscript.
Conflict of interestThe authors declare that they have no conflict of interest.
The study was presented in part at the 85th European Atherosclerosis Society Meeting held in Prague, Czech Republic, April 23–26, 2017 (PO518).