


To assess the effect on lipid parameters most associated with excess weight (triglycerides [TG], cholesterol, and high density lipoprotein [HDL-C]) of an intervention to reduce weight in overweight and obese patients.
MethodsA randomised, controlled, double blind clinical trial, with three groups, and a follow-up of 12 months.
Patients included in the study were randomised into three intervention groups: Obesity motivational intervention group with previously trained nurse (G1), lower intensity consultation, non-motivational group, with digital platform support (G2), and a third group that received a recommendation to lose weight and usual follow-up (G3). The anthropometric variables measured were height, weight, and abdominal/waist circumference, and laboratory results, total cholesterol, TG and HDL cholesterol).
ResultsThe study includes 176 patients, of whom 60 were randomised to G1, 61 to G2, and 59 to G3. All groups significantly decreased body weight at the end of the study, with a decrease in G1 (−5.6kg), followed by G2 (−4.3kg), and G3 (−1.7kg), with an overall mean loss of −3.9kg. There was also a significant decrease (p<0.05) in total cholesterol and TG, and an increased HDL-C. These changes were more marked in the G1 group (the group that lost more weight). The clinical relevance indicators that were significant were: in the case of TG: G1/G3: relative risk: 1.42 (95% CI: 1.11–1.80); relative risk reduction: 41.7% (11.4–80.2); absolute risk reduction: 25% (9.2–40.8) and NNT: 5 (3–11). In the case of G1/G2 HDL-C: relative risk: 1.32 (1.07–1.63); relative risk reduction: 32.2% (7.4–62.6); absolute risk reduction: 21.1% (6.4–35.8) and NNT: 5 (3–16).
ConclusionsWeight reduction is accompanied by favourable changes in the lipid parameters related to overweight and obesity, being more intense the greater the weight loss.
Valorar el efecto sobre los parámetros lipídicos más relacionados con el exceso de peso (triglicéridos [TG] y colesterol de las lipoproteínas de alta densidad [cHDL]) de una intervención para reducir peso en pacientes con sobrepeso y obesidad.
MétodosEnsayo clínico, aleatorizado y controlado, doble ciego, con 3 brazos y un seguimiento de 12 meses.
Los pacientes incluidos en el estudio fueron aleatorizados en 3 grupos de intervención: Intervención motivacional de obesidad con enfermera entrenada previamente (G1), intervención en consulta de menor intensidad, sin grupo motivacional, con apoyo de plataforma digital (G2) y un tercer grupo que recibía recomendación de perder peso y seguimiento habitual (G3). Las variables antropométricas medidas fueron estatura, peso y perímetro de cintura abdominal y las analíticas, colesterol total, TG y cHDL).
ResultadosHan participado en el estudio 176 pacientes de los que 60 fueron aleatorizados al G1, 61 al G2 y 59 al G3. Todos los grupos disminuyeron significativamente el peso al final del estudio, siendo más intensa la disminución en el G1 (−5,6kg), seguido del G2 (−4,3kg) y del G3 (−1,7kg), media en su conjunto: −3,9kg. También todos los grupos disminuyeron significativamente (p<0,05) el colesterol total y los TG y aumentaron el cHDL, siendo estos cambios más intensos en el grupo G1, el grupo que más peso perdió. Los indicadores de relevancia clínica que resultaron significativos fueron: en el caso de los TG: G1/G3: riesgo relativo: 1,42 (IC 95%: 1,11-1,80); reducción relativa del riesgo: 41,7% (11,4-80,2); reducción absoluta del riesgo: 25% (9,2-40,8) y NNT: 5 (3-11). En el caso del cHDL G1/G2: riesgo relativo: 1,32 (1,07-1,63); reducción relativa del riesgo: 32,2% (7,4-62,6); reducción absoluta del riesgo: 21,1% (6,4-35,8) y NNT: 5 (3-16).
ConclusionesLa reducción de peso se acompaña de cambios favorables en los parámetros lipídicos relacionados con el sobrepeso y la obesidad, siendo más intensos cuanto mayor es la pérdida de peso.
Obesity is a significant global public health issue. One of the most harmful metabolic disorders associated with this condition is the dyslipidaemia which frequently accompanies it: The typical dyslipidaemia phenotype is pre-prandial hypertriglyceridaemia, decrease in high-density lipoprotein cholesterol (HDL-C), non-HDL post-prandial hyperlipidaemia, and the real increase in the production of small, dense low-density lipoprotein particles. Comprehensive treatment of dyslipidaemia in obese patients should always include an intense approach to addressing obesity and the identification and management of risk factors that interact with the condition, as well as a pharmacological risk-benefit assessment.1–3
In our environment, obesity and dyslipidaemia are frequently linked; therefore, it is very likely that there will be a dyslipidaemia phenotype when the body mass index is between 25.2 and 26.6kg/m2, as corroborated by numerous studies, among which is the United States National Health and Nutrition Examination Survey (NHANES).4–6 The separate reports on dyslipidaemia in men and women and in different ethnic groups reflect a common dyslipidaemia pattern: the significant increase in the real quantity of triglycerides (TG) (mainly very low density lipoproteins, total cholesterol and low HDL-C). The NHANES data has shown that the levels of total cholesterol (TC) are greater in young obese men and women than in non-obese people. The NHANES III study has also demonstrated that in patients with metabolic syndrome the rates of obesity, hypertriglyceridaemia and hypercholesterolaemia are greater than 75%.4–9
It is well-known that treatment for dyslipidaemia, both in overweight and obese patients, must start with weight loss.9,10 Accordingly, the interventions that are focused on changing dietary habits and increasing daily physical activity for the purposes of promoting a healthy lifestyle are the best options for tackling this problem; not forgetting that other interventions such as cognitive-behavioural therapy have proven useful when included in overweight and obesity programmes for the purpose of improving their effectiveness and helping maintain the results obtained.10
Furthermore, regarding the effectiveness of these interventions to reduce weight, the evidence has shown satisfactory results, with reductions of between 8% and 10% of the initial weight being achieved.11,12 However, when considering the maintenance of the weight loss over time, the results obtained are not so encouraging. Scientific evidence shows weight regain in between 30–35% of patients during the first year following the end of the intervention. Over a five-year follow-up period, the regain is more than 50% of the weight lost with regard to the first evaluation phase.13
Our group designed a motivational group intervention for obese patients, conducted by a nurse who had previously been trained by psychological experts, combined with their routine treatment and with a 2-year follow-up period. The results were then published, with 36% of patients achieving weight loss ≥5%. This intervention was subsequently replicated in another region of Spain with the same results. As previously stated, an hour-long motivational group intervention every two weeks from weeks 1 to 12, following the Lifestyle, Exercise, Attitudes, Relationships, Nutrition (LEARN)14–16 programme guidelines, and then monthly from weeks 13 to 32, following the instructions of the Weight Maintenance Survival Guide programme was added to routine treatment.15 With this protocol, the losses were in the first study and in the second study. Although the results were highly satisfactory, the protocol added a cost of 32h more for every 10 patients, i.e. 3.2h per patient per year.
In fact, all the interventions that have proved to be useful need to be intensive, well-structured, and cover multiple aspects, which involves a significant investment in temporary and human resources, of which there is no surplus in our healthcare system rather, there is a lack of these resources. It is for this reason that we need to find strategies that allow for effective approaches, in both the short term and the medium and long term, which consume less resources, allowing us to treat a greater number of people (a larger population). Furthermore, communication and information technologies, and specifically the Internet, are emerging as a new strategy; these technologies have different potentialities, capable of tackling the limitations of traditional programmes, not only for the purpose of losing weight, but also for maintaining the results obtained once the intervention has ended. Communication technologies, which are available to a large part of the population, can be accessed from home or in other contexts, thereby enabling treatment using an intervention method that is better suited to their personal needs and which reduces the costs associated with traditional protocols. Furthermore, these technologies would improve adherence to both diet and treatments for concomitant illnesses,17,18 also having demonstrated their usefulness in the approach to excess weight and obesity.
Therefore, the main objective of this study was to evaluate the evolution of the main lipid parameters related to weight gain (TC, TG and HDL-C), through a clinical trial designed to reduce weight gain, and to evaluate the effectiveness of these interventions according to the number of patients who reduce both their TC and TG and increase their HDL-C after one year of follow-up.
Material and methodsThe study is designed as a randomised, double-blind, controlled, 3-arm clinical trial monitored over 12 months with a 1:1:1 allocation ratio. The inclusion criteria were as follows: present a BMI greater than 24.9kg/m2 and less than 40kg/m2 on the occupational health report and the patients, both male and female, must be between 30 and 70 years old. The exclusion criteria were as follows: patients with severe illnesses (bed-ridden, affected by neoplasia, cognitive disorders, etc.), patients with secondary obesity (hypothyroidism, Cushing's disease, etc.), patients with severe sensory illnesses that interfere with motivational intervention such as uncorrected visual or auditory impairments, etc., and patients with severe psychiatric illnesses.
The data was collected between March 2015 and June 2016 in 3 basic health areas in Barcelona. The patients included in the study signed an informed consent form approved by the regional ethics committee.
InterventionsThe patients were randomly sorted into 3 intervention groups: motivational obesity intervention with a previously trained nurse (G1), lower intensity consultation intervention, with no motivational group, and with digital platform support (G2), and a third group who were recommended to lose weight and regularly monitor weight loss (G3).
The protocol applied in G1 followed the previously published IMOAP method.15,16 In short, this consisted of an hour-long motivational group intervention every two weeks from weeks 1 to 12, following the LEARN programme guidelines, and then monthly from weeks 13 to 32, following the instructions of the Weight Maintenance Survival Guide programme and those of the SEEDO’2000 Consensus Guide for Prevention and Treatment of Overweight and Obesity.17–20 For G2, after the initial visit, visits were scheduled after 15 days, 1 month, 3 months, 6 months and one year. In each of the visits the anthropometric data were obtained and the level of physical activity and adherence to the Mediterranean diet were reviewed using the data recorded by the patient on the digital platform. In order to determine adherence to the Mediterranean diet, this platform uses a short, specific questionnaire consisting of 14 questions validated for the Spanish population and used by the PREDIMED group (Prevention with a Mediterranean Diet),20–22 encouraging the patient to improve their level of adherence. Weight loss was recommended to G3. This weight-loss recommendation included information on 3 different aspects, with the patients being provided with self-monitoring tools. First concept: “Monitoring your weight may help you achieve your weight loss goal”. With this in mind, patients were offered the possibility of periodically recording it at the healthcare centre, with the same frequency as in the G2 group. Second concept: “Following a Mediterranean diet helps you reach an appropriate body weight and helps you maintain it”. Third concept: “Following a Mediterranean diet entails adhering to diet recommendations as well as maintaining an active lifestyle”.23 Both adherence to the Mediterranean diet and physical activity can be measured using digital tools which are available to the users of which they are made aware.
The anthropometric measurements were collected as follows: Weight was measured in kilograms (kg), in underwear, using a digital scale (range between 0.1 and 150kg, precision of 0.1kg), height was measured in metres (m) with the patient barefoot and using a Harpenden digital stadiometer (range 0.7–2.05m and precision of 1mm), and BMI was calculated (kg/m2). The BMI was interpreted using the SEEDO 2000 weight classification.20 A BMI of between 25 and 29.9 was considered overweight and a BMI greater than or equal to 30 was considered obese. The waist circumference was measured with a flexible, inextensible metric tape with a range of between 0.1cm and 2m. The circumference was measured at the mid-point between the lower edge of the rib and the iliac crest. Blood pressure was measured using an automated and calibrated electronic device, according to the recommendations of the Spanish Society of Arterial Hypertension.24 All the extractions were carried out by qualified professional who took special care in maintaining the same posture (always seated) and ensuring minimum venous stasis in the patients, for the purpose of preventing factors that could have an influence as sources of extra-analytical variation, after a fasting period of at least 12h.
Statistical analysis of the data was performed with SPSS software, version 19.0. Both the quantitative and qualitative variables are expressed accordingly, i.e. average and standard deviation for the former, and precise number and percentage for the latter. The ANOVA test was used to verify that the randomisation was performed correctly between the 3 groups. If there had been any significant differences between the groups, the Bonferroni method would be applied a posteriori. To compare the averages throughout the follow-up period, a repeated measures analysis of variance was used. When the normality and sphericity criteria were not met, the non-parametric Friedman test was used. When the quantitative variables in the same group were compared at two different points in time, the differences between the averages were calculated using the Student's t-test for paired data. After the interventions, the groups were compared using clinical significance indicators, i.e. relative risk (RR), absolute risk reduction (ARR), relative risk reduction (RRR) and number needed to treat (NNT). The analysis was performed using intention to treat. Comparisons with a p value ≤0.05 were considered statistically significant.
Results180 patients participated in the study, 60 of whom were randomly allocated to G1, 61 to G2, and 59 to G3. There were no drop-outs in G1 or G2 during the follow-up period, however 4 patients left G3 for personal reasons, leaving this group with 55 patients.
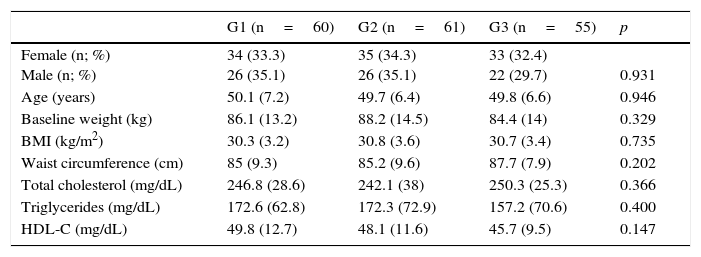
Table 1 shows how after the randomisation, there were no significant differences in any of the variables compared, both anthropometric and analytical, across the 3 groups, which indicates that the randomisation was successful. 20.92% of patients were overweight while 79.08% were classed as obese.
Baseline sample data by group.
| G1 (n=60) | G2 (n=61) | G3 (n=55) | p | |
|---|---|---|---|---|
| Female (n; %) Male (n; %) | 34 (33.3) 26 (35.1) | 35 (34.3) 26 (35.1) | 33 (32.4) 22 (29.7) | 0.931 |
| Age (years) | 50.1 (7.2) | 49.7 (6.4) | 49.8 (6.6) | 0.946 |
| Baseline weight (kg) | 86.1 (13.2) | 88.2 (14.5) | 84.4 (14) | 0.329 |
| BMI (kg/m2) | 30.3 (3.2) | 30.8 (3.6) | 30.7 (3.4) | 0.735 |
| Waist circumference (cm) | 85 (9.3) | 85.2 (9.6) | 87.7 (7.9) | 0.202 |
| Total cholesterol (mg/dL) | 246.8 (28.6) | 242.1 (38) | 250.3 (25.3) | 0.366 |
| Triglycerides (mg/dL) | 172.6 (62.8) | 172.3 (72.9) | 157.2 (70.6) | 0.400 |
| HDL-C (mg/dL) | 49.8 (12.7) | 48.1 (11.6) | 45.7 (9.5) | 0.147 |
cm: centimetres; G1: consultation group; G2: consultation+telemedicine group; G3: group recommended to lose weight; BMI: body mass index; kg: kilograms; kg/m2: kilograms divided by height in metres squared; mg/dL: milligrams per decilitre.
The results are expressed as an average and (standard deviation) or as a precise number and (percentage).
The averages were compared using path variance analysis and the proportions were compared using the Chi-square test.
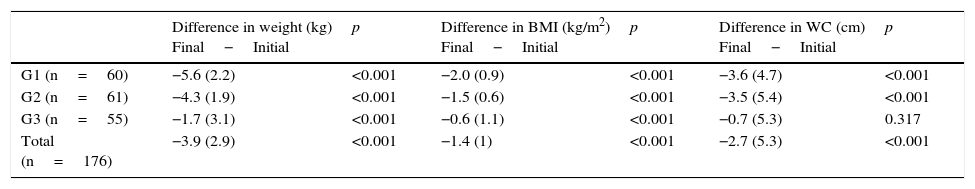
Table 2 shows the average of the differences in the anthropometric measurements at the beginning and at the end of the follow-up year in each group. A significant drop was observed in all of these except for waist circumference in G3 (p=0.317) with G1 experiencing a greater reduction that the other groups. Fig. 1 shows the evolution of the BMI at the various points at which it was measured. It can be seen that in each review, the BMI progressively decreased up to 6 months, with a slight increase being observed in the following 6 months, although this reduction was greater in G1, followed by G2 and then G3. In this case, G3 presents 47 patients since 8 individuals in this group did not determine their weight or their waist circumference in the interim reviews, only at the beginning and end.
Decrease in weight, body mass index and waist circumference between the initial and final evaluation.
| Difference in weight (kg) Final−Initial | p | Difference in BMI (kg/m2) Final−Initial | p | Difference in WC (cm) Final−Initial | p | |
|---|---|---|---|---|---|---|
| G1 (n=60) | −5.6 (2.2) | <0.001 | −2.0 (0.9) | <0.001 | −3.6 (4.7) | <0.001 |
| G2 (n=61) | −4.3 (1.9) | <0.001 | −1.5 (0.6) | <0.001 | −3.5 (5.4) | <0.001 |
| G3 (n=55) | −1.7 (3.1) | <0.001 | −0.6 (1.1) | <0.001 | −0.7 (5.3) | 0.317 |
| Total (n=176) | −3.9 (2.9) | <0.001 | −1.4 (1) | <0.001 | −2.7 (5.3) | <0.001 |
cm: centimetres; G1: consultation group; G2: consultation+telemedicine group; G3: group recommended to lose weight; BMI: body mass index; kg: kilograms; kg/m2: kilograms divided by height in metres squared. WC: waist circumference.
The averages were compared using the Student's t-test for paired groups.
.")
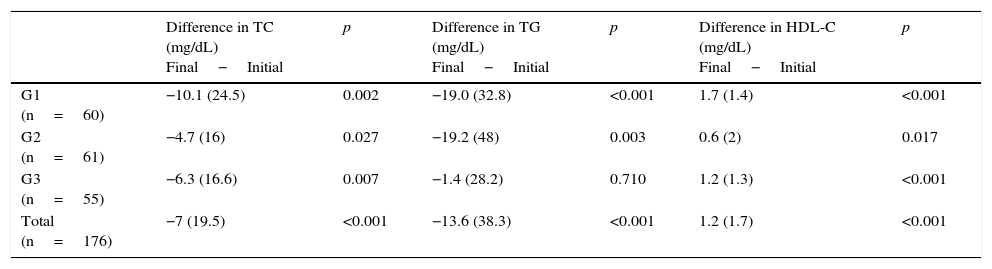
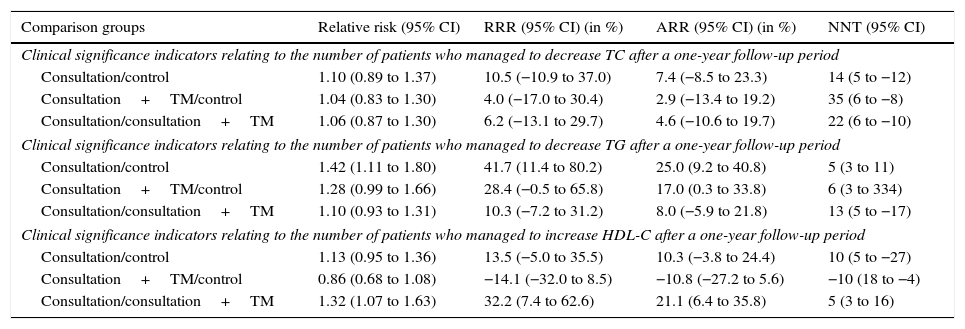
The differences observed in the lipid parameters are expressed in Table 3, with significant differences observed in all parameters, although the reduction in TC and the increase in HDL-C are greater in G1, with the reduction of TG being similar to that of G2. The absolute figures, supplementary to Table 3, can be seen in Fig. 2. Both the drops in TC and TG and the increase in HDL-C are modest, therefore those patients in the 3 groups who experienced a positive change in their data during the follow-up period (the TC and/or TG decreased and/or HDL-C increased) were analysed and compared to those who did not experience these changes. Fig. 3 shows how a significant percentage of patients improve these parameters in the 3 interventions, with the dyslipidaemia typical of obesity (increased TG and decreased HDL-C) standing out as having changed significantly, more so in G1, and less so in the other groups. Given that this is a clinical trial, the intention was to evaluate the clinical significance indicators between the 3 groups for the change observed in both the TC and the TG and HDL-C. These indicators can be seen in Table 4. As regards the TC, there were no significant differences among the 3 groups (the RR is excluded from the confidence interval [CI]). A comparison of G1 and G3 showed some differences in the change in TG (RR: 1.42; CI 95%: 1.11–1.80), NNT=5, but not when G2 was included, indicating that it would be necessary to treat 5 overweight or obese patients for a year with consultation in order to achieve an additional case where the TG decreased with respect to G3 (control or regular treatment group). In the case of the change from the emergence of a new case where the HDL-C increases, the NNT is 5 when comparing G1 and G2, however these changes were not significant between G1 and G3.
Decrease in total cholesterol and triglycerides, and increase in high-density lipoprotein cholesterol between the initial and final evaluation.
| Difference in TC (mg/dL) Final−Initial | p | Difference in TG (mg/dL) Final−Initial | p | Difference in HDL-C (mg/dL) Final−Initial | p | |
|---|---|---|---|---|---|---|
| G1 (n=60) | −10.1 (24.5) | 0.002 | −19.0 (32.8) | <0.001 | 1.7 (1.4) | <0.001 |
| G2 (n=61) | −4.7 (16) | 0.027 | −19.2 (48) | 0.003 | 0.6 (2) | 0.017 |
| G3 (n=55) | −6.3 (16.6) | 0.007 | −1.4 (28.2) | 0.710 | 1.2 (1.3) | <0.001 |
| Total (n=176) | −7 (19.5) | <0.001 | −13.6 (38.3) | <0.001 | 1.2 (1.7) | <0.001 |
HDL-C: cholesterol and high-density lipoproteins; TC: total cholesterol; G1: consultation group; G2: consultation group+telemedicine; G3: group recommended to lose weight; TG: triglycerides.
The averages were compared using the Student's t-test for paired data.
: consultation with motivational intervention; G2 (I=61): lower intensity consultation+telemedicine; G3 (n=55): recommendation to lose weight following regular treatment with consultation. The averages at the beginning and after the 12-month follow-up period were compared using the Student")
Evolution of the analytical parameters at the beginning and end of the study. HDL-C: cholesterol and high-density lipoproteins; TC: total cholesterol; TG: triglycerides; G1 (n=60): consultation with motivational intervention; G2 (I=61): lower intensity consultation+telemedicine; G3 (n=55): recommendation to lose weight following regular treatment with consultation. The averages at the beginning and after the 12-month follow-up period were compared using the Student's t-test for paired data (p<0.05 in all the groups except for the TG in G3 [p=0.710]). The exact significance value can be seen in Table 3.
 in TG (p=0.008) and in HDL-C (p=0.025) were observed between the 3 groups, but not in TC (p=0.653).")
Percentage of patients whose TC and TG decreased and whose HDL-C increased after a 12-month follow-up period. HDL-C: cholesterol and high-density lipoproteins; TC: total cholesterol; TG: triglycerides. G1: consultation group; G2: consultation+telemedicine group; G3: group recommended to lose weight. Significant differences (Chi-square test) in TG (p=0.008) and in HDL-C (p=0.025) were observed between the 3 groups, but not in TC (p=0.653).
Clinical significance indicators across the 3 groups for the change observed in both the TC and the TG and HDL-C.
| Comparison groups | Relative risk (95% CI) | RRR (95% CI) (in %) | ARR (95% CI) (in %) | NNT (95% CI) |
|---|---|---|---|---|
| Clinical significance indicators relating to the number of patients who managed to decrease TC after a one-year follow-up period | ||||
| Consultation/control | 1.10 (0.89 to 1.37) | 10.5 (−10.9 to 37.0) | 7.4 (−8.5 to 23.3) | 14 (5 to −12) |
| Consultation+TM/control | 1.04 (0.83 to 1.30) | 4.0 (−17.0 to 30.4) | 2.9 (−13.4 to 19.2) | 35 (6 to −8) |
| Consultation/consultation+TM | 1.06 (0.87 to 1.30) | 6.2 (−13.1 to 29.7) | 4.6 (−10.6 to 19.7) | 22 (6 to −10) |
| Clinical significance indicators relating to the number of patients who managed to decrease TG after a one-year follow-up period | ||||
| Consultation/control | 1.42 (1.11 to 1.80) | 41.7 (11.4 to 80.2) | 25.0 (9.2 to 40.8) | 5 (3 to 11) |
| Consultation+TM/control | 1.28 (0.99 to 1.66) | 28.4 (−0.5 to 65.8) | 17.0 (0.3 to 33.8) | 6 (3 to 334) |
| Consultation/consultation+TM | 1.10 (0.93 to 1.31) | 10.3 (−7.2 to 31.2) | 8.0 (−5.9 to 21.8) | 13 (5 to −17) |
| Clinical significance indicators relating to the number of patients who managed to increase HDL-C after a one-year follow-up period | ||||
| Consultation/control | 1.13 (0.95 to 1.36) | 13.5 (−5.0 to 35.5) | 10.3 (−3.8 to 24.4) | 10 (5 to −27) |
| Consultation+TM/control | 0.86 (0.68 to 1.08) | −14.1 (−32.0 to 8.5) | −10.8 (−27.2 to 5.6) | −10 (18 to −4) |
| Consultation/consultation+TM | 1.32 (1.07 to 1.63) | 32.2 (7.4 to 62.6) | 21.1 (6.4 to 35.8) | 5 (3 to 16) |
HDL-C: cholesterol and high-density lipoproteins; TC: total cholesterol; CI: confidence interval; NNT: number needed to treat; ARR: absolute risk reduction; RR: relative risk; RRR: relative risk reduction; TG: triglycerides; TM: telemedicine.
The analysis was performed using intention to treat.
This study has shown that one year after applying 3 weight-loss methods, all 3 were successful, although weight loss was more extreme in the intervention groups (G1 and G2) than in the control group. Meanwhile, without any other kind of intervention, it was observed that the majority of patients with dyslipidaemia linked to obesity progressed positively (decrease in TC and TG and increase in HDL-C) and a small number did not, although the average values decreased significantly, with these values being greatest in the group who experienced the greatest weight loss, which is in line with these results. In other words, weight loss results in a positive change in the lipid parameters linked to obesity and this change is more extreme the more weight is lost. On average, this was based on a population with TC and TG above the optimum cut-off values (Table 1) and the changes observed were equally greater in the intervention groups (G1 and G2) than in the recognised control group (G3). Given that the changes in weight were modest, but still significant, small changes in the lipid parameters may also be expected, however it is possible that there will be no change. For this reason it was considered necessary to evaluate the number of patients who improved their lipid profile after one year using clinical significance indicators and to compare them across the 3 groups. In doing so, it was observed that, on average, there were significant positive changes after one year in all the groups, except with regard to TG in G3 (Table 3). On examining the clinical significance indicators, there were no significant differences in the percentage of patients who improved their lipid profile across the 3 groups (non-significant RR), however, there were differences when comparing changes in TG between G1 and G3 (RR: 1.42; 95% CI: 1.11–1.80; NNT=5), in line with the weight loss observed in G1. Similarly, the G1 group showed a greater percentage of change in HDL-C compared with G2 (RR: 1.32; 95% CI: 1.07–1.63; NNT=5). Therefore, weight loss after one year of follow-up is accompanied by a decrease in the level of TG and an increase in HDL-C in the group who were subject to motivational intervention with a nurse (G1), with this method being considered the best for reducing weight and improving dyslipidaemia linked to obesity. Our results coincide with those presented in the study by Vetter et al.,25 who also observed a significant increase in HDL-C and a substantial decrease in TG in the most intensive intervention.
Obesity is the most prevalent metabolic disease in developed countries19 and it results in significant cardiovascular and overall mortality rates, whether directly or due to its link to multiple cardiovascular risk factors.17 Various studies have demonstrated this relationship between obesity and cardiovascular disease and it has been estimated that 20–30% of the global cardiovascular mortality rate is attributable to excess body weight.21,22,26–28 Hence, the search for effective weight loss methods must become a priority. Our group presents two of these, which have proven to be effective for weight loss after one year of follow-up, accompanied by an improvement in dyslipidaemia linked to obesity (TG and HDL-C, with a smaller change in TC).29
In our study we can see how the groups with the greatest weight loss also have the greatest reduction in TG and increase in HDL-C, which are not proportional to the drop in TC, which confirms that the lipid parameters most associated with obesity are TG and HDL-C.
Strengths and limitationsThe main strength is that the 3 methods used to reduce weight are compared through a double-blind, randomised clinical trial, thereby reducing systematic errors and thus being able to allocate the effects measured in the intervention. Expressing the results as clinical significance indicators is clearer and helps the clinic to make decisions. With respect to the limitations, the 4 drop-outs mentioned belonged to the same group, representing 6.8%, however this was not considered to have invalidated the results. It could be argued that the motivational group intervention performed in G1 and the use of a digital platform in G2 offered sufficient novel means of participation, which may have played a part in the fact that there were no drop-outs in these 2 groups.
ConclusionsTo conclude, we can confirm that G1, with intensive, permanent treatment, presents better results than G2 and G3, although telemedicine opens up an interesting opportunity; the use of new information technologies in the field of healthcare (already accessible for almost all patients), which may produce some inferior clinical results but which are much more cost effective, could be a great help, particularly in primary care consultations.
Ethical responsibilitiesProtection of people and animalsThe authors declare that no experiments were conducted on human beings or animals for this research.
Confidentiality of dataThe authors declare that they have followed the protocols of their work site regarding the publication of patient data.
Right to privacy and informed consentThe authors declare that no patient data is contained in this article.
Conflicts of interestNo conflict of interest.
Please cite this article as: Tárraga Marcos ML, Panisello Royo JM, Carbayo Herencia JA, Rosich Domenech N, Alins Presas J, Tárraga López PJ. Efecto sobre los parámetros lipídicos de una intervención para reducir peso en pacientes con sobrepeso y obesidad. Clin Invest Arterioscler. 2017;29:103–110.