

Clinically significant macular oedema has features that are associated with a major risk of visual loss, with thickening that involves the centre of the macula, field 7 or visual deficiency, although it is unknown if these features are related to retinal thickness extension.
Material and methodsAn observational, analytical, prospective, cross-sectional and open study was conducted. The sample was divided into initial visual acuity ≥0.5, central field thickness, centre point thickness, field 7 and macular volume more than the reported 2 standard deviation mean value in eyes without retinopathy. The extension was determined by the number of the central field area equivalent thickening and these features were compared by Student's t test for independent samples.
ResultsA total of 199 eyes were included. In eyes with visual acuity of ≥0.5, the mean extension was 2.88±1.68 and 3.2±1.63 in area equivalent in eyes with visual acuity <0.5 (p=0.12). The mean extension in eyes with less than 2 standard deviation of central field thickness, centre point thickness, field 7 and macular volume was significantly lower than in eyes with more than 2 standard deviations (1.9±0.93 vs. 4.07±1.49, 2.44±1.47 vs. 3.94±1.52, 1.79±1.07 vs. 3.61±1.57 and 1.6±0.9 vs. 3.9±1.4, respectively, p<0.001).
ConclusionsThe extension of retinal thickness is related with the anatomical features reported with a greater risk of visual loss, but is not related to initial visual deficiency.
El edema macular clínicamente significativo presenta características asociadas con mayor riesgo de pérdida visual: engrosamiento que involucra el centro de la mácula, el campo 7 o baja visual inicial; sin embargo, se desconoce la relación entre estas características y la extensión del engrosamiento retiniano.
Material y métodosEstudio observacional, analítico, prospectivo, transversal y abierto. La muestra se dividió en función de la capacidad visual inicial ≥o<0.5, grosor del campo central, del punto central, campo 7 y volumen macular >2 desviaciones estándar del promedio reportado en ojos sin retinopatía. La extensión se determinó mediante el número de equivalentes de área del campo central engrosados, y se comparó con las características mediante la t de Student para medias independientes.
ResultadosCiento noventa y nueve ojos incluidos. En ojos con capacidad visual≥0.5 el promedio de extensión fue 2.88±1.68 y 3.2±1.63 equivalentes de área en ojos con < 0.5 (p=0.12). El promedio de extensión, en ojos con menos de 2 desviaciones estándar del grosor del campo central, punto central, campo 7 y volumen macular fue significativamente menor a los ojos con más de 2 desviaciones estándar (1.9±0.93 vs. 4.07±1.49, 2.44±1.47 vs. 3.94±1.52, 1.79±1.07 vs. 3.61±1.57 y 1.6±0.9 vs. 3.9±1.4, respectivamente, p<0.001).
ConclusiónLa extensión del engrosamiento retiniano se relaciona con las características anatómicas reportadas con mayor riesgo de pérdida visual, pero no se relaciona con la baja visual inicial.
The diagnosis of clinically significant macular oedema is based on characteristics related to a greater risk of developing moderate vision loss, regardless of the degree of retinopathy at the time of diagnosis.1 The prevalence of clinically significant macular oedema amounts to approximately 23% in the Mexican population.2
The characteristics described by the Early Treatment Diabetic Retinopathy Study (ETDRS) are the following: retinal thickening in the centre of the macula or within 500 microns of the adjacent retina; presence of exudate in the centre of the macula or within 500 microns of the adjacent retina, if associated with the thickening of the adjoining retina; or the presence of retinal thickening in an area (or areas) larger than a disc area, located at a distance amounting to the diameter of a disc or less in relation to the centre of the macula.3
Another characteristic not included by the ETDRS, but which has been reported as associated with a greater risk of vision loss, is the thickening involving or surrounding the centre of the fovea4 and affecting the temporal perifoveal field.5
Several studies have reported on the relation between anatomical characteristics, such as the central point thickness or the macular volume, and functional characteristics, such as visual capacity, and have determined that the correlation between these is highly variable.6–9 However, studies have not taken into account the extension of the oedema present in these patients. The use of optical coherence tomography has allowed for the objective assessment of the oedema pattern (focal or diffuse)10 and for the determination of the amount of fields affected by the thickening.11
The optical coherence tomography and the macular volume allowed for the determination of the affected area before photocoagulation and its relation to the characteristics associated with the risk of vision loss, so as to assess if result variability is related to the extension of the oedema and not only to its characteristics.
Material and methodsAn observational, analytical, prospective, cross-sectional and open study was conducted in type 2 diabetic patients with clinically significant macular oedema in Mexico City and its metropolitan area. The sample was obtained from patients who attended Hospital Juárez de México, from 1 May 2008 to 31 July 2014. The study began on 1 January and ended on 31 August 2014. It was authorised by the research and research ethics committees of the hospital in which it was conducted. All patients agreed to participate in the study by giving their written consent.
The study included type 2 diabetic patients from 40 to 80 years old, of either gender, with any degree of diabetic retinopathy and focal clinically significant macular oedema, with a fast macular map and record of the best-corrected visual acuity on the day of the treatment.
The following subjects were excluded from the study: subjects with opacity of mean limiting visual function per se (cataract, preretinal haemorrhage), thickened posterior vitreous, fluorescein angiography ischaemia, other maculopathy or retinopathy, eyes previously treated with focal photocoagulation and measurement errors in the fast macular map (any deviation from the line of optical coherence tomography compared to the actual limit of the retina).
Only one researcher diagnosed a patient with clinically significant macular oedema, according to the criteria of the ETDRS. The best-corrected visual acuity was measured under refraction, with eye charts from the ETDRS. All fast macular maps were obtained under mydriasis ≥6mm, using the optical coherence tomography equipment Stratus® (Carl Zeiss Meditec, Inc., Dublin, California, USA, software version 4.01), applying the following standardised procedure: spherical equivalent inclusion, identification of the retinal plane with an acoustic alert, scan for dark eye and optimisation of polarisation and z-axis. The maps were obtained using flash, between 9:00 and 11:00a.m.12,13 To ensure that these were centred, verification was obtained that the thinnest area was included within the central circle and that the relation between the standard deviation of the central point thickness and the central point thickness was lower than 10%.14
The sample was divided according to the characteristics identified as associated with vision loss: best-corrected visual acuity <20/40, central field thickening, temporal perifoveal field thickening and volume. The definition of central thickening, temporal perifoveal thickening and volume was the value of each of these exceeding by more than 2 standard deviations the mean found for this value in eyes without retinopathy.
The study variable was the total extension of the thickening, which was defined according to the number of thickened fields as follows: each thickened field observed in the optical coherence tomography was identified (the value of each field exceeding by more than 2 standard deviations the mean of the retinal thickness found in eyes without retinopathy in the fast macular map). The conversion of central field equivalent areas was performed (1000 microns in diameter) based on the following: field 1 – one area of central field; fields 2, 3, 4 and 5 – 0.5 areas of central field; fields 6, 7, 8 and 9 – 0.75 areas of central field. These equivalent areas were added up to obtain the total extension of the thickening.
The mean total extension was compared among related characteristics using the Student's t-test for independent mean values.
The following value was considered significant: p<0.05. Data were collected and analysed using the software Minitab, version 16.
ResultsThe study assessed 199 eyes from 154 type 2 diabetic patients, from 41 to 78 years old (average of 58.47, standard deviation [SD]±9.28), of which 119 eyes belonged to female subjects (59.8%). The progression of diabetes ranged from 1 to 30 years (average of 14.56 SD±6.78), and 86 patients were treated with oral hypoglycaemiants (55.9%) and 34 patients were treated with insulin (22%). Average fasting blood sugar levels amounted to 176.81 SD±87.05mg/dl; average glycosylated haemoglobin amounted to 10.8 SD±4.04%; average cholesterol amounted to 206.4SD±62.01mg/dl; average triglycerides amounted to 172.08 SD±93.4mg/dl; average creatinine clearance amounted to 46.9 SD±30.78mg/dl. Average systolic blood pressure amounted to 140.8 SD±21.6mm Hg; average diastolic blood pressure amounted to 84.46 SD±12.15mm Hg; and mean blood pressure amounted to 103.03 SD±14.58mm Hg.
Seventy patients suffered from high blood pressure (44.4%); 48 of these patients were treated with angiotensin converting enzyme inhibitors (31.1%). As to the degree of retinopathy: 14 patients presented mild non-proliferative retinopathy (7%); 107 patients presented moderate non-proliferative retinopathy (53.8%); 12 patients presented severe non-proliferative retinopathy (6%); and 66 patients presented proliferative retinopathy (33.2%). One hundred and twenty-four patients presented monofocal oedema (62.3%) and 75 patients presented multifocal oedema (37.7%). There were no differences among the different degrees of retinopathy and the thickening extension, the initial vision loss, and the central field and central point thickening (p>0.5).
The location of the oedema was superotemporal in 103 eyes (28.9%), inferior in 102 eyes (28.6%), temporal in 30 eyes (8.4%), superior in 27 eyes (7.6%), nasal in 27 eyes (7.6%), superonasal in 24 eyes (6.7%), inferotemporal in 9 eyes (2.5%) and inferonasal in 8 eyes (2.2%).
The initial visual capacity ranged from 0.15 to 1.00 decimal equivalents, with an average of 0.46±0.26. The average central field amounted to 217.7μm±33.2; the average central point thickness amounted to 184.6μm±33.9; and the average macular volume amounted to 7.99mm3±0.65.
The total extension ranged from 0.5 to 6 area equivalents, with an average of 3.08±1.66. In eyes with visual capacity≥0.5 (≥20/40, n=92), the average extension was 2.88±1.68 area equivalents, while in eyes with visual capacity <0.5 (<20/40), the average extension was 3.2±1.63 area equivalents (p=0.12). The central field thickness lower than 2 SD (n=91) presented an average extension of 1.9±0.93 area equivalents, while the central field thickness greater than 2 SD (n=108) presented an average extension of 4.07±1.49 area equivalents (p<0.001).
The central field thickness lower than 2 SD (n=114) presented an average extension of 2.44±1.47, while the central field thickness greater than 2 SD (n=85) presented an average extension of 3.94±1.52 area equivalents (p<0.001).
Field 7 with a thickness lower than 2 SD (n=58) presented an average extension of 1.79±1.07, while field 7 with a thickness greater than 2 SD (n=141) presented an average extension of 3.61±1.57 area equivalents (p<0.001).
The normal macular volume (n=71) presented an average extension of 1.6±0.9 area equivalents, while the macular volume with a thickness greater than 2 SD (n=128) presented an average extension of 3.9±1.4 area equivalents (p<0.001).
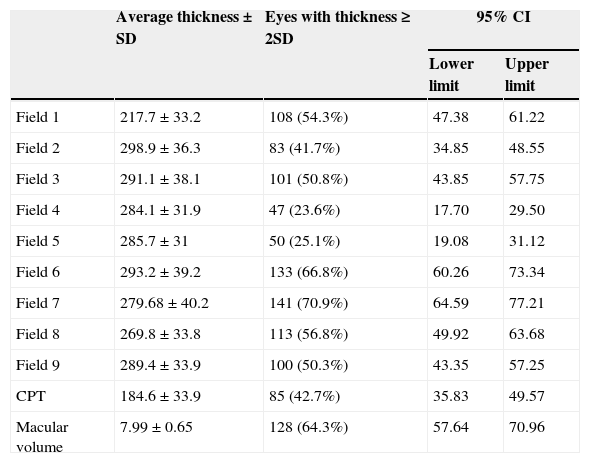
As to only the extension of field 1, there were 108 eyes with thickening greater than 2 SD (54.3%); the internal ring was affected in 135 cases (67.8%) in one or more corresponding fields; and the external ring was affected in 186 cases (93.5%) in one or more fields (Table 1).
Distribution of fields with thickening greater than 2 standard deviations in each field of the optical coherence tomography.
| Average thickness±SD | Eyes with thickness≥2SD | 95% CI | ||
|---|---|---|---|---|
| Lower limit | Upper limit | |||
| Field 1 | 217.7±33.2 | 108 (54.3%) | 47.38 | 61.22 |
| Field 2 | 298.9±36.3 | 83 (41.7%) | 34.85 | 48.55 |
| Field 3 | 291.1±38.1 | 101 (50.8%) | 43.85 | 57.75 |
| Field 4 | 284.1±31.9 | 47 (23.6%) | 17.70 | 29.50 |
| Field 5 | 285.7±31 | 50 (25.1%) | 19.08 | 31.12 |
| Field 6 | 293.2±39.2 | 133 (66.8%) | 60.26 | 73.34 |
| Field 7 | 279.68±40.2 | 141 (70.9%) | 64.59 | 77.21 |
| Field 8 | 269.8±33.8 | 113 (56.8%) | 49.92 | 63.68 |
| Field 9 | 289.4±33.9 | 100 (50.3%) | 43.35 | 57.25 |
| CPT | 184.6±33.9 | 85 (42.7%) | 35.83 | 49.57 |
| Macular volume | 7.99±0.65 | 128 (64.3%) | 57.64 | 70.96 |
SD, standard deviation; CPT, central point thickness; 95% CI, 95% confidence intervals.
The extension of the thickening was not related to vision loss prior to treatment (p<0.05). Some studies have demonstrated that, although visual acuity is the standard for functional assessment in patients with diabetic retinopathy, it may not be the best tool for its assessment in these patients, given that their correlation with anatomical changes is modest.6,15–17 There are other tools that help in the assessment of the visual function, such as microperimetry17,18 or electroretinography,19,20 which require further studies to analyse the association between the extension of the oedema and the visual dysfunction present in these patients.
The anatomical characteristics that have demonstrated to be associated with a higher risk of vision loss are areas with greater thickness, such as the following: the central field,1 the temporal perifoveal field (field 7),5 the central point and the macular volume.21 In this study, these characteristics were significantly associated with a greater extension of the thickening, as they presented an almost two-times larger extension when affected. The diabetic retinopathy clinical research network found a low correlation between the number of thickened fields prior to treatment and visual acuity (r=0.38), and a good correlation between the number of thickened fields and the central field and macular volume (0.64 and 0.77, respectively).22
Browning et al.10 have outlined the need to identify the characteristics of the macular oedema beyond the standardised classification, such as the thickening extension and location, the affection or lack of affection of the centre of the macula, among others. The determination of the thickening extension and its relation to the characteristics that favour vision loss establish a cut-off point to understand the condition of the affected eye. However, the extension does not itself justify the functional condition of the eye.
It has been reported that retinal dysfunction appears before the occurrence of anatomical changes and visual acuity reduction. Therefore, other factors that may be contributing to neural dysfunction, apart from the thickening.23,24
The optical coherence tomography is still a useful tool for the assessment of the condition and follow-up of patients with macular oedema.25 The identification of thickening areas and its extension would allow for the identification of characteristics that could be involved in patients’ prognosis. Understanding the thickening extension and its modifications after treatment could help to explain the different results obtained from patients and, thus, to identify the characteristics related to the worst prognosis.
ConclusionThe extension of the retinal thickening is related to anatomical characteristics reported as with greater risk of vision loss in patients with macular oedema. However, the extension does not itself explain the presence of low visual acuity at the moment of treatment.
Conflict of interestThe authors declare that there are no conflicts of interest.
Please cite this article as: Razo Blanco-Hernández DM, Lima-Gómez V, García-Rubio YZ. Características relacionadas con la extensión del engrosamiento retiniano en oedema macular diabético. Cir Cir. 2015;83:183–7.