


Variations in microbial communities promoted by alterations in environmental conditions are reflected in similarities/differences both at taxonomic and functional levels. Here we used a natural gradient within mangroves from seashore to upland, to contrast the natural variability in bacteria, cyanobacteria and diazotroph assemblages in a pristine area compared to an oil polluted area along a timespan of three years, based on ARISA (bacteria and cyanobacteria) and nifH T-RFLP (diazotrophs) fingerprinting. The data presented herein indicated that changes in all the communities evaluated were mainly driven by the temporal effect in the contaminated area, while local effects were dominant on the pristine mangrove. A positive correlation of community structure between diazotrophs and cyanobacteria was observed, suggesting the functional importance of this phylum as nitrogen fixers in mangroves soils. Different ecological patterns explained the microbial behavior in the pristine and polluted mangroves. Stochastic models in the pristine mangrove indicate that there is not a specific environmental factor that determines the bacterial distribution, while cyanobacteria and diazotrophs better fitted in deterministic model in the same area. For the contaminated mangrove site, deterministic models better represented the variations in the communities, suggesting that the presence of oil might change the microbial ecological structures over time. Mangroves represent a unique environment threatened by global change, and this study contributed to the knowledge of the microbial distribution in such areas and its response on persistent contamination historic events.
Mangroves are ecosystems with great ecological importance in coastal regions, where they provide a food source and breeding nurseries for many marine animals and harbor species adapted to brackish/saline environments. These environments are subjected to constant variations in temperature, salinity, oxygen content, UV radiation, and water level, making these sites a reservoir of microbial species adapted to these shifting conditions.1 Bacteria are critical components of mangrove ecosystems, occupying a wide variety of niches, and being essential to chemical processes, such as nitrogen fixation, photosynthesis and decomposition.2–4 Within the Bacteria domain, the cyanobacteria are a special group that play several roles in mangroves. They are primary producers for organic forms of carbon and nitrogen. Many cyanobacteria species provide nitrogen through biological nitrogen fixation, being an important group within the diazotrophic guild, contributing to the availability of this element to the system.5,6
The disturbance and interactions promoted by biotic and abiotic factors on microbial communities have been evaluated in an attempt to better understand the ecological drivers that govern the size and structure of these communities.7,8 Spatial and temporal evaluation of both taxonomic and functional aspects of microbiomes are the main focus in those studies. For this, high throughput sequencing and metagenomic approaches have dominated the microbial ecology scenario, however fingerprinting techniques, such as ARISA and T-RFLP, are still a rapid, low cost and result reproducible tool that allow the description of patterns of beta diversity and investigation of variations in community structures in temporal and spatial evaluations for large datasets.9 In the same way, ecological models have been extensively used to understand the microbial distribution across space and time.10–12 The processes that structure natural communities could be summarized into two classes: niche based (deterministic models) indicates that microbial community distribution is filtered by environmental factors (e.g. edaphic characteristics, or xenobiotic compounds); neutral theory (stochastic models) is based on random events including birth and death taxa, dispersal limitation of microorganisms, and historical events.10,13–15
The rapid pace of devastation and degradation of mangrove areas makes it imperative that we comprehend more about their biotic and abiotic components, especially concerning the behavior of these ecosystems over time. Although several studies have been conducted to understand the impact of contamination on mangrove microbial communities, the temporal dynamics of microbial assemblages in these systems are poorly explored.7,16,17
Here, ARISA and T-RFLP fingerprinting techniques and ecological models were applied to evaluate the shift in patterns of bacteria, cyanobacteria and diazotroph communities in transects of two contrasting mangrove ecosystems (one oil contaminated site and one pristine site) over a period of three years. In addition, ecological models allowed understanding the range of temporal variability and to better predict the effects of future anthropogenic impacts on the structure and function of the microbial communities in mangrove ecosystem.
Materials and methodsSite description and samplingThe two mangrove areas studied in this work are located in two cities in São Paulo State (Brazil); one in Cananéia (at Cardoso Island) and another in Bertioga (Fig. 1). Cardoso Island State Park is located in Cananéia, on the extreme south of the São Paulo State coast and since July 1962 it has been considered a natural reserve park. Bertioga has 8% of the total mangrove area from São Paulo State and the mangrove sampled has a history of contamination. In 1983, an oil pipeline broke and 3.5 million liters of oil spilled into the Iriri River and reached the mangrove area (for more details about these mangroves please refer to Andreote et al.).18

In these two mangroves, surface soils (0–10cm) were collected using a cylindrical steel sampler (6cm diameter) in three equidistant points along a 300m transect starting from the sea toward the land [one at the seashore (SS), one at middle area of mangrove (MM), and one near the forest (NF); Fig. 1]. Sample collection was conducted in triplicate, and the sampling site was randomly selected within the transect, annually for three years (August 2007, August 2008, and August 2009). In total, 54 soil samples constitute the dataset (two mangroves×three areas×three years×three replicates per sampling event). Soil chemical and physical data were previously presented in Rigonato et al.19
The soil samples were transferred to 50mL centrifuge plastic tubes cooled in a Styrofoam box with ice and carried to the laboratory, where they were stored at −20°C before genomic DNA extraction. Total genomic DNA was extracted from freeze-dried soil samples collected from all subsamples representing each wetland plot using the PowerSoil® DNA Isolation Kit (Mo Bio Laboratories Inc, Carlsbad, CA, USA). DNA concentration was adjusted to a standard concentration of 10ημL−1 prior the analyses.
Microbial community analysis using ARISAAutomated ribosomal intergenic spacer analysis (ARISA) was used to assess the bacteria and cyanobacteria communities based on length heterogeneity within the 16-23S rRNA intergenic spacer region as described in previous studies.20–23 Bacterial ARISA was performed as previous described by Yannarell et al.,24 using the primers 1406F (5′-6-FAM TGYACACACCGCCCGT-3′) and 23Sr (5′-GGGTTBCCCCATTCRG-3′). The amplification reaction mixture (25μL) consisted of 0.5U of GoTaq® Flexi DNA Polymerase (Promega, Madison, WI, USA), 10ηg of genomic DNA, 2μL of 10× PCR buffer, 0.4μM of each oligonucleotide primer, 250μM of each dNTPs, 3mM MgCl2, 0.25mgmL−1 BSA. The cycling conditions were: initial denaturation at 94°C for 2min, followed by 30 cycles of 94°C for 35s, 55°C for 45s, and 72°C for 2min were performed, and then the reaction mixture was kept at 72°C for 2min.
PCR for cyanobacterial ARISA was performed as previously described in Wood et al.,23 with reactions containing 0.3μM of each primer Cy-ARISA-F (5′-6-FAM-GYCAYRCCCGAAGTCRTTAC-3′) and 23S30R (5′-CHTCGCCTCTG TGTGCCWAGGT-3′), 200μM of dNTP, 1× Buffer, 1U of GoTaq® Flexi DNA Polymerase, 4mM MgCl2 and 0.6μg of BSA, in a total volume of 25μL. Amplification conditions were as follows: 94°C for 2min, as initial denaturation; 35 cycles of 94°C for 45s, 50°C for 30s, 72°C for 2min, with 7min of final extension in 72°C.
The PCR products were diluted 1:5 with sterile water and separated by capillary electrophoresis using an ABI 3730xl Genetic Analyzer (Applied Biosystems, Foster City, CA) at Roy W.M. Keck Center for Functional Genomics at the University of Illinois at Urbana-Champaign. Electrophoresis conditions were 63°C, 15kV with a run time of 120min using POP-7 polymer. A custom 100 – 1250 ROX size standard (Bioventures, Murfreesboro, TN) was used as the internal size standard for the ARISA fingerprints.
Diazotroph community analysis using T-RFLPTerminal restriction length polymorphism (T-RFLP) based on the nifH gene was carried out to characterize the community of diazotrophs in the mangroves soil samples. The methodology used was similar to that previously described by Rösch and Bothe.25 The 50μL reactions consisted of 1× PCR buffer, 100μM of each dNTP, 2mM of MgCl2, 0.5mgmL−1 of BSA, 10μM of each primer nifHF (5′ – 6-FAM-AAAGGYGGWATCGGYAARTCCACCAC) – and nifHRb – (5′ – HEX-TGSGCYTTGTCYTCRCGGATBGGCAT), and 2.5U of GoTaq® Flexi DNA Polymerase. The amplification was conducted as follows: 96°C for 20s, 1 cycle of 96°C for 20s, 65°C for 30s and 72°C for 30s, 2 cycles of 96°C for 20s, 62°C for 30s and 72°C for 35s, 3 cycles of 96°C for 20s, 59°C for 30s and 72°C for 40s, 4 cycles of 96°C for 20s, 56°C for 30s and 72°C for 45s, 35 cycles of 96°C for 20s, 54°C for 30s and 72°C for 50s, final extension of 72°C for 10min. The PCR product was purified using MinElute PCR Purification Kit and concentrated in 20μL of ultrapure water. The restriction digestion with MspI and HhaI enzymes (New England BioLabs Inc., Ipswich, MA, USA) was in a reaction of 0.75μL enzyme buffer, 10μL of PCR purified, 3.6μL of ultrapure water, 0.15μL of BSA (10mgmL−1) and 0.5μL of enzyme in a single-enzyme restriction reaction, the mixture was incubated at 37°C overnight. The digestion reaction was diluted in water (1:5) and separated by capillary electrophoresis (63°C and 15kV with a run time of 120min using POP-7 polymer), using as molecular weight marker ABI GeneScan ROX 1000 (Applied Biosystems, Foster City, CA).
Data analysisSize-calling and profile alignment for ARISA and T-RFLP were carried out using GeneMarker v. 1.75 (SoftGenetics, State College, PA, USA), where peaks greater than 200 fluorescence units and length between 300 and 1000bp were included in the ARISA analyses; while those with fluorescence units higher than 50 and length between 50 and 400bp were included in the nifH T-RFLP analyses.
The areas of selected peaks were exported and the data were normalized to relative fluorescence (dividing the area of individual peaks by the total fluorescence (area) detected in each profile). The normalized results from each T-RFLP combination of fluorescence and restriction enzyme were concatenated to a single dataset. Principal component analysis (PCoA) was undertaken using the PRIMER 6 package (PRIMER-E Ltd, Plymouth, UK), considering site collection along the transect from seashore to inland and the year of sample collection as sample classifications. Analysis of similarity (ANOSIM) based on the Bray–Curtis coefficient was performed to evaluate differences in microbial assemblages among sites (transect) and years. A two-way crossed (orthogonal) permutational analysis of variance (PERMANOVA) was used to test the effect of location and year classifications on bacterial community composition and it was run in PERMANOVA+, add-on implemented in PRIMER 6. The reported R2 value in PERMANOVA is the treatment sums of squares/total sums of squares for each factor in the model as described in Peralta et al.26 The correlations between bacteria, cyanobacteria and diazotroph patterns of beta diversity were tested by Spearman's rank correlation coefficients using PRIMER 6.
The species abundance distribution (SAD) was determined for each sample using the T-RFLP (diazotroph) and ARISA (bacteria and cyanobacteria) matrices. The log-normal model (a general model), the zero-sum model (a neutral model), and the broken-stick model (a niche-based model) were selected for analyses.15,27,28 The fitting of data to these models was performed using AIC (Akaike information criterion) set to 2(K−ln(L)), where K is the number of parameters and L is the maximum likelihood estimation of the model.15,29
These analyses were performed using the package Vegan in R and the software TeTame (http://chave.ups-tlse.fr/projects/tetame.htm). The workflow was based on the work of Dumbrell et al.15 where the likelihood function30 was used to estimate the fundamental biodiversity number θ, and the probability of immigration m, for the zero sum model.29,30 The Akaike information criterion (AIC) generated for each model was compared using the delta AIC (Δi), which indicates the differences between AIC values from best-fitted to other models, and the AIC weight (Wi) was calculated by Wi=exp−Δi2∑Rr=1exp−Δi2 to estimate the probability that a given model was the most appropriate to explain the values observed for the SAD in the dataset.31,32
ResultsThe approach used here identified 473 different ARISA peaks for total bacteria analysis, with fragment size ranging from 301 to 997bp. Similarly, the analysis for cyanobacteria captured 412 distinct peaks, with fragment size ranging from 304 to 997bp. The diazotroph community was represented by 649 peaks, comprised of all terminal restriction fragments (T-RFs) generated by the digestion of dual-labeled nifH amplicons by two endonucleases. The resulting profiles of sampled soils were characterized by a large number of distinct peaks indicating a multitude of taxonomic/functional groups. Moreover, a high reproducibility of profiles was found concerning the presence of ARISA or T-RFLP peaks from different field replicates – while the few variations among technical replicates were mostly restricted to small peaks. The community composition data revealed a well resolved pattern for all sampled soils.
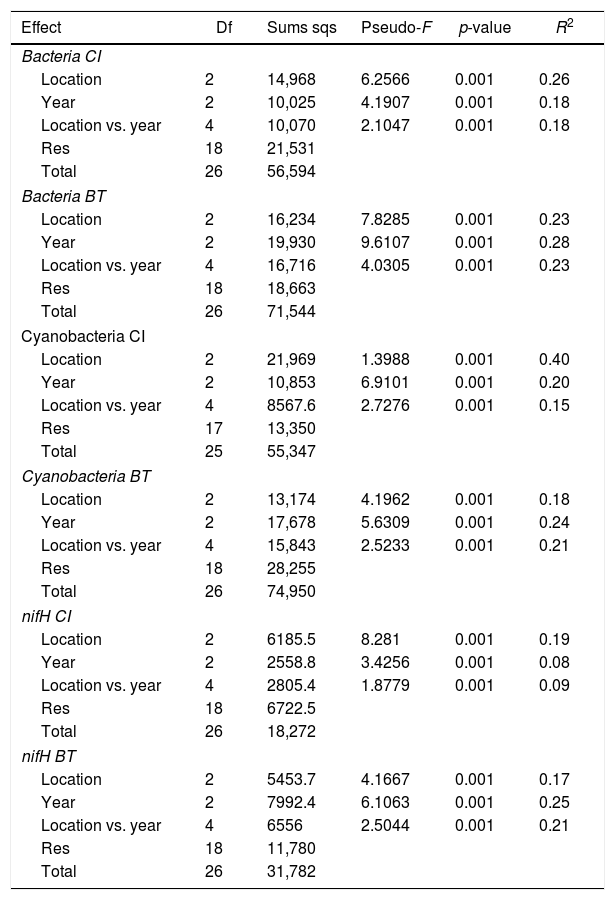
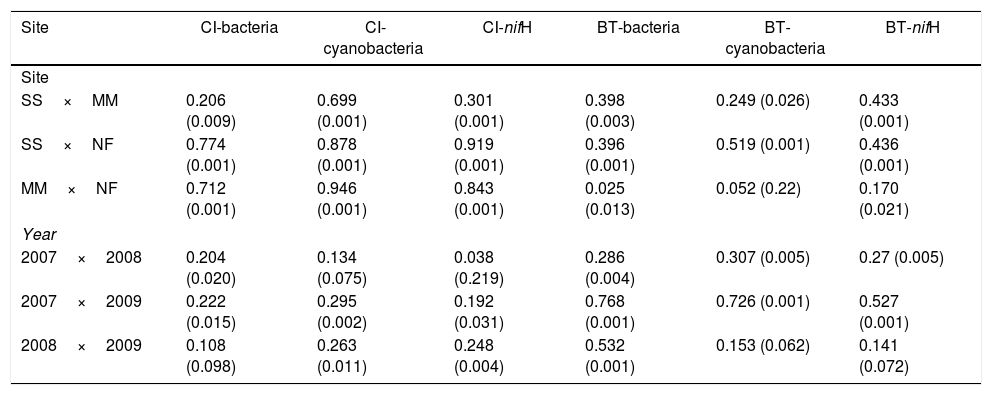
Comparison of community composition showed a significant effect of location within each mangrove and year of sampling for all the microbial communities evaluated (bacteria, cyanobacteria and diazotrophs) (Table 1). However, the importance of spatial and temporal variables for explaining patterns in community composition was distinct in each mangrove area targeted. It is clear that in the pristine mangrove (Cardoso Island) the location (site along the transect) has a more pronounced effect than time (year of sampling) on microbial community composition. This information can be visualized by PCoA, and this clustering pattern was statistically confirmed by PERMANOVA analysis (R2=0.40–0.19 for location; and R2=0.20–0.08 for year) (Fig. 2, Table 1). In this mangrove location, it was evident that the NF site holds a more distinct community compared to the other areas (MM and SS) for all the three microbial groups assessed (Fig. 2a, c, and e). The distinction among community assemblages was confirmed by ANOSIM, where high values of R were generated (ranging from 0.946 to 0.712) when comparing the groups of samples from NF against the others (Table 2).
Results from PERMANOVA testing the effect of location (seashore, middle of the mangrove, near the forest) and year (2007, 2008, 2009) on bacterial, cyanobacterial and diazotrophs communities composition in Cardoso Island (CI) and Bertioga (BT) mangroves.
| Effect | Df | Sums sqs | Pseudo-F | p-value | R2 |
|---|---|---|---|---|---|
| Bacteria CI | |||||
| Location | 2 | 14,968 | 6.2566 | 0.001 | 0.26 |
| Year | 2 | 10,025 | 4.1907 | 0.001 | 0.18 |
| Location vs. year | 4 | 10,070 | 2.1047 | 0.001 | 0.18 |
| Res | 18 | 21,531 | |||
| Total | 26 | 56,594 | |||
| Bacteria BT | |||||
| Location | 2 | 16,234 | 7.8285 | 0.001 | 0.23 |
| Year | 2 | 19,930 | 9.6107 | 0.001 | 0.28 |
| Location vs. year | 4 | 16,716 | 4.0305 | 0.001 | 0.23 |
| Res | 18 | 18,663 | |||
| Total | 26 | 71,544 | |||
| Cyanobacteria CI | |||||
| Location | 2 | 21,969 | 1.3988 | 0.001 | 0.40 |
| Year | 2 | 10,853 | 6.9101 | 0.001 | 0.20 |
| Location vs. year | 4 | 8567.6 | 2.7276 | 0.001 | 0.15 |
| Res | 17 | 13,350 | |||
| Total | 25 | 55,347 | |||
| Cyanobacteria BT | |||||
| Location | 2 | 13,174 | 4.1962 | 0.001 | 0.18 |
| Year | 2 | 17,678 | 5.6309 | 0.001 | 0.24 |
| Location vs. year | 4 | 15,843 | 2.5233 | 0.001 | 0.21 |
| Res | 18 | 28,255 | |||
| Total | 26 | 74,950 | |||
| nifH CI | |||||
| Location | 2 | 6185.5 | 8.281 | 0.001 | 0.19 |
| Year | 2 | 2558.8 | 3.4256 | 0.001 | 0.08 |
| Location vs. year | 4 | 2805.4 | 1.8779 | 0.001 | 0.09 |
| Res | 18 | 6722.5 | |||
| Total | 26 | 18,272 | |||
| nifH BT | |||||
| Location | 2 | 5453.7 | 4.1667 | 0.001 | 0.17 |
| Year | 2 | 7992.4 | 6.1063 | 0.001 | 0.25 |
| Location vs. year | 4 | 6556 | 2.5044 | 0.001 | 0.21 |
| Res | 18 | 11,780 | |||
| Total | 26 | 31,782 | |||
 on the basis of bacterial and cyanobacterial ARISA and diazotrophs T-RFLP profile from mangrove soil collected along the transect: SS, seashore; MM, middle of the mangrove; NF, near the forest. (A) Bacteria Cardoso Island; (B) Bacteria Bertioga; (C) Cyanobacteria Cardoso Island; (D) Cyanobacteria Bertioga; (E) diazotrophs Cardoso Island; (F) diazotrophs Bertioga.")
Principal component analysis (PCoA) on the basis of bacterial and cyanobacterial ARISA and diazotrophs T-RFLP profile from mangrove soil collected along the transect: SS, seashore; MM, middle of the mangrove; NF, near the forest. (A) Bacteria Cardoso Island; (B) Bacteria Bertioga; (C) Cyanobacteria Cardoso Island; (D) Cyanobacteria Bertioga; (E) diazotrophs Cardoso Island; (F) diazotrophs Bertioga.
ANOSIM analysis (R value (p)) comparing the ARISA profile of bacteria and cyanobacteria and T-RFLP of diazotrophic communities of the sampling sites and time in Cardoso Island (CI) and Bertioga (BT) mangroves.
| Site | CI-bacteria | CI-cyanobacteria | CI-nifH | BT-bacteria | BT-cyanobacteria | BT-nifH |
|---|---|---|---|---|---|---|
| Site | ||||||
| SS×MM | 0.206 (0.009) | 0.699 (0.001) | 0.301 (0.001) | 0.398 (0.003) | 0.249 (0.026) | 0.433 (0.001) |
| SS×NF | 0.774 (0.001) | 0.878 (0.001) | 0.919 (0.001) | 0.396 (0.001) | 0.519 (0.001) | 0.436 (0.001) |
| MM×NF | 0.712 (0.001) | 0.946 (0.001) | 0.843 (0.001) | 0.025 (0.013) | 0.052 (0.22) | 0.170 (0.021) |
| Year | ||||||
| 2007×2008 | 0.204 (0.020) | 0.134 (0.075) | 0.038 (0.219) | 0.286 (0.004) | 0.307 (0.005) | 0.27 (0.005) |
| 2007×2009 | 0.222 (0.015) | 0.295 (0.002) | 0.192 (0.031) | 0.768 (0.001) | 0.726 (0.001) | 0.527 (0.001) |
| 2008×2009 | 0.108 (0.098) | 0.263 (0.011) | 0.248 (0.004) | 0.532 (0.001) | 0.153 (0.062) | 0.141 (0.072) |
SS, seashore; MM, middle of the mangrove; NF, near the forest.
On the other hand, patterns of microbial community composition in the mangrove subjected to the oil spill were mainly influenced by the time (PERMANOVA R2=0.28–0.24 for year, Table 1). In this site, the effect of location (along the transect) was statistically significant, despite the low value of R2 (PERMANOVA R2=0.23–0.17 for location, Table 1), and microbial community distinctions among sampling locations within the mangrove area were not prominent in the PCoA analysis (Fig. 2b, d and f). In this contaminated mangrove, microbial communities were significantly different in all years of sampling, except for the cyanobacterial comparison for the years 2008 and 2009 (Table 2). For both bacteria and cyanobacteria, a marked dissimilarity in community composition was observed between samples collected in 2007 and 2009 (Table 2). Although secondary, there was a tendency of SS samples to contain microbial assemblages that were distinct from other locations, while MM and NF samples tended to be indistinguishable due to higher similarities in the composition of these communities (Table 2).
The comparison of nifH by the T-RFLP profiles indicated that the diazotroph community presented similar results compared to bacteria and cyanobacteria ARISA (Fig. 2e and f).
Although statistically significant in both areas, it was observed that similarity in the patterns of variation in the bacterial and cyanobacterial communities over space and time were greater in the pristine mangrove (ρ=0.577, p<0.001) than in the contaminated mangrove (ρ=0.179, p<0.001). Also, we found the expected statistically significance for correlations nifH profiles and bacterial (ρ=0.326, p<0.001) or cyanobacterial communities (ρ=0.434, p<0.001).
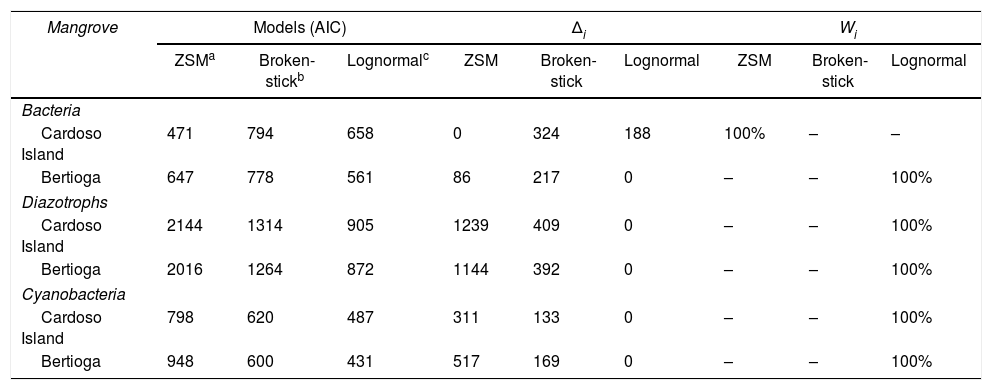
In addition to the beta diversity and statistical analyses, we examined species abundances distribution (SAD), here based on ARISA and T-RFLP peaks. Despite the importance of local environmental conditions for explaining patterns in microbial community composition in the Cardoso Island mangrove, the stochastic ecological model best fitted the total bacteria distribution in this site. This indicates that there is not a specific environmental factor that determines their distribution, rather random or probabilistic dispersion of the species are predominant in this environment. In contrast, the stronger environmental filtering in the contaminated Bertioga mangrove may lead to an increase in the number of total bacteria samples fitted in deterministic models. In both mangroves, the cyanobacteria group mostly fitted into deterministic models, and the same was also observed for the diazotroph community (Table 3).
The Akaike information criterion (AIC), delta AIC (Δi) and Akaike weights (Wi) of species abundances distribution (SAD) models fit to bacteria, cyanobacteria and diazotroph community per mangrove.
| Mangrove | Models (AIC) | Δi | Wi | ||||||
|---|---|---|---|---|---|---|---|---|---|
| ZSMa | Broken-stickb | Lognormalc | ZSM | Broken-stick | Lognormal | ZSM | Broken-stick | Lognormal | |
| Bacteria | |||||||||
| Cardoso Island | 471 | 794 | 658 | 0 | 324 | 188 | 100% | – | – |
| Bertioga | 647 | 778 | 561 | 86 | 217 | 0 | – | – | 100% |
| Diazotrophs | |||||||||
| Cardoso Island | 2144 | 1314 | 905 | 1239 | 409 | 0 | – | – | 100% |
| Bertioga | 2016 | 1264 | 872 | 1144 | 392 | 0 | – | – | 100% |
| Cyanobacteria | |||||||||
| Cardoso Island | 798 | 620 | 487 | 311 | 133 | 0 | – | – | 100% |
| Bertioga | 948 | 600 | 431 | 517 | 169 | 0 | – | – | 100% |
General model.
Δi=AICi−min AIC, where the AICi is the model tested and min AIC is the less number AIC, also considered the “best” model. Δi<2 suggests that both models fit the observed data, values between 3 and 9 indicate that the model has considerably less support, whereas a Δi>10 indicates no interaction of the model.31
The Wi (Akaike weights) indicates the probability that the model accounts for all of the models tested; in other words, values <0.75 indicate a greater than 75% chance of being the best model in comparison with others.
The structure of the bacteria and more specifically the cyanobacteria communities in mangrove soils, and the diazotroph guild, were examined along a natural gradient from seashore to upland over three years. In this study, it was possible to verify the high correlation among the microbial assemblages and their response to localities and contamination factors in both mangrove communities. Despite the fact that cyanobacteria could be addressed as a subset of total bacteria, the primers used in this study also amplified others species of bacteria.33–35 Also, it is known that cyanobacteria represent a small portion of the total bacteria community in mangrove sediment.18 These observations support our differential assessment of these communities within each analyzed sample.
The results showed that the correspondence in distribution of bacteria and cyanobacteria communities observed here indicates that the environment exerts forces that modulate both communities similarly, even though they can have different responses to ecological drivers. Olson et al.36 suggested that the association between cyanobacteria and heterotrophic bacteria in harsh environments indicates that these organisms may exchange nutrients, with cyanobacteria providing a more hospitable environment for heterotrophs by improving the availability of carbon or O2 in inundated soils. However, the low correlation observed for those groups (cyanobacteria and other bacteria) in the contaminated area suggest that the legacy of contamination may have had a different effect over of these populations.
Another point to be highlighted was the similar patterns found for cyanobacteria and the diazotroph communities, thus indicating that this nitrogen-fixing group may be better represented by cyanobacteria members, possibly assigning them as important players in the input of this nutrient on mangroves. Specifically in the contaminated mangrove, these microbes would have a key role, providing the nitrogen necessary to supplement the degradation of hydrocarbon compounds.37,38 In addition, Coimbra39 analyzed the Bertioga area in 2001 and 2005 and Lima40 in 2009. These authors reported the long-term permanence of oil in this area, mainly represented by the recalcitrant compounds of oil. In these terms, it is possible to suggest that the sequential degradation of hydrocarbons might lead to the temporal variation observed in this area.
Previous assessments reported that the spatial patterns in bacterial and cyanobacteria communities are due to local environmental conditions in the pristine mangrove located in the Cardoso Island, created by distinct physical, chemical, and macro-ecological variables along a gradient from seashore to inland in this mangrove.19,41,42 Specifically in this ecosystem – Cardoso Island mangrove – Dias et al.41 found that shifts in salinity, tidal regime, organic matter, and the availability of nutrients were responsible for variations in the bacterial community along this sea-to-inland transect. As this mangrove is located in a permanent conservation site, this ecosystem is relatively free of anthropogenic disturbances and subject only to natural variations in environmental conditions, resulting in relative temporal stability of the microbial communities.
In contrast, the oil-contaminated site harbors a microbial community that shows mainly temporal variation. Here we suggest that a gradual inoculation effect – promoted by random inoculation of microbes by the tidal regime over the years – would lead to this time-dependent composition of communities, as observed for bacterial communities, and further for cyanobacteria assemblages. In the pristine mangrove, the already-established community is more resilient to inoculation, as reflected by the relatively stable structure of its microbiome over time. In the disturbed environment this inoculation effect may be greater as the site recovers from oil contamination, resulting in an elevated temporal variation. The remarkable variation in bacterial, cyanobacterial and diazotroph communities in the Bertioga mangrove over the years of observation is an indicator that even after almost 30 years post-contamination these communities are not yet stable, demonstrating that the legacy of contamination may remain, acting as a filter for the establishment of a healthy soil microbiome. Other studies also show alterations in the bacterial, fungal, archaeal, and cyanobacterial community composition and distribution in mangroves in response to oil contamination.19,43–45
Natural areas are known to preserve low levels of alpha diversity and high levels of beta diversity of microbial communities.46 In particular, mangroves present low plant and animal diversity, but distinctions in environmental conditions, such as abiotic factors, promote microbial beta diversity along the mangrove transect. In contrast, in contaminated areas, the spreading of pollutants promotes the biotic homogenization effect of samples, acting upon an unstable resident microbiome. It resembles the pattern observed in the conversion of natural forests into pasture, promoting a biotic homogenization leading to a decrease of beta diversity.46 Together, these observations might explain the patterns observed in the present survey, especially considering the middle of the mangrove and forest sites in the contaminated Bertioga mangrove, where the beta diversity was lower compared to the seashore – as evidenced by PCoA. Rigonato et al.19 reported an increase in non-culturable cyanobacteria and the absence of Synechococcus and Prochlorococcus sequences for those locations (MM and NF Bertioga sites), corroborating the observation that the biotic homogenization in those areas may be linked with the loss of taxa adapted to pristine conditions and the increase of taxa tolerant to oil contamination.
The final approach used here indicated that the total bacterial community in the pristine mangrove fitted preferentially the stochastic ecological model. Thus, its stability in the environment might be given by a probabilistic dispersion, with unrestricted capacity of organisms to explore the environmental conditions found in this area. Also in the pristine mangrove, specific groups (cyanobacteria and diazotrophs) better fitted deterministic models. This is an indicator that abiotic and biotic interactions may be determining the behavior of specific groups in this environment. Therefore, it seems that in non-disturbed environment, or in locales with similar environmental conditions, specific guilds (cyanobacteria and diazotrophs) may present temporal dynamics different than the general community (total bacteria). In microbial ecology literature, it is suggested that generalist bacterial taxa show a regional invariance fitting on neutral theory, being regulated by migration and random genetic drift,12,47 while specialists are governs by deterministic factors.47 Likewise fungi communities may be linked to neutral theory,10 while soil characteristics may interfere the specific arbuscular mycorrhizal fungi (AMF) group indicating that deterministic process govern AFM composition.15 On the other hand, some xenobiotic conditions may be dominant factors driving the assembly of microbial communities. In the oil-contaminated mangrove, all the communities evaluated fitted in deterministic ecological models. In addition to the legacy of contamination, the microbial communities present in the environment are selected by temporal dynamics of the environment.
Notwithstanding, the present study revealed important insights about the distribution of bacteria and cyanobacteria in mangrove soil, and highlighted the legacy of oil contamination on the microbial community and community assembly. These findings enhance our understanding of the impact of contaminants affecting the ecological distribution of the microorganism in mangrove system.
Conflicts of interestThe authors declare no conflicts of interest.
J. Rigonato and T. Gumiere were recipients of doctoral fellowships from Fundação de Amparo à Pesquisa do Estado de São Paulo (FAPESP 2007/08354-5 and 2013/18529-8, respectively). M.F. Fiore would also like to thank the Conselho Nacional de Desenvolvimento Científico e Tecnológico for the research fellowship (CNPq 306607/2012-3). This study was supported by grants from the Fundação de Amparo à Pesquisa do Estado de São Paulo (FAPESP 2004/13910-6).