


Clavulanic acid is a β-lactam compound with potent inhibitory activity against β-lactamases. Studies have shown that certain amino acids play essential roles in CA biosynthesis. However, quantitative evaluations of the effects of these amino acids are still needed in order to improve CA production. Here, we report a study of the nutritional requirements of Streptomyces clavuligerus for CA production. Firstly, the influence of the primary nitrogen source and the salts composition was investigated. Subsequently, soybean protein isolate was supplemented with arginine (0.0–3.20gL−1), threonine (0.0–1.44gL−1), ornithine (0.0–4.08gL−1), and glutamate (0.0–8.16gL−1), according to a two-level central composite rotatable design. A medium containing ferrous sulfate yielded CA production of 437mgL−1, while a formulation without this salt produced only 41mgL−1 of CA. This substantial difference suggested that Fe2+ is important for CA biosynthesis. The experimental design showed that glutamate and ornithine negatively influenced CA production while arginine and threonine had no influence. The soybean protein isolate provided sufficient C5 precursor for CA biosynthesis, so that supplementation was unnecessary. Screening of medium components, together with experimental design tools, could be a valuable way of enhancing CA titers and reducing the process costs.
Clavulanic acid (CA) is a β-lactam compound with potent inhibitory activity against β-lactamases.1 These enzymes catalyze the hydrolysis of β-lactam ring in antibiotics, hence inactivating them.2 Although CA is considered an antibiotic, it has weak antibacterial activity and is ineffective if administrated alone. Therefore, CA in the form of the potassium salt is used in conjunction with β-lactamase-sensitive antibiotics such as penicillin and cephalosporin.3 Such combinations increase the effectiveness of infection treatments, which makes CA clinically and economically important.
Traditionally, CA is produced from cultures of Streptomyces clavuligerus, a filamentous aerobic bacterium belonging to the actinomycetes group.4 Although numerous studies concerning CA production have been published in recent decades,5 the process can still be improved. Strategies to enhance CA production include manipulation of bioreactor operation mode6 and conditions of agitation and aeration,7 as well as optimization of medium composition.8 Many different culture media have been reported for CA production. Recent studies have used glycerol or lipid as carbon and energy sources.9 Soybean derivatives (flour, protein isolate, and meal) have been used as sources of nitrogen.10,11 Compounds containing phosphorus and magnesium are also included in culture media used for CA production.12 Ortiz et al.13 investigated the effects of soybean flour and soybean protein isolate as primary sources of nitrogen on CA production by S. clavuligerus. Soybean flour provided the highest CA production. Teodoro et al.14 evaluated the effect of the initial concentration of the nitrogen source in the medium. A high initial nitrogen concentration (about 4.5gL−1 total N) resulted in greater release of catabolic products in the broth, inhibiting CA production. Use of an initial total N concentration of about 3.0gL−1 provided good cell growth and the highest CA production among the cultivations tested.
Some compounds are directly used to build the CA molecule and are essential for CA biosynthesis. This phenomenon has been extensively studied and is well understood. The first reaction is the condensation of precursors of C5 and C3 units.15 The C5 precursor is arginine,16 which can be synthesized from ornithine and glutamate.17 Khaleeli et al.15 showed that the C3 precursor originates from glycerol. Chen et al.18 studied the effects of feeding glycerol, ornithine and arginine on CA production in batch cultures. The combination glycerol and ornithine (molar ratio of 22:1) significantly increased CA production and provided greater stimulation of CA biosynthesis, compared to glycerol and arginine (molar ratio of 22:1). Wang et al.12 examined the effect of the addition of ornithine at different concentrations. The highest CA yield was obtained using 1.2gL−1 of ornithine. Saudagar and Singhal19 evaluated the influence of feeding with glycerol, arginine, and threonine in fed-batch cultures, finding that the two amino acids acted to stimulate CA production. Domingues et al.20 optimized the glycerol:ornithine molar ratio in the feed medium in continuous cultures using a 5L working volume bioreactor. The best molar ratio was approximately 40:1.
Progress has been made in elucidating the roles of amino acids such as ornithine, arginine, threonine, and glutamate in CA biosynthesis. However, few studies have quantitatively determined the effects of these amino acids in CA production. The aim of this study was therefore to screen several compounds involved in CA biosynthesis, using experimental design. This is a very useful tool that enables analysis not only of the effects of individual factors, but also the interactions between factors, in order to find the best conditions for the process. Firstly, cultivations were carried out in order to evaluate the influence of the primary nitrogen source and salts composition on CA production. Subsequently, the effect on CA production of supplementation of the primary nitrogen source with the amino acids arginine, threonine, ornithine, and glutamate was evaluated using experimental design and response surface analysis.
Materials and methodsMicroorganismThe strain of S. clavuligerus used in this study was purchased from the American Type Culture Collection (ATCC-27064). Vegetative cells were stored at −70°C in cryotubes with 10% (vv−1) glycerol.
Culture mediaThe seed medium had the following composition (gL−1 in distilled water), as proposed by Rosa et al.21: glycerol, 10.0; yeast extract, 1.0; bacto peptone, 10.0; malt extract, 10.0; K2HPO4, 2.5; MgSO4·7H2O, 0.75; MnCl2·4H2O, 0.001; FeSO4·7H2O, 0.001; ZnSO4·7H2O, 0.001; 3-(N-morpholino) propanesulfonic acid (MOPS) buffer, 21.0 (100mM).
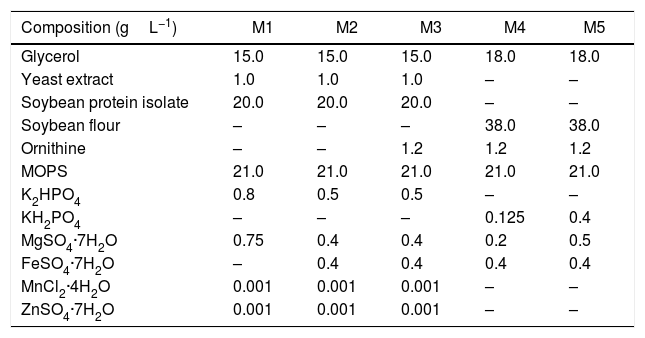
The inoculum and production media had the same composition. First, the influence of the primary nitrogen source (soybean flour – SF and soybean protein isolate – SPI) and the salts composition (FeSO4·7H2O, K2HPO4, KH2PO4, and MgSO4·7H2O) was investigated. Five different production media (M1–M5) were tested, based on those reported previously by Teodoro et al.14 and Wang et al.12Table 1 presents the media compositions (gL−1 in distilled water). Subsequently, the influence on CA production of supplementation of the primary nitrogen source with the amino acids arginine, threonine, ornithine, and glutamate was investigated using an experimental design. The M2 medium containing SPI was used as the basis for supplementation and the amounts of amino acids were altered according to the experimental design. In all cases, the pH of the medium was adjusted to 6.8, followed by autoclaving at 121°C for 15min.
Compositions of inoculum and production media M1–M5.
| Composition (gL−1) | M1 | M2 | M3 | M4 | M5 |
|---|---|---|---|---|---|
| Glycerol | 15.0 | 15.0 | 15.0 | 18.0 | 18.0 |
| Yeast extract | 1.0 | 1.0 | 1.0 | – | – |
| Soybean protein isolate | 20.0 | 20.0 | 20.0 | – | – |
| Soybean flour | – | – | – | 38.0 | 38.0 |
| Ornithine | – | – | 1.2 | 1.2 | 1.2 |
| MOPS | 21.0 | 21.0 | 21.0 | 21.0 | 21.0 |
| K2HPO4 | 0.8 | 0.5 | 0.5 | – | – |
| KH2PO4 | – | – | – | 0.125 | 0.4 |
| MgSO4·7H2O | 0.75 | 0.4 | 0.4 | 0.2 | 0.5 |
| FeSO4·7H2O | – | 0.4 | 0.4 | 0.4 | 0.4 |
| MnCl2·4H2O | 0.001 | 0.001 | 0.001 | – | – |
| ZnSO4·7H2O | 0.001 | 0.001 | 0.001 | – | – |
A two-level central composite rotatable design (CCRD) and response surface methodology22 were employed in this study. Previous reports12,16,18,19 indicated that arginine, threonine, ornithine, and glutamate significantly affect CA biosynthesis. In this study, these amino acids were chosen as the independent variables, denoted x1, x2, x3, and x4. The response variable was the CA concentration. A second order polynomial was used to calculate the predicted response (Eq. (1)).
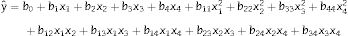
In Eq. (1), yˆ represents the predicted response; b0 is the intercept; b1, b2, b3, and b4 are the linear terms; b11, b22, b33, and b44 are the quadratic terms; b12, b13, b14, b23, b24, and b34 are the interaction terms; and x1, x2, x3, and x4 are the independent variables studied.
A total of 26 experiments were carried out, with 16 factorial points, 8 axial points (α=2), and 2 central points. Statistica (version 7.0) software was used for the regression and for constructing the response surface for analysis of the experimental data.
Cultivation procedureVegetative cell suspensions kept in cryotubes (3.5mL) were inoculated into 50mL of seed medium in 500mL Erlenmeyer flasks, followed by incubation in a rotary shaker (New Brunswick Scientific) at 27°C and 250rpm for 24h. Erlenmeyer flasks (250mL) containing 22.5mL of inoculum medium were inoculated with 2.5mL of the cultivated seed broth and incubated at 27°C and 250rpm for 24h. In the production stage, the inoculum suspensions were transferred (using a proportion of 10% vv−1) to 250mL Erlenmeyer flasks containing 22.5mL of production medium, followed by incubation at 27°C and 250rpm for 72–84h. The M1–M5 cultivations were performed in duplicate, with samples (1mL) being withdrawn at 48, 60, 72, and 84h. In the factorial design runs, samples were only removed at 72h. The samples were centrifuged at 3720×g for 15min to obtain a clear supernatant for CA analyses.
Determination of clavulanic acid concentrationThe CA concentration in the fermentation broth was determined spectrophotometrically, as described by Bird et al.23 A volume of 0.4mL of sample was added to 2.0mL of imidazole solution (60gL−1 and pH 6.8). After a 15min period at 30°C, the derivative produced by the reaction between CA and imidazole was detected at 311nm. The standard used was CA contained in the pharmaceutical product Clavulin® (Glaxo-SmithKline Farmacêutica, Rio de Janeiro, Brazil).
ResultsInfluence of primary nitrogen source and salts compositionFirstly, in order to evaluate the effects of the primary nitrogen source and the salts composition, cultivations were carried out using the five production media (M1–M5). The time courses of CA production (CCA) are shown in Fig. 1. The M1 medium was based on that proposed by Teodoro et al.,14 in which SPI was used as the primary nitrogen source. The M2 and M3 media were similar to M1, but with modification of the salts composition. The M4 medium was the same as the one used by Wang et al.,12 containing SF as the primary nitrogen source, while the M5 medium had an altered salt composition, compared to M4. The total nitrogen concentration was the same in all the media. The highest and lowest maximum CA production (CCAmax) in the broth were obtained after 60h in M2 (437mgL−1) and 48h in M1 (41mgL−1), respectively. The main difference between the compositions of the media used in these assays was the presence of ferrous sulfate in M2, which indicated the importance of this salt for CA biosynthesis. CCAmax in M2 was 1.34-fold higher than in M3 (325gL−1), which contained ornithine. With respect to primary nitrogen sources tested, SPI supported higher CA production than SF present in M4 (CCAmax=317mgL−1) and M5 media (CCAmax=196mgL−1). In contrast, the CA production remained steady for longer in M4 and M5.
Quantitative effects of amino acids supplementation for cultivations with the M1, M2, M3, M4, and M5 media.")
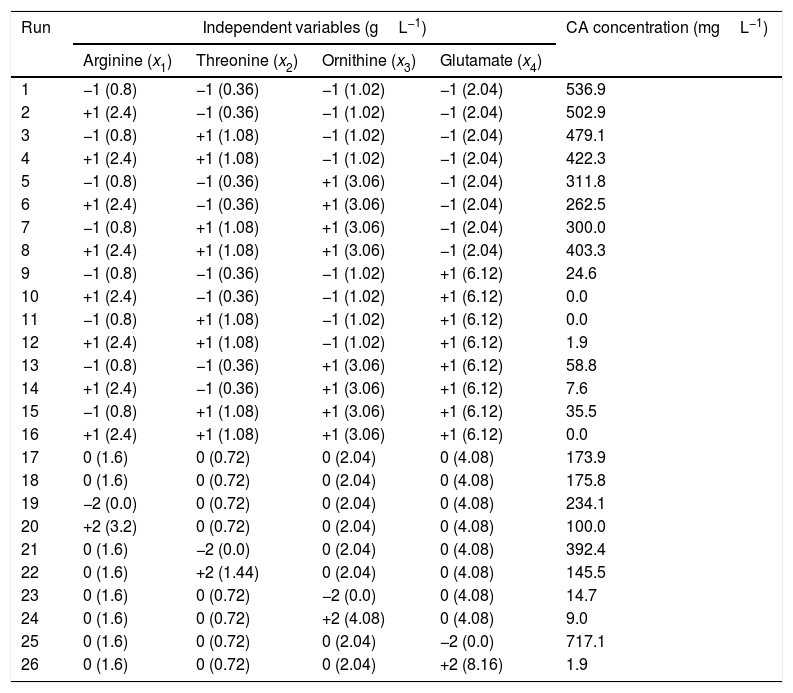
Since the highest CCAmax was achieved in the M2 medium, which contained SPI as primary nitrogen source, M2 was chosen as the basis for supplementation with amino acids, according to the experimental design. Table 2 summarizes the two-level four-factor CCRD, with the ranges and levels of the independent variables (arginine, threonine, ornithine, and glutamate) and the corresponding CA concentrations after 72h of cultivation (response variable). The runs were conducted randomly in order to minimize errors in the experimental design. The results shown in Table 2 were used to evaluate the effects of the variables on the CA concentration and obtain the regression coefficients for the second order polynomial model. Statistica software (version 7.0) was employed for these analyses, adopting a 95% confidence level.
Ranges and levels of the independent variables, in coded and original units, according to the two-level four-factor CCRD, and results of CA concentration after 72h of cultivation.
| Run | Independent variables (gL−1) | CA concentration (mgL−1) | |||
|---|---|---|---|---|---|
| Arginine (x1) | Threonine (x2) | Ornithine (x3) | Glutamate (x4) | ||
| 1 | −1 (0.8) | −1 (0.36) | −1 (1.02) | −1 (2.04) | 536.9 |
| 2 | +1 (2.4) | −1 (0.36) | −1 (1.02) | −1 (2.04) | 502.9 |
| 3 | −1 (0.8) | +1 (1.08) | −1 (1.02) | −1 (2.04) | 479.1 |
| 4 | +1 (2.4) | +1 (1.08) | −1 (1.02) | −1 (2.04) | 422.3 |
| 5 | −1 (0.8) | −1 (0.36) | +1 (3.06) | −1 (2.04) | 311.8 |
| 6 | +1 (2.4) | −1 (0.36) | +1 (3.06) | −1 (2.04) | 262.5 |
| 7 | −1 (0.8) | +1 (1.08) | +1 (3.06) | −1 (2.04) | 300.0 |
| 8 | +1 (2.4) | +1 (1.08) | +1 (3.06) | −1 (2.04) | 403.3 |
| 9 | −1 (0.8) | −1 (0.36) | −1 (1.02) | +1 (6.12) | 24.6 |
| 10 | +1 (2.4) | −1 (0.36) | −1 (1.02) | +1 (6.12) | 0.0 |
| 11 | −1 (0.8) | +1 (1.08) | −1 (1.02) | +1 (6.12) | 0.0 |
| 12 | +1 (2.4) | +1 (1.08) | −1 (1.02) | +1 (6.12) | 1.9 |
| 13 | −1 (0.8) | −1 (0.36) | +1 (3.06) | +1 (6.12) | 58.8 |
| 14 | +1 (2.4) | −1 (0.36) | +1 (3.06) | +1 (6.12) | 7.6 |
| 15 | −1 (0.8) | +1 (1.08) | +1 (3.06) | +1 (6.12) | 35.5 |
| 16 | +1 (2.4) | +1 (1.08) | +1 (3.06) | +1 (6.12) | 0.0 |
| 17 | 0 (1.6) | 0 (0.72) | 0 (2.04) | 0 (4.08) | 173.9 |
| 18 | 0 (1.6) | 0 (0.72) | 0 (2.04) | 0 (4.08) | 175.8 |
| 19 | −2 (0.0) | 0 (0.72) | 0 (2.04) | 0 (4.08) | 234.1 |
| 20 | +2 (3.2) | 0 (0.72) | 0 (2.04) | 0 (4.08) | 100.0 |
| 21 | 0 (1.6) | −2 (0.0) | 0 (2.04) | 0 (4.08) | 392.4 |
| 22 | 0 (1.6) | +2 (1.44) | 0 (2.04) | 0 (4.08) | 145.5 |
| 23 | 0 (1.6) | 0 (0.72) | −2 (0.0) | 0 (4.08) | 14.7 |
| 24 | 0 (1.6) | 0 (0.72) | +2 (4.08) | 0 (4.08) | 9.0 |
| 25 | 0 (1.6) | 0 (0.72) | 0 (2.04) | −2 (0.0) | 717.1 |
| 26 | 0 (1.6) | 0 (0.72) | 0 (2.04) | +2 (8.16) | 1.9 |
The Pareto diagram shown in Fig. 2 illustrates the influence of the independent variables on the CA concentration, considering the effects of linear (l) and quadratic (q) terms. The horizontal bars show the magnitudes of the effects and the vertical line (p=0.05) indicates the limit above which an effect was considered statistically significant. It can be seen that CA production was significantly influenced by glutamate and ornithine. The linear effect of glutamate was most important in reducing the CA concentration. Although the quadratic term for glutamate showed a positive effect, the negative effect of the linear term was considerably higher. Ornithine also had a negative effect on CA production.

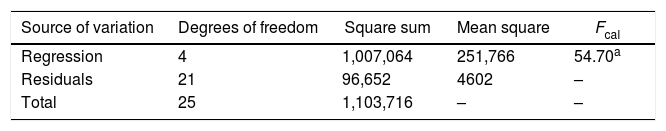
Statistical evaluation of the significance of the fitted model was performed using analysis of variance (ANOVA), with the results shown in Table 3. This analysis was carried out using the F-test to determine the quality of the fit and the associated probability p-value. Calculation of the determination coefficient (R2) provided a measure of the extent of variation (using the regression equation). The ANOVA results revealed that the model was statistically significant (at the 95% confidence level) and was able to satisfactorily describe the data, since the calculated F value (54.70) was higher than the tabulated value (2.84). The coefficient of determination (R2=0.9124) was also satisfactory, indicating that 91.24% of the variation in the CA concentration could be explained. The observed and predicted CA concentrations are shown in Fig. 3.
Analysis of variance for the regression model of CA production.
| Source of variation | Degrees of freedom | Square sum | Mean square | Fcal |
|---|---|---|---|---|
| Regression | 4 | 1,007,064 | 251,766 | 54.70a |
| Residuals | 21 | 96,652 | 4602 | – |
| Total | 25 | 1,103,716 | – | – |
.")
Eq. (2) shows the second order regression equation with the estimated coefficients. The model was simplified by the elimination of statistically insignificant terms. The independent variables x3 (ornithine) and x4 (glutamate) are expressed as their coded values and the CA concentration values at 72h of cultivation are expressed in mgL−1.

The response surface method consists of the association of the independent and dependent variables of a model in the form of a surface graph. This method was used to identify the best conditions for amino acid supplementation of the primary nitrogen source, maximizing CA production. Fig. 4 shows the response surface for CA concentration as a function of the concentrations of the amino acids ornithine and glutamate. The most evident feature was the decrease in CA yield at higher glutamate concentrations. The model predicted a maximum CA concentration when the glutamate concentration was minimal. The distorted contours associated with the axes of ornithine and glutamate suggested interaction between these two parameters.
Discussion
The substantial difference between the CCAmax values in M1 and M2 media indicated the importance of the ferrous sulfate for CA biosynthesis, as mentioned by Wang et al.12 The CA biosynthesis employs l-arginine (C5-precursor) and d-glyceraldehyde 3-phosphate (C3-precursor) in nine catalyzed reactions, as shown in Fig. 5. The conversion of N-glycylclavaminic acid to clavaldehyde (step 8) is the only reaction for which the enzyme has not yet been characterized. Six enzymes are known to catalyze the other eight steps. Five monofunctional enzymes catalyze steps 1, 2, 4, 7, and 9, while one multifunctional enzyme, clavaminate synthase (cas, EC 1.14.11.21), catalyzes steps 3, 5, and 6. Clavaminate synthase is a nonheme Fe2+-dependent enzyme present as two isoforms in S. clavuligerus.24,25 The iron dependency of this essential enzyme in the CA biosynthesis explains the improvement in CA production observed when the medium was enriched with ferrous sulfate.

CA biosynthetic pathway starting from C3 and C5 precursors. Solid lines represent steps catalyzed by known enzymes; the broken line indicates the step for which no enzyme has yet been characterized. ceaS, carboxyethylarginine synthase; gcaS, glycylclavaminate synthase; bls, β-lactam synthetase; cas, clavaminate synthase; pah, proclavaminate amidinohydrolase; cad, clavaldehyde dehydrogenase.
The lower CCAmax value achieved in M3 (containing ornithine) compared to M2 contrasts with the findings of Chen et al.,18 who reported that CA production could be enhanced by adding ornithine to a batch culture. In M4, CCAmax (317mgL−1) was lower than those reported by Wang et al.12 (670mgL−1) using the same medium. An explanation for this difference lies in the cultivation procedures used and the media employed for strain preservation and propagation.27,28 According to Mayer and Deckwer,29 the presence of soybean flour particles in the medium might induce the production of extracellular proteases by S. clavuligerus. These proteases maintained the degradation of soybean flour during the growth phase, providing a steady supply of essential nutrients to the microorganism. This explains the maintenance of the CA production steady for longer in M4 and M5 relative to M2.
With respect to experimental design results, in the biosynthetic pathway in S. clavuligerus (Fig. 6), glutamate can be converted to 2-oxoglutarate, which enters the citric acid cycle. The conversion is catalyzed by a glutamate dehydrogenase and releases ammonium (see Fig. 6), which inhibits CA biosynthesis30 and induces CA degradation,31 hence explaining the negative influence of glutamate on CA production. Although the glycerol supply was high, supplementation with C5 precursors (arginine, ornithine, and glutamate) did not result in any increase in CA production. This could be attributed to possible overload of the capacity of carboxyethylarginine synthase (CeaS2) to process the substrates. In such a scenario, the soybean protein isolate would provide sufficient arginine (as a C5 precursor) for the enzyme dosage in the cell, making supplementation unnecessary under the selected production conditions. The commercial soybean protein isolate used in this study (Nutrisoy Alimentos) contained arginine (8.0% w/w), threonine (3.6% w/w), and glutamate (20.4% w/w), which reinforces this assumption.

CA biosynthetic pathway in S. clavuligerus showing the conversion of glutamate to 2-oxoglutarate, which causes the release of ammonium.
The findings demonstrated that ferrous sulfate should be included in the composition of fermentation media used for CA production, because the enzymes involved in CA biosynthesis are Fe2+-dependent. In contrast, according to the results of the experimental design, supplementation of media containing soybean protein isolate with amino acids (arginine, threonine, ornithine, and glutamate) is unnecessary, since the isolate provides enough C5 precursor (arginine) for CA biosynthesis, under the conditions tested. This study simultaneously investigated the influence of several medium constituents in order to determine the best formulation for CA production by S. clavuligerus. This approach is especially important for maximizing CA yields, as well as for reducing the cost of fermentative production of CA.
Conflicts of interestThe authors declare no conflicts of interest.
The authors would like to thank Coordination for the Improvement of Higher Education Personnel (CAPES, Brazil) and the National Council for Scientific and Technological Development (CNPQ, Brazil, Process Number 471848/2013-1) for financial support of this work.