


Dikarya is a subkingdom of fungi that includes Ascomycota and Basidiomycota. The gene expression patterns of dikaryon are poorly understood. In this study, we bred a dikaryon DK13×3 by mating monokaryons MK13 and MK3, which were from the basidiospores of Pleurotus ostreatus TD300. Using RNA-Seq, we obtained the transcriptomes of the three strains. We found that the total transcript numbers in the transcriptomes of the three strains were all more than ten thousand, and the expression profile in DK13×3 was more similar to MK13 than MK3. However, the genes involved in macromolecule utilization, cellular material synthesis, stress-resistance and signal transduction were much more up-regulated in the dikaryon than its constituent monokaryons. All possible modes of differential gene expression, when compared to constituent monokaryons, including the presence/absence variation, and additivity/nonadditivity gene expression in the dikaryon may contribute to heterosis. By sequencing the urease gene poure sequences and mRNA sequences, we identified the monoallelic expression of the poure gene in the dikaryon, and its transcript was from the parental monokaryon MK13. Furthermore, we discovered RNA editing in the poure gene mRNA of the three strains. These results suggest that the gene expression patterns in dikaryons should be similar to that of diploids during vegetative growth.
Dikaryon is a unique organism in which each compartment of a hypha contains two haploid nuclei, each derived from a different parent. It consists of a subkingdom of fungi Dikarya, including Ascomycota and Basidiomycota. A dikaryon strain is formed by mating two compatible monokaryon strains, resulting in plasmogamy but not karyogamy in the fused compartment. When new hyphae grow, the two nuclei synchronously divide, and each new compartment keeps two nuclei1; karyogamy only occurs before the initiation of sexual reproduction. This sexual reproduction mode was distinctly different from that in diploids. The interaction between the genetic materials of the two nuclei in dikaryons has not been well characterized. Are the modes of gene action in dikaryons the same as that in diploids during vegetative growth?
The major types of gene expression patterns found in diploids during vegetative growth are mitotic crossover or mitotic recombination,2,3 DNA methylation and gene silencing by RNAi,4 monoallelic expression (sex chromosome inactivation, imprinted gene expression, or autosomal random monoallelic expression),5 RNA-editing,6 and differential allele expression in hybrids and parents that contributes to heterosis,7 etc. Mitotic recombination (also named parasexuality in fungi), DNA methylation and gene silencing by RNAi were also found in dikaryons,8–10 while monoallelic expression and RNA-editing have not been identified in the dikaryon. Although not strictly true for all reported species, in terms of the growth rate, enzyme activity and pathogenicity, diploids have a significant advantage over their parental haploids, which is similar to what is exhibited when dikaryons are compared to their parental monokaryons. It was proposed that the heterosis in diploids resulted from the allele gene differential expression in hybrids and their parents, such as presence/absence variation and additive/non-additive (high- and low-parent dominance, underdominance, and overdominance) gene expression.11–14 The mechanism of heterosis in dikaryons remains obscure.
An effective approach for exploring the allele gene differential expression in dikaryons is the comparison of soluble protein profiles or isoenzyme patterns between a dikaryon and its constituent monokaryons. The soluble protein profile of Schizophyllum commune dikaryon was dramatically different from that of its parental monokaryons, and there are many new bands in the dikaryon15; further studies showed that 14 out of 15 isoenzyme patterns changed between the dikaryon and two monokaryons.16 Similar results were also reported in other basidiomycetes, such as Coprinus congregatus17 and Coprinopsis cinerea.18 Those studies indicated that alleles had different expression patterns in dikaryons and monokaryons. However, subsequent studies found no such difference in higher basidiomycetes and suggested that those reported differences were probably caused by growth conditions and the electrophoresis procedure.19,20 Since then, many other observations have confirmed such findings. For example, comparing S. commune monokaryons and the dikaryon, protein two-dimensional gel electrophoresis showed only 6.6% and 7.7% differences,21 and the sequence complexities and coding properties of polysomal RNA and total RNA had no detectable difference.22,23 Nevertheless, using gene expression profiling, the relative differences in the transcription quantity of the 12 laccase genes in the Pleurotus ostreatus dikaryon and its two parental monokaryons showed that the dikaryotic superiority in laccase activity was due to non-additive transcriptional increases in two genes.24 Genome-wide gene expression pattern analysis of dikaryons and their parental monokaryons has not been reported.
Oyster mushroom P. ostreatus (Jacq. Fr) Kumm. is a white rot basidiomycete that is an important edible and medical mushroom,25–27 and it has been studied as a model organism for basidiomycete genetics and genomic studies.24 In this study, we compared the genome-wide transcriptional profiles among the dikaryon and its two constituent monokaryons of P. ostreatus by Solexa-based RNA-Seq with a focus on the transcriptomic profiling difference analysis between the dikaryon and monokaryons, investigation of the mechanisms of the advantages of sexual reproduction, monoallelic expression, and RNA-editing in dikarya.
Materials and methodsStrains and culture conditionsMonokaryons MK13 and MK3 were from the basidiospores of P. ostreatus TD300, which is a commercial cultivation strain in China and was obtained from Zhengzhou Composite Experiment station, China Edible Fungi Research System (Zhengzhou, China). The mycelial growth rate of MK3 was faster than MK13 on potato dextrose agar (PDA) plates (Fig. 1). Dikaryon DK13×3 was from MK13 and MK3 through A1B1 and A2B2 mating, as identified using mating tests.28 DK13×3 grew faster than its constituent monokaryons in PDA and formed normal fruiting bodies with a biological efficiency that was similar to TD300 in cottonseed hull medium (Fig. 2). The three strains were cultured in potato dextrose broth (150mL in a 500-mL flask) at 25°C under 150rpm shaking; mycelia were harvested in the late exponential phase (10 and 25 days of culturing for dikaryon and monokaryons, respectively) for DNA or total RNA extraction.

Mycelial growth of the monokaryons and reconstituted dikaryon of Pleurotus ostreatus on PDA plates. MK13, monokaryon; MK3, monokaryon; DK13×3, dikaryon; TD300, dikaryon and the two monokaryons’ parent; MGR, mycelial growth rate. Data are given as the means and SE of four replicates. Data with the same lower case letter do not significantly differ from other data at p<0.05.

Mycelia were isolated from culture broth by centrifugation at 5000×g for 10min; 100g of fresh mycelia was homogenized in liquid nitrogen; and total RNA was extracted using an RNA pure total RNA fast isolation kit (Bioteke, Beijing, China). The total RNA was used for RT-PCR or enrichment of mRNA (poly(A)+RNA) with a Dynabeads mRNA Purification Kit (Invitrogen, Grand Island, NY), and mRNA was then broken into short fragments. Using these short fragments as templates, first- and second-strand cDNA were synthesized. Sequencing adapters, which also served as sample markers, were ligated to short fragments after purification with a QiaQuick PCR Extraction Kit (Qiagen, Hilden, Germany). Fragments that were 200–700bp were then separated by agarose gel electrophoresis and selected for PCR amplification as sequencing templates. The three strain libraries were sequenced using Illumina HiSeq™ 2000 by the Beijing Genome Institute (BGI) (Shenzhen, China).
Sequencing reads filteringRaw reads contained low-quality, adaptor-polluted and high contents of unknown base (N) reads, and these noise reads should be removed before downstream analyses. We used internal software to filter reads. After filtering, the remaining reads were called “Clean Reads” and stored in the FASTQ format.
De novo assembly and sequencing assessmentContigs were assembled from clean reads using a de novo assembler Trinity29; then, non-redundant unigene sets for all three strains were constructed using the EST assembly program TGICL.30 An all-unigene set was produced from the three contig datasets by further sequence overlap splicing and non-redundancies.
Genome mapping and gene expression analysisClean reads were mapped to the reference genome sequence of Pleurotus ostreatus PC15 (http://genome.jgi-psf.org/PleosPC15_2/PleosPC15_2.home.html) using Bowtie231; then, the gene expression level was calculated using RSEM.32
Differential unigene expression analysisThe unigene expression levels were calculated using the Reads per kb per Million reads (RPKM) method.33 Under the null hypothesis of equal expression between two samples, the following test gives the p-values for identifying differentially expressed genes (DEGs) between two samples.34
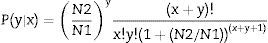
N1 is the total number of clean tags in MK3 or MK13; N2 is the number in DK13×3; x is the number of the clean tags of the target gene in MK3 or MK13, and y is the number in DK13×3. p≤0.001 and |log2Ratio|≥1 were used as the threshold to filter DEGs.
The DEGs expressed in all three strains were used to estimate the mid-parent expression value (MPV). The MPV was calculated by averaging the expression level of the parental monokaryons, assuming an (MK3:MK13) ratio of RNA abundance in the nucleus of Dikaryon DK13×3 of 1:1, as described elsewhere.35
Cloning and sequencing of the urease geneTo validate the gene expression profiles obtained by RNA-seq, urease gene poure of the monokaryons and dikaryon was cloned, amplified, and sequenced. Cloning was performed by colony direct PCR36 using primers POU1 (GCATTTTGATTGGCAGGGT) and POU2 (AGTGATTACGGCAGGGCG) at PCR conditions of 94°C for 30s, 51°C for 40s, and 72°C for 3min, which were repeated 31 times. mRNAs were amplified using RT-PCR with primers POU3 (TTACCGAGGGAAGAAGCGAA) and POU4 (GGTGGTGACAGAAACGGGAGTA), and PCR conditions were set at 94°C for 30s, 52°C for 40s, and 72°C for 2min, which was repeated 31 times. The PCR products of DNA and mRNA were purified and were then cloned into the pGEM-T Vector (Promega, Madison, WI, USA). The vectors were transformed into E. coli DH5α, and five transformants were randomly selected and sequenced by the Beijing Genome Institute (BGI) (Shenzhen, China).
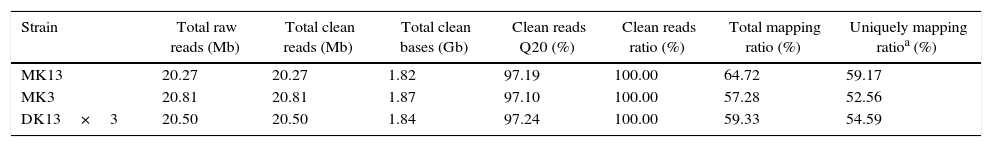
ResultsQuality assessment of RNA-seq datasets and mapping of the reference genomeTable 1 lists the statistics of the reads. The RNA-seq reads were of high quality; almost all mRNA fragments were sequenced, and 97% of the reads had a Phred quality score greater than 20. We mapped clean reads to the reference genome sequence of Pleurotus ostreatus PC15 (http://genome.jgi-psf.org/PleosPC15_2/PleosPC15_2.home.html) using HISAT.37 On average, 60.44% of reads are mapped, and the uniformity of the mapping result for each sample suggests that the samples are comparable. The GenBank accession number for the RNA-seq datasets of the three strains is BioProject Accession: PRJNA326297.
Throughput and quality of RNA-Seq of the dikaryon and its constituent monokaryons of Pleurotus ostreatus.
| Strain | Total raw reads (Mb) | Total clean reads (Mb) | Total clean bases (Gb) | Clean reads Q20 (%) | Clean reads ratio (%) | Total mapping ratio (%) | Uniquely mapping ratioa (%) |
|---|---|---|---|---|---|---|---|
| MK13 | 20.27 | 20.27 | 1.82 | 97.19 | 100.00 | 64.72 | 59.17 |
| MK3 | 20.81 | 20.81 | 1.87 | 97.10 | 100.00 | 57.28 | 52.56 |
| DK13×3 | 20.50 | 20.50 | 1.84 | 97.24 | 100.00 | 59.33 | 54.59 |
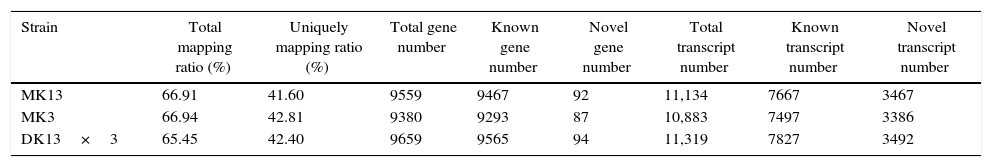
After genome mapping, we used StringTie38 to reconstruct transcripts, and with genome annotation information, we can identify novel transcripts in our samples using cuffcompare, a tool of cufflinks.39 In total, we identified 4261 novel transcripts. Then, we merged novel coding transcripts with the reference transcript to obtain a complete reference, mapped clean reads using Bowtie2,40 and calculated the gene expression level for each sample with RSEM.41 Thereupon, the total mapping ratios of the clean reads in the transcriptomes of the three strains were increased. Total transcript numbers were all more than ten thousand (Table 2).
Summary of gene expression in the dikaryon and its constituent monokaryons of Pleurotus ostreatus.
| Strain | Total mapping ratio (%) | Uniquely mapping ratio (%) | Total gene number | Known gene number | Novel gene number | Total transcript number | Known transcript number | Novel transcript number |
|---|---|---|---|---|---|---|---|---|
| MK13 | 66.91 | 41.60 | 9559 | 9467 | 92 | 11,134 | 7667 | 3467 |
| MK3 | 66.94 | 42.81 | 9380 | 9293 | 87 | 10,883 | 7497 | 3386 |
| DK13×3 | 65.45 | 42.40 | 9659 | 9565 | 94 | 11,319 | 7827 | 3492 |
We then calculated the read coverage and read distribution on each detected transcript. The Pearson correlation between the transcriptomes of the three strains was obtained. The Pearson correlations of the dikaryon DK13×3 to its constituent monokaryons, MK13 and MK3, were 0.8523 and 0.8100, respectively, while the Pearson correlation between the two monokaryons was 0.8124, indicating that the expression profile in DK13×3 was more similar to MK13 than MK3 (Fig. 3).
Gene expression difference between the three strains
The total RPKMs of the unigenes in MK13, MK3 and DK13×3 were 559494, 550716, and 586583. The total RPKMs of the unigenes in DK13×3 were 4.8% and 6.5% higher than those in MK13 and MK3 (p<0.05) (Fig. 4). Among the unigenes between DK13×3 and MK13 or MK3, the common unigenes of the three strains were 27.6%, the common unigenes for DK13×3 and MK13 were 10.8%, and the common unigenes for DK13×3 and MK3 were 11.3%. The special unigenes in DK13×3, MK13 and MK3 were 13.5%, 17.6%, and 15.5%, respectively. Up to 38% of unigenes in DK13×3 were derived from its parental monokaryons (Fig. 5), indicating that the gene expression pattern of present/absent variation occurred among the three strains, and more than one-third of the DEGs in the dikaryon were monoallelic expression genes.

Comparison of the unigene expression levels between MK3 or MK13 and DK13×3. Up-regulated genes, down-regulated genes, and NOT DEGs were determined using a threshold of p≤0.001 and |log2Ratio|≥1. A, MK3 vs DK13×3; B, MK13 vs DK13×3; NOT DEGs, Unigenes were not obviously changed upon MK3 or MK13 to DK13×3.

Using p≤0.001 and |log2Ratio|≥1 as the standard to screen the differentially expressed genes (DEGs) between DK13×3 and MK13 or MK3, compared to MK13, the number of genes whose expression levels were up-regulated in DK13×3 was 11323; 7953 were up-regulated more than 3-fold, and 114 were up-regulated more than 15-fold. Additionally, 8421 genes were down-regulated; 2573 were down-regulated more than 3-fold, while none were down-regulated more than 15-fold (Fig. 6A). Compared to MK3, the number of genes whose expression was up-regulated in DK13×3 was 11578; 7787 were up-regulated more than 3-fold, and 116 were up-regulated more than 15-fold. Furthermore, 7425 genes were down-regulated; 2176 were down-regulated more than 3-fold, and 1 was down-regulated more than 15-fold (Fig. 6B). The results suggest that the number of up-regulated genes in the dikaryon was much higher than that of down-regulated genes, especially compared to the constituent monokaryons.
 or MK3 (B). RPKM, reads per kb per million reads.")
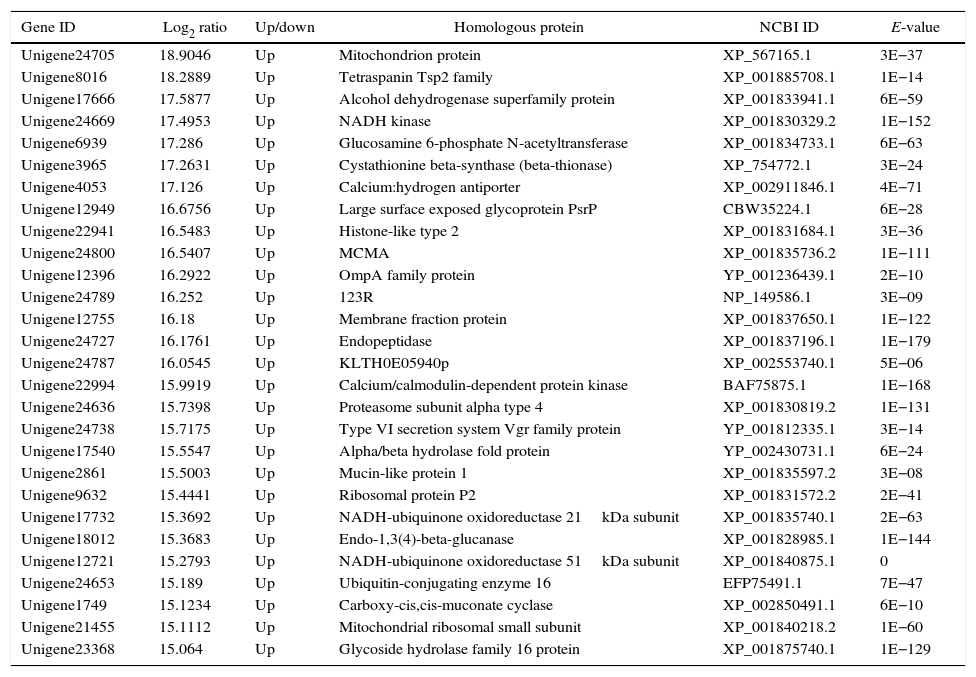
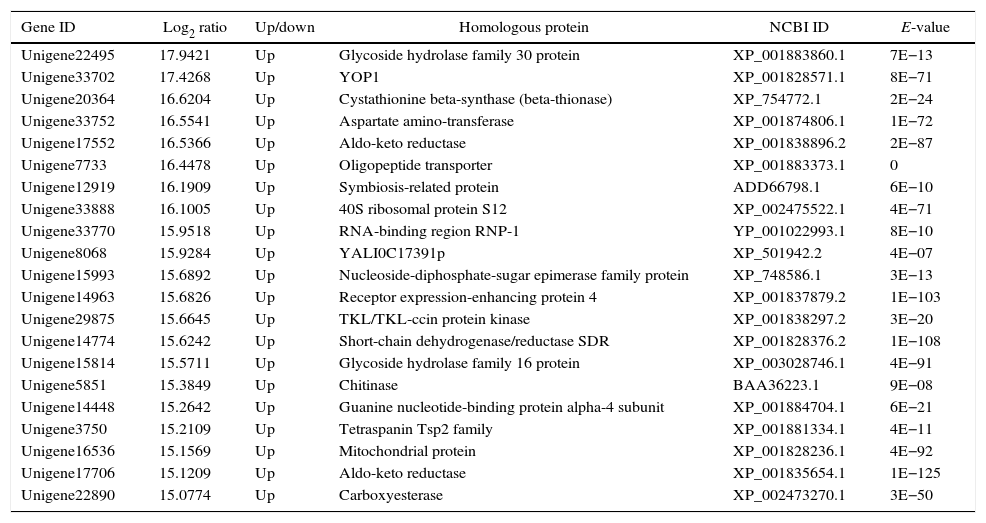
The genes in the dikaryon that were 15-fold up- or down-regulated compared with the monokaryons were examined with an NCBI online BLASTP homology analyzer. Additionally, 28 and 21 up-regulated genes were found to have related functions to annotated genes; no such genes were found for down-regulated genes. The up-regulated genes were primarily involved in macromolecule utilization, cellular material synthesis, stress resistance and signal transduction, etc. (Tables 3 and 4). These findings have provided evidence for the growth advantage that the dikaryon has over the constituent monokaryons.
Function annotation of differentially expressed genes in dikaryon DK13×3 compared to its parental monokaryon MK13.
| Gene ID | Log2 ratio | Up/down | Homologous protein | NCBI ID | E-value |
|---|---|---|---|---|---|
| Unigene24705 | 18.9046 | Up | Mitochondrion protein | XP_567165.1 | 3E−37 |
| Unigene8016 | 18.2889 | Up | Tetraspanin Tsp2 family | XP_001885708.1 | 1E−14 |
| Unigene17666 | 17.5877 | Up | Alcohol dehydrogenase superfamily protein | XP_001833941.1 | 6E−59 |
| Unigene24669 | 17.4953 | Up | NADH kinase | XP_001830329.2 | 1E−152 |
| Unigene6939 | 17.286 | Up | Glucosamine 6-phosphate N-acetyltransferase | XP_001834733.1 | 6E−63 |
| Unigene3965 | 17.2631 | Up | Cystathionine beta-synthase (beta-thionase) | XP_754772.1 | 3E−24 |
| Unigene4053 | 17.126 | Up | Calcium:hydrogen antiporter | XP_002911846.1 | 4E−71 |
| Unigene12949 | 16.6756 | Up | Large surface exposed glycoprotein PsrP | CBW35224.1 | 6E−28 |
| Unigene22941 | 16.5483 | Up | Histone-like type 2 | XP_001831684.1 | 3E−36 |
| Unigene24800 | 16.5407 | Up | MCMA | XP_001835736.2 | 1E−111 |
| Unigene12396 | 16.2922 | Up | OmpA family protein | YP_001236439.1 | 2E−10 |
| Unigene24789 | 16.252 | Up | 123R | NP_149586.1 | 3E−09 |
| Unigene12755 | 16.18 | Up | Membrane fraction protein | XP_001837650.1 | 1E−122 |
| Unigene24727 | 16.1761 | Up | Endopeptidase | XP_001837196.1 | 1E−179 |
| Unigene24787 | 16.0545 | Up | KLTH0E05940p | XP_002553740.1 | 5E−06 |
| Unigene22994 | 15.9919 | Up | Calcium/calmodulin-dependent protein kinase | BAF75875.1 | 1E−168 |
| Unigene24636 | 15.7398 | Up | Proteasome subunit alpha type 4 | XP_001830819.2 | 1E−131 |
| Unigene24738 | 15.7175 | Up | Type VI secretion system Vgr family protein | YP_001812335.1 | 3E−14 |
| Unigene17540 | 15.5547 | Up | Alpha/beta hydrolase fold protein | YP_002430731.1 | 6E−24 |
| Unigene2861 | 15.5003 | Up | Mucin-like protein 1 | XP_001835597.2 | 3E−08 |
| Unigene9632 | 15.4441 | Up | Ribosomal protein P2 | XP_001831572.2 | 2E−41 |
| Unigene17732 | 15.3692 | Up | NADH-ubiquinone oxidoreductase 21kDa subunit | XP_001835740.1 | 2E−63 |
| Unigene18012 | 15.3683 | Up | Endo-1,3(4)-beta-glucanase | XP_001828985.1 | 1E−144 |
| Unigene12721 | 15.2793 | Up | NADH-ubiquinone oxidoreductase 51kDa subunit | XP_001840875.1 | 0 |
| Unigene24653 | 15.189 | Up | Ubiquitin-conjugating enzyme 16 | EFP75491.1 | 7E−47 |
| Unigene1749 | 15.1234 | Up | Carboxy-cis,cis-muconate cyclase | XP_002850491.1 | 6E−10 |
| Unigene21455 | 15.1112 | Up | Mitochondrial ribosomal small subunit | XP_001840218.2 | 1E−60 |
| Unigene23368 | 15.064 | Up | Glycoside hydrolase family 16 protein | XP_001875740.1 | 1E−129 |
Functional annotation of differentially expressed genes in dikaryon DK13×3 compared to its parental MK3 monokaryon.
| Gene ID | Log2 ratio | Up/down | Homologous protein | NCBI ID | E-value |
|---|---|---|---|---|---|
| Unigene22495 | 17.9421 | Up | Glycoside hydrolase family 30 protein | XP_001883860.1 | 7E−13 |
| Unigene33702 | 17.4268 | Up | YOP1 | XP_001828571.1 | 8E−71 |
| Unigene20364 | 16.6204 | Up | Cystathionine beta-synthase (beta-thionase) | XP_754772.1 | 2E−24 |
| Unigene33752 | 16.5541 | Up | Aspartate amino-transferase | XP_001874806.1 | 1E−72 |
| Unigene17552 | 16.5366 | Up | Aldo-keto reductase | XP_001838896.2 | 2E−87 |
| Unigene7733 | 16.4478 | Up | Oligopeptide transporter | XP_001883373.1 | 0 |
| Unigene12919 | 16.1909 | Up | Symbiosis-related protein | ADD66798.1 | 6E−10 |
| Unigene33888 | 16.1005 | Up | 40S ribosomal protein S12 | XP_002475522.1 | 4E−71 |
| Unigene33770 | 15.9518 | Up | RNA-binding region RNP-1 | YP_001022993.1 | 8E−10 |
| Unigene8068 | 15.9284 | Up | YALI0C17391p | XP_501942.2 | 4E−07 |
| Unigene15993 | 15.6892 | Up | Nucleoside-diphosphate-sugar epimerase family protein | XP_748586.1 | 3E−13 |
| Unigene14963 | 15.6826 | Up | Receptor expression-enhancing protein 4 | XP_001837879.2 | 1E−103 |
| Unigene29875 | 15.6645 | Up | TKL/TKL-ccin protein kinase | XP_001838297.2 | 3E−20 |
| Unigene14774 | 15.6242 | Up | Short-chain dehydrogenase/reductase SDR | XP_001828376.2 | 1E−108 |
| Unigene15814 | 15.5711 | Up | Glycoside hydrolase family 16 protein | XP_003028746.1 | 4E−91 |
| Unigene5851 | 15.3849 | Up | Chitinase | BAA36223.1 | 9E−08 |
| Unigene14448 | 15.2642 | Up | Guanine nucleotide-binding protein alpha-4 subunit | XP_001884704.1 | 6E−21 |
| Unigene3750 | 15.2109 | Up | Tetraspanin Tsp2 family | XP_001881334.1 | 4E−11 |
| Unigene16536 | 15.1569 | Up | Mitochondrial protein | XP_001828236.1 | 4E−92 |
| Unigene17706 | 15.1209 | Up | Aldo-keto reductase | XP_001835654.1 | 1E−125 |
| Unigene22890 | 15.0774 | Up | Carboxyesterase | XP_002473270.1 | 3E−50 |
Among the common DEGs of the three strains, when the DK13×3 levels were compared to MPV additive model values, approximately 63.0% (878/2027) of transcripts were identified to be engaged in non-additive gene expression (threshold of greater than two-fold higher/lower). A small plurality of genes, 36.8%, had lower expression levels in DK13×3 than expected, while 26.2% were higher and potentially upregulated (Fig. 7).

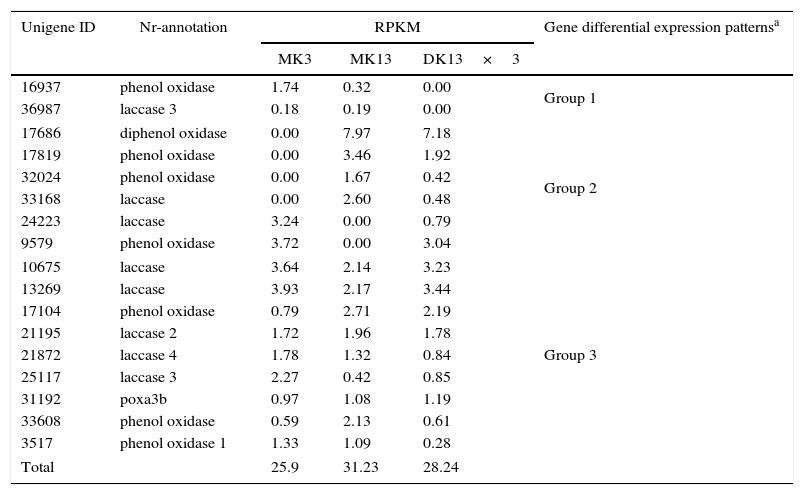
For example, we obtained the transcription profiling from the RNA-seq of the 17 laccase genes in the three strains. The gene action modes of the 17 laccase genes could be divided into the following three patterns: genes expressed in both parental monokaryons but not in the dikaryon; genes expressed in one parental monokaryon and dikaryon but not in another parental monokaryon; and genes expressed in parental monokaryons and the dikaryon. However, the total RPKMs of these laccase genes in DK13×3 did not present significant differences compared to the parental monokaryons (Table 5).
Laccase gene expression profile in Pleurotus ostreatus dikaryon DK13×3 and its parental monokaryons MK13 and MK3.
| Unigene ID | Nr-annotation | RPKM | Gene differential expression patternsa | ||
|---|---|---|---|---|---|
| MK3 | MK13 | DK13×3 | |||
| 16937 | phenol oxidase | 1.74 | 0.32 | 0.00 | Group 1 |
| 36987 | laccase 3 | 0.18 | 0.19 | 0.00 | |
| 17686 | diphenol oxidase | 0.00 | 7.97 | 7.18 | Group 2 |
| 17819 | phenol oxidase | 0.00 | 3.46 | 1.92 | |
| 32024 | phenol oxidase | 0.00 | 1.67 | 0.42 | |
| 33168 | laccase | 0.00 | 2.60 | 0.48 | |
| 24223 | laccase | 3.24 | 0.00 | 0.79 | |
| 9579 | phenol oxidase | 3.72 | 0.00 | 3.04 | |
| 10675 | laccase | 3.64 | 2.14 | 3.23 | Group 3 |
| 13269 | laccase | 3.93 | 2.17 | 3.44 | |
| 17104 | phenol oxidase | 0.79 | 2.71 | 2.19 | |
| 21195 | laccase 2 | 1.72 | 1.96 | 1.78 | |
| 21872 | laccase 4 | 1.78 | 1.32 | 0.84 | |
| 25117 | laccase 3 | 2.27 | 0.42 | 0.85 | |
| 31192 | poxa3b | 0.97 | 1.08 | 1.19 | |
| 33608 | phenol oxidase | 0.59 | 2.13 | 0.61 | |
| 3517 | phenol oxidase 1 | 1.33 | 1.09 | 0.28 | |
| Total | 25.9 | 31.23 | 28.24 | ||
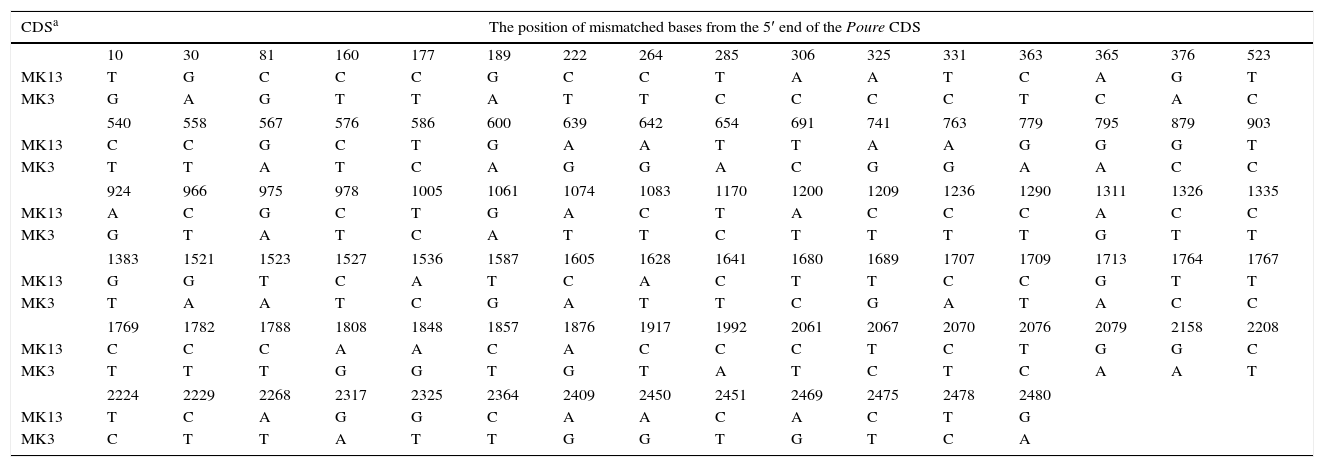
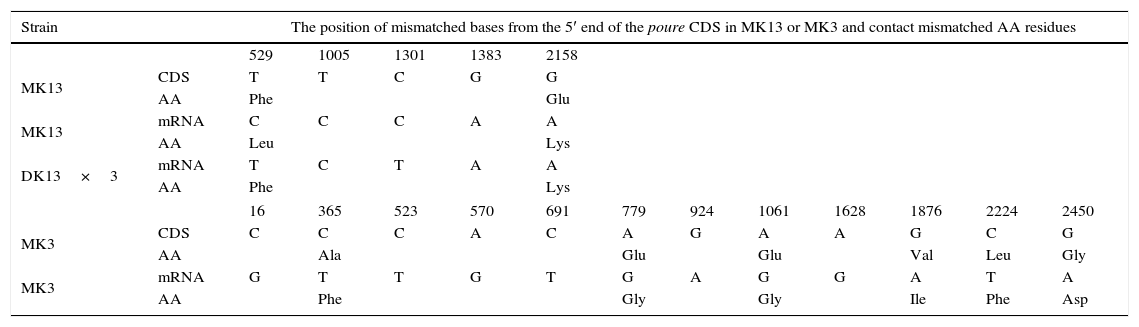
The poure gene of the two monokaryons and mRNA of the two monokaryons and karyon were cloned and sequenced by PCR and RT-PCR. The poure gene sequences of MK13 (GenBank access number: KF312589.1) were 97% and 97% identical to those of P. ostreatus PC15 v2.0, PC9 v1.0, (http://genome.jgi-psf.org/PleosPC15_2/PleosPC15_2.home.html;http://genome.jgi-psf.org/PleosPC9_1/PleosPC9_1.home.html); those for MK3 (GenBank access number: KF312590.1) were 96% and 95% identical. The different bases between the poure gene CDS of MK13 and MK3 were 93 (Table 6). The poure mRNA sequences of MK13, MK3 and DK13×3 were all 100% identical to the RNA-seq results. However, the mRNA sequences and gene CDS of poure differed by 4 bases in MK13 and 12 in MK3. In MK13, the differences were two Ts to Cs and two Gs to As. In MK3, the differences were one C changing to G, four Cs to Ts, four As to Gs, and three Gs to As (Table 7). This revealed that P. ostreatus simultaneously occurred in numerous RNA editing types. Furthermore, the poure mRNA sequences of DK13×3 were more identical to that of MK13 than MK3, with only two different bases and one predicted amino acid to MK13, while there were 89 different bases compared to MK3. As with MK13, the mRNA sequence and gene CDS of Poure in DK13×3 involved 4 bases, one T to C, one C to T, and two Gs to As (Tables 6 and 7). Urease catalyzed the hydrolysis of urea into carbon dioxide and ammonia. Urease was the first enzyme to be crystallized from jack beans, and it was the first protein whose enzymatic properties were demonstrated by Sumner in 1926.42 Ureases have been found in numerous bacteria, fungi, algae, plants and some invertebrates, and they have been found to help microorganisms and plants use endogenous and exogenous urea as a nitrogen source. The ammonia produced is subsequently utilized to synthesize proteins.43 Ureases of bacteria, fungi and higher plants are highly conserved.44 In higher plants and fungi, the enzyme is encoded by a single gene.45,46 Thus, our results showed that the poure transcript of DK13×3 was from the MK13 poure gene and that RNA editing also occurred (Table 6).
Sequence alignment of the poure gene CDS between the two monokaryons of Pleurotus ostreatus.
| CDSa | The position of mismatched bases from the 5′ end of the Poure CDS | |||||||||||||||
|---|---|---|---|---|---|---|---|---|---|---|---|---|---|---|---|---|
| 10 | 30 | 81 | 160 | 177 | 189 | 222 | 264 | 285 | 306 | 325 | 331 | 363 | 365 | 376 | 523 | |
| MK13 | T | G | C | C | C | G | C | C | T | A | A | T | C | A | G | T |
| MK3 | G | A | G | T | T | A | T | T | C | C | C | C | T | C | A | C |
| 540 | 558 | 567 | 576 | 586 | 600 | 639 | 642 | 654 | 691 | 741 | 763 | 779 | 795 | 879 | 903 | |
| MK13 | C | C | G | C | T | G | A | A | T | T | A | A | G | G | G | T |
| MK3 | T | T | A | T | C | A | G | G | A | C | G | G | A | A | C | C |
| 924 | 966 | 975 | 978 | 1005 | 1061 | 1074 | 1083 | 1170 | 1200 | 1209 | 1236 | 1290 | 1311 | 1326 | 1335 | |
| MK13 | A | C | G | C | T | G | A | C | T | A | C | C | C | A | C | C |
| MK3 | G | T | A | T | C | A | T | T | C | T | T | T | T | G | T | T |
| 1383 | 1521 | 1523 | 1527 | 1536 | 1587 | 1605 | 1628 | 1641 | 1680 | 1689 | 1707 | 1709 | 1713 | 1764 | 1767 | |
| MK13 | G | G | T | C | A | T | C | A | C | T | T | C | C | G | T | T |
| MK3 | T | A | A | T | C | G | A | T | T | C | G | A | T | A | C | C |
| 1769 | 1782 | 1788 | 1808 | 1848 | 1857 | 1876 | 1917 | 1992 | 2061 | 2067 | 2070 | 2076 | 2079 | 2158 | 2208 | |
| MK13 | C | C | C | A | A | C | A | C | C | C | T | C | T | G | G | C |
| MK3 | T | T | T | G | G | T | G | T | A | T | C | T | C | A | A | T |
| 2224 | 2229 | 2268 | 2317 | 2325 | 2364 | 2409 | 2450 | 2451 | 2469 | 2475 | 2478 | 2480 | ||||
| MK13 | T | C | A | G | G | C | A | A | C | A | C | T | G | |||
| MK3 | C | T | T | A | T | T | G | G | T | G | T | C | A | |||
Sequence alignment of the poure gene CDS, mRNA and predicted AAs between the three strains of P. ostreatus.
| Strain | The position of mismatched bases from the 5′ end of the poure CDS in MK13 or MK3 and contact mismatched AA residues | ||||||||||||
|---|---|---|---|---|---|---|---|---|---|---|---|---|---|
| 529 | 1005 | 1301 | 1383 | 2158 | |||||||||
| MK13 | CDS | T | T | C | G | G | |||||||
| AA | Phe | Glu | |||||||||||
| MK13 | mRNA | C | C | C | A | A | |||||||
| AA | Leu | Lys | |||||||||||
| DK13×3 | mRNA | T | C | T | A | A | |||||||
| AA | Phe | Lys | |||||||||||
| 16 | 365 | 523 | 570 | 691 | 779 | 924 | 1061 | 1628 | 1876 | 2224 | 2450 | ||
| MK3 | CDS | C | C | C | A | C | A | G | A | A | G | C | G |
| AA | Ala | Glu | Glu | Val | Leu | Gly | |||||||
| MK3 | mRNA | G | T | T | G | T | G | A | G | G | A | T | A |
| AA | Phe | Gly | Gly | Ile | Phe | Asp | |||||||
Our results showed that the global gene expression profile of dikaryon was distinct from its constituent monokaryons, and there was an expression difference in nearly two-thirds of the genes. This change was also confirmed by RT-PCR cloning and sequencing of the poure mRNA of the three strains. These results are not in agreement with previous reports,22,23 which is probably due to the different gene expression profiling approaches. The high throughput RNA-seq was certainly more thorough and comprehensive than traditional DNA hybridization.47
Based on the gene transcriptional quantity, heterosis in diploids was considered to result from differential gene expression, including the following five gene expression patterns: (i) genes expressed in both parents but not in hybrids, (ii) genes expressed in one parent and hybrid but not in another parent, (iii) genes expressed in one parent but not in another parent or hybrid, (iv) genes expressed only in a hybrid but not in both parents, and (v) genes expressed in both parents and the hybrid. The first four patterns are the presence/absence variations (PAV)48; the fifth could be divided into additive and non-additive gene expression patterns for which hybrids showed a transcript level equal to or deviating from the mid-parent value (average of the two parents).49–51 In this study, the mycelial growth rate of P. ostreatus dikaryon DK13×3 was significantly higher than that of the two parental monokaryons, indicating the advantage of sexual reproduction or heterosis in the dikaryon. The total gene expression quantity in the dikaryon was 4.8% and 6.5% higher than its constituent monokaryons, and all possible modes of differential gene expression that were present in the dikaryon when compared to its constituent monokaryons, including presence/absence variation and additive/non-additive gene expression, may be contributing to heterosis. This was confirmed in previous studies.24
Monoallelic expression genes have been found in a number of organisms, including humans, rodents, corn, and yeast.52 They are on the X chromosome in female placental mammals or on autosomes,5 and the selection of the expressed allele may depend on the parental origin or be random.53 However, this phenomenon has not been reported in the dikaryon. Those DEGs in the dikaryon can be divided into four groups. The main group was simultaneously expressed in both of the monokaryons. The other two smaller groups were expressed in only one of two monokaryons. The fourth group was expressed in the dikaryon alone. DEGs in the dikaryon only expressing MK3 or MK13 might be regarded as monoallelic expression genes, as evidenced by RT-PCR cloning and sequencing results. For example, the poure transcript in the dikaryon was from the MK13 nucleus gene but not MK3. More than 10% of the monoallelic expression genes in the dikaryon were from each parental monokaryon. However, we could not determine whether they demonstrated autosomal random monoallelic expression, sex chromosome inactivation, or imprinted gene expression. In fungi, the chromosome containing mating genes may be deemed as the sex chromosome. In mice and humans, more than 10% of the genes have autosomal random monoallelic expression.54,55 The isozyme bands that are only present in the S. commune dikaryon were demonstrated to depend on the expression of mating genes A and B.16 Accordingly, the relationship between the fourth group and the mating genes merits further study.
RNA-editing by base deamination has been reported in plant mitochondria and plastids (C-to-U editing)56 and mammals (A-to-I editing)57; U-to-C and guanosine (G)-to-A changes, which are probably by trans-amination, are also reported in mammals.58,59 No similar cases have been found in higher fungi. In this study, our results showed that numerous types of RNA editing existed in the poure mRNA in P. ostreatus, including C-T, A-G, and C-G base substitution.
Taken together, our results suggest that the gene expression patterns in dikaryons should be similar to diploid. Finally, we strongly propose that the fungal dikaryon is a perfect experimental model for studying sex evolution and monoallelic expression due to its unique biology. The two parental monokaryons can independently live with asexual reproduction. It was proposed that the monokaryons were the temporary stage of dikaryons and had less combative ability than dikaryons,60 but several species models have demonstrated that monokaryons have a similar or more combative phenotype compared to dikaryons.61,62 Therefore, it was suggested that monokaryons with greater adaptive genetic potential may improve the combative ability to dikaryons.63 In dikaryons, the two monokaryon nuclei do not fuse to karyogamy, and the two chromosomal sets only occasionally recombine during vegetative growth63; therefore, it is easy to determine the origins of alleles in a dikaryon. Although there is no paternal and maternal distinction in the mating of two compatible monokaryons, as with other sexual reproduction, the mitochondrion in almost all dikaryons is from only one monokaryon.64 The example donor can be regarded as the female parent.
Conflicts of interestThe authors declare no conflicts of interest.
This work was funded by a grant from the Natural Science Foundation of Henan Province (112300410115) and the program for Innovative Research Team (in Science and Technology) in University of Henan Province (15IRTSTHN014).