


The growth of yeasts in culture media can be affected by many factors. For example, methanol can be metabolized by other pathways to produce ethanol, which acts as an inhibitor of the heterologous protein production pathway; oxygen concentration can generate aerobic or anaerobic environments and affects the fermentation rate; and temperature affects the central carbon metabolism and stress response protein folding. The main goal of this study was determine the implication of free fatty acids on the production of heterologous proteins in different culture conditions in cultures of Pichia pastoris. We evaluated cell viability using propidium iodide by flow cytometry and thiobarbituric acid reactive substances to measure cell membrane damage. The results indicate that the use of low temperatures and low methanol concentrations favors the decrease in lipid peroxidation in the transition phase from glycerol to methanol. In addition, a temperature of 14°C+1%M provided the most stable viability. By contrast, the temperature of 18°C+1.5%M favored the production of a higher antibody fragment concentration. In summary, these results demonstrate that the decrease in lipid peroxidation is related to an increased production of free fatty acids.
Pichia pastoris is a methylotrophic yeast used as a heterologous host for the production of recombinant proteins.1 An attractive feature of P. pastoris is that, as a eukaryote microorganism, heterologous proteins are more likely to be soluble, correctly folded and to have undergone the post-translational modifications required for activity.2 Because of these characteristics, many studies have been performed to enhance the production of recombinant proteins. However, the effect of changes in the culture media, temperature, pH, type of inductor, among others, has not been widely tested on the yeast, and has not taken into account that a negative effect on the yeast metabolism may have a direct impact on the quality of heterologous proteins.
Methylotrophic yeasts catalyze the oxidation of short aliphatic alcohols, such as methanol, ethanol and 1-propanol due to the enzyme alcohol oxidase (AOX). This enzyme is found mainly in the peroxisome matrix, and it is key in the oxidation of methanol to formaldehyde resulting in the production of H2O2.3 It is important to consider that glycerol, ethanol and methanol can be used as a sole carbon source for P. pastoris growth. Arias et al.37 reported that glycerol is a better carbon source than glucose to preculture these cells, allowing for high biomass productivity, lower duplication time and greater final concentration and productivity of the antibody fragment. Diauxic growth is also possible, especially when the substrate is composed of a mixture of ethanol-glycerol or ethanol–methanol.4 When the expression of heterologous proteins is associated with cell growth under aerobic conditions, then it is important to prevent the production of ethanol, which inhibits cell growth.5 Additionally, glucose and ethanol act as negative effectors, reducing AOX expression by catabolite repression and end product inhibition.4,5
Proteolytic degradation of recombinant proteins expressed in P. pastoris has been attributed to the metabolism of methanol to ethanol, which induces cell lysis particularly late in the fermentation. It has also been reported that proteolytic degradation can be minimized through the manipulation of pH and temperature,6 with cell viability enhanced for over 24h in batch fermentations at very low (10°C) and very high temperatures (37°C).7 Conversely, growth using high concentrations of methanol as the sole carbon source at high temperatures induces strong oxidative stress8 due to autoxidation of polyunsaturated fatty acids (PUFAs) or lipid peroxidation that reduces biomass production.9 PUFA residues of membrane phospholipids are very sensitive to oxidation and the action of ROS,34 wherein PUFAs easily undergo non-enzymatic oxidation and fragmentation during lipid peroxidation and form numerous toxic products. For example, hydroxyl radical (OH) can easily “steal” an electron from such unsaturated fatty acids to give rise to a carbon-centered lipid radical. Lipid radical can further interact with molecular oxygen (O2) to produce lipid peroxyl radical (fatty acid peroxyl radical). Being an unstable species, lipid peroxyl radical interacts with another free fatty acid to produce a different fatty acid radical and lipid peroxide (LOOH). The formed fatty acid radical reacts again with molecular oxygen to produce fatty acid peroxyl radical, etc., creating the cycle which continues, as the new fatty acid radical reacts in the same way.35 However, it is unknown what effects induce the oxidative stress following the growth of P. pastoris at high temperatures using methanol as the sole carbon source. For this reason, in this study we investigated methanol catabolism through the pyruvate pathway in P. pastoris, and monitored the effects of this metabolism on the heterologous expression of recombinant antibody fragment protein.
Materials and methodsStrainP. pastoris strain SMD1168 (Invitrogen®): Δpep4::URA3Δkex1::SUC2his4ura3 with His−Mut+ phenotype was used for the expression of antibody fragment scFv. The genetically modified version of this strain was provided by the research group of Prof. Dr. Dulcineia S. P. Abdalla of the Departamento de Análises Clínicas e Toxicológicas, Faculdade de Ciências Farmacêuticas at the Universidade de São Paulo, and was constructed by the group of Prof. Dr. Andrea Q. Maranhão of the Department of Molecular Biology at the Universidade de Brasília, Brazil.
ReagentsThe solvents were of analytical grade. The components of culture medium were autoclaved at 121°C for 20min, except for yeast nitrogen base, ammonium sulfate and casamino acids, which were autoclaved at 110°C for 5min. Biotin was sterilized by filtration through a 0.22μm pore diameter membrane. Solutions and buffers were prepared by using deionized water. Propidium iodide (PI), 5,5′,6,6′-tetrachloro-1,1′,3,3′-tetraethylbenzimi-dazolylcarbocyanine iodide (JC-1) and 2′,7′-dichlorodihydrofluorescein diacetate (DCFH-DA) were purchased from Sigma-Aldrich (St Louis, MO, USA). The Mitochondrial Membrane Potential Detection Kit was purchased from Biotium (Hayward, CA, USA).
Maintenance and reactivation of P. pastorisFor the preservation of P. pastoris, the colonies were replicated every three months on YPD solid medium (1% (w/v) yeast extract, 2% (w/v) casein peptone, 2% (w/v) glucose, 2% (w/v) bacteriological agar) and incubated at 30°C for 24h. After that period, the colonies were removed from plates and inoculated in 500mL Erlenmeyer flasks containing 100mL of YPD liquid medium at 30°C and 250rpm for 24h. Then, the colonies were stored at 4°C and −70°C in YPD medium containing 20% sterile glycerol. For the reactivation step, 1mL of frozen material was inoculated in 500mL Erlenmeyer flasks containing 100mL of the growth medium BMGY (buffered glycerol complex medium) (1% (w/v) yeast extract, 2% (w/v) casein peptone, 0.34% (w/v) yeast nitrogen base, 1% (w/v) ammonium sulfate, 100mM buffer potassium phosphate pH 6.0, 4×10⁻⁵% (w/v) biotin, 1% (v/v) glycerol, 2% (w/v) casamino acids with deionized water) and incubated at 30°C and 250rpm for 19h in a shaking incubator (Model SI-300, Jeio Tech, Seoul, Korea).8 The reactivation step should be realized once because freeze–thaw stress affects the viability and activity of yeast cells, beside it has been reported that several cellular factors affect freeze–thaw stress tolerance.36,37
Preparation of P. pastoris inoculum in a shaker (growth phase)For the inoculum preparation, 200mL of BMGY medium and genetically modified P. pastoris strain were cultured in an Erlenmeyer flask at 30°C at 250rpm for 19h. Subsequently, the inoculum was transferred to 180mL of BMGY medium and incubated at 30°C at 250rpm for 24h in a shaking incubator (Model SI-300, Jeio Tech, Seoul, Korea).
Induction phase in a shakerAfter the growth phase, the temperature was adjusted to 14°C, 18°C and 22°C. To inhibit the production of protease, 1mM PMSF (phenylmethanesulfonyl fluoride) was added and then 1%, 1.5% and 2% (v/v) of methanol at each condition, respectively. This point of culture was considered as the start of the induction phase, or time 0h. Both the PMSF and methanol were added every 24h during the induction phase at 0, 24, 48h of culture; the culture finished at 72h of the induction phase, and the total time of culture was 72h. All cultures were incubated at 250rpm in a shaking incubator (Model SI-300, Jeio Tech, Seoul, Korea).
Experimental designAfter 96h each culture was centrifuged at 1957×g for 30min where aliquots of 2mL were obtained for use in the subsequent design. Recombinant P. pastoris was cultured at five different conditions of temperature and methanol concentration. The conditions were (a) 14°C, 1% methanol (M); (b) 14°C, 2%M; (c) 18°C, 1.5%M; (d) 22°C, 1%M; (e) 22°C, 2%M.
Determination of lipid peroxidationLipid peroxidation was quantified by measuring thiobarbituric acid reactive substances (TBARS) produced from the reaction of TBA with malondialdehyde (MDA).10 Cells were centrifuged at 10,000×g for 5min at 4°C, the supernatant was eliminated and cells were washed once and re-suspended in potassium phosphate buffer. Cell disruption was performed using glass beads (0.45mm diameter); suspensions were disrupted during 5 cycles of 1min in vortex at 40Hz and 1min of incubation on ice. Samples were centrifuged at 10,000×g for 15min at 4°C. The supernatant was used to measure TBARS and protein concentration. One volume of sample was mixed with two volumes of TBA reactive (0.25M chlorhydric acid, 15% (v/v) trichloroacetic acid and 0.375% (w/v) thiobarbituric acid). Subsequently, the samples were incubated for 20min at 100°C in a dry bath, and then the mixture was cooled on ice and centrifuged at 13,000×g for 30s at 4°C. Supernatant absorbance was measured at 532nm in a Spectra Max Plus microplate reader (Molecular Devices). A calibration curve was performed using 1,1,3,3-tetramethoxypropane 500μM as standard. The results were expressed as micromoles of MDA/mg protein. The concentrations were determined in triplicate for each sample.
Determination of cell viabilityViability of recombinant P. pastoris cells were determined by using the fluorescent probe PI.11 Samples were taken from cultures prior to induction (0h) and during the induction phase at 24, 48 and 72h. Cells were suspended to optical density (OD) 0.2 in sterile 1X phosphate buffered saline (PBS), were incubated with PI at final concentration of 4.7μM, and finally were immediately analyzed in a BD FACSCanto™ II flow cytometer (Becton-Dickinson, New Jersey, USA). 10,000 events were evaluated in PE channel at 585/42nm and the analysis was performed on the FacsDiva v.6.1.3 software (Becton-Dickinson). PI negative cells were considered as viable cells and PI-positive cells were considered dead cells. Positive, negative and autofluorescence controls were analyzed.
Metabolite concentrationSamples for quantifying intracellular metabolites in yeast were prepared as per the manufacturer's instructions (Biovision Incorporated, CA 95035, USA) with minor modifications. The dried yeast cells were re-suspended in lysis buffer containing 50mM potassium buffer phosphate (pH 7.0), 1mM PMSF and 0.5mM EDTA (ethylenediaminetetraacetic acid). Next, the cells were disrupted using glass beads during 5 cycles, each one corresponding to 1min in a vortex at 40Hz and 1min of incubation on ice, and then were centrifuged at 10,000×g for 5min to 4°C, the supernatant was transferred to a new 1.5mL microfuge tube, and this was used to measure ethanol (Ethanol Colorimetric/Fluorometric Assay Kit; Cat. K620-100, BioVision), lactate (Lactate Colorimetric/Fluorometric Assay Kit; Cat. K607-100, BioVision), pyruvate (Pyruvate Colorimetric/Fluorometric Assay Kit; Cat. K609-100, BioVision) and free fatty acid (Free Fatty Acid Quantification Colorimetric/Fluorometric Assay Kit; Cat. K612-100, BioVision).
Purification scFv anti-low-density lipoprotein (LDL) (−)Culture medium (20mL) was centrifuged at 2270×g for 20min and passed by column containing activated resin with nickel. Recombinant protein was recovered using an elution buffer with 0.5M imidazole and then passed to a molecular exclusion column and re-suspended in 1X PBS. Total protein concentration was determined by bicinchoninic acid assay.
Statistical analysisAnalysis of TBARS was performed by a paired t-test. Analysis of cell viability and quantification of metabolite concentration were performed by repeated measures of a two-way analysis of variance (ANOVA) followed by Bonferroni's post-test, using the sample at 0h of the induction phase as the control. All data were expressed as mean±standard deviation (SD) and the level of statistical significance was p<0.05.
ResultsCell viabilityThe cell viability was measured to evaluate the effects of the culture conditions as a function of time. Recombinant P. pastoris cultured at 14°C and 1%M showed stable cell viability (97%) throughout the induction phase (Fig. 1). On the other hand, the other cultures after the induction with methanol (24h) decreased their cell viability in comparison to the control (0h), particularly the culture at 22°C and 2%M that between 24 and 72h showed the lowest viability (Fig. 1; p<0.05).
. Statistical analysis by two way ANOVA–Bonferroni")
The effects of temperature and methanol on cell viability. The induction time is represented in hours. Each point represents the mean ± SD (n=3). Statistical analysis by two way ANOVA–Bonferroni's post-test *p<0.001 (14°C-1%M vs. 18°C-1.5%M, 22°C-2%M); **p<0.01 (14°C-2%M vs. 22°C-2%M); ***p<0.05 (14°C-1%M vs. 22°C-2%M).
The TBARS levels were determined in order to evaluate oxidative damage in the cell membranes of recombinant P. pastoris exposed to different conditions of temperature and methanol concentration. All the cultures analyzed showed a significant difference at 72h after induction with methanol in comparison to the control (0h), indicating that there was a change in the production of lipid peroxidation of recombinant P. pastoris (Fig. 2a–e; p<0.05). By contrast, all cultures at 72h showed a significant difference with respect to the control, indicating that in each condition the membrane lipid oxidation is similar (Fig. 3; p>0.05).
 14°C – 1%M, (b) 14°C – 2%M, (c)18°C – 1.5%M, (d) 22°C – 1%M, (e) 22°C – 2%M. Each bar represents the mean±SD (n=3). Statistical analysis by paired t-test. *p<0.05 (0h vs. 72h).")
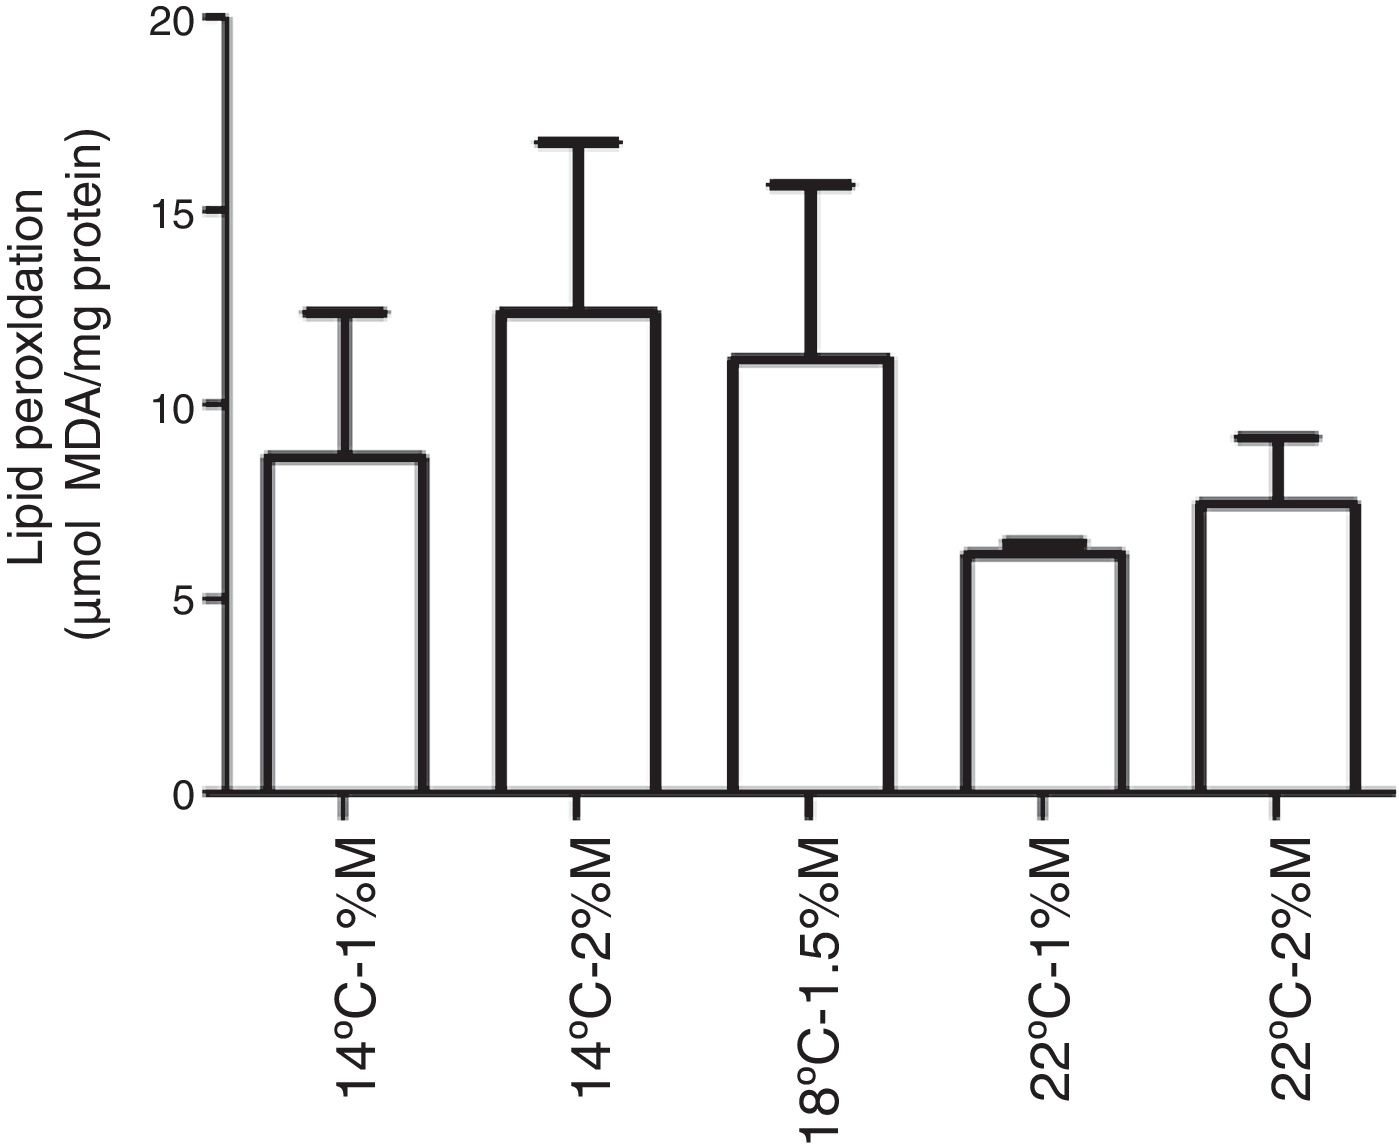 0.05).' title='Lipid peroxidation levels in Pichia pastoris at 72h of induction time in different culture conditions. (a) 14°C – 1%M, (b) 14°C – 2%M, (c) 18°C – 1.5%M, (d) 22°C – 1%M, (e) 22°C – 2%M. Each bar represents the mean±SD (n=3). Statistical analysis by one-way Anova-Bonferroni's post-test. No significant difference was found (p>0.05).'/>
Lipid peroxidation levels in Pichia pastoris at 72h of induction time in different culture conditions. (a) 14°C – 1%M, (b) 14°C – 2%M, (c) 18°C – 1.5%M, (d) 22°C – 1%M, (e) 22°C – 2%M. Each bar represents the mean±SD (n=3). Statistical analysis by one-way Anova-Bonferroni's post-test. No significant difference was found (p>0.05).
The effect of different culture conditions on the metabolite concentration as a function of time indicated that pyruvate after 72h in the culture at 22°C and 2%M showed a significant difference from the other cultures (Fig. 4; p<0.05). Yet it is noteworthy that all culture conditions showed a decrease during the induction time, reaching values close to 0mM. Second, the ethanol concentration in the culture at 2%M and 22°C and at 1%M and 14°C at 48h of induction indicated a significant difference to present the lowest concentrations (Fig. 5; p<0.05). After 24h, all cultures suffered a sharp drop in the ethanol concentration reaching values between 0.25 to 1mM (Fig. 5).
. Statistical analysis by two-way ANOVA–Bonferroni")
Pyruvate concentration. Representative graphic of the pyruvate concentration in different culture conditions. Each point represents the mean±SD (n=3). Statistical analysis by two-way ANOVA–Bonferroni's post-test. *p<0.05 (14°C+1%M vs. all other conditions); **p<0.01 (18°C+1.5%M vs. 22°C+1%M, 14°C+2%M, 14°C+1%M);***p<0.01 (22°C+2%M vs. 22°C+1%M, 14°C+2%M, 14°C+1%M).
. Statistical analysis by two-way ANOVA–Bonferroni")
Ethanol concentration. Representative graphic of the ethanol concentration in different culture conditions. Each point represents the mean±SD (n=3). Statistical analysis by two-way ANOVA–Bonferroni's post-test. *p<0.05 (22°C+2%M vs. all other conditions); **p<0.05 (14°C+1%M vs. all other conditions).
With respect to the effect on the lactate concentration, the cultures at 22°C and 1%M, 14°C and 2%M, 14°C and 1%M showed that the highest metabolite concentration was reached at 24h in the three cultures (Fig. 6; p<0.01). After this time, all cultures presented a sharp drop in the lactate concentration reaching concentrations below those observed at baseline, where all the values observed were close to or equal to 0mM at 72h (Fig. 6).
. Statistical analysis by two way ANOVA–Bonferroni")
Lactate concentration. Representative graphic of the lactate concentration in different culture conditions. Each point represents the mean±SD (n=3). Statistical analysis by two way ANOVA–Bonferroni's post-test. *p<0.05 (14°C+1%M vs. all other conditions);**p<0.01 (18°C+1.5%M vs. 22°C+1%M, 14°C+2%M, 14°C+1%M); ***p<0.01 (22°C+2%M vs. 22°C+1%M, 14°C+2%M, 14°C+1%M).
On the other hand, the free fatty acid concentration in the cultures at 2%M and 22°C and at 1M% and 22°C at 24h and 48h indicated significant differences, presenting higher concentrations than the other cultures (Fig. 7; p<0.001); however, at 72h the culture at 18°C and 1.5%M showed a significant difference in its concentration (Fig. 7; p<0.05), yet the main peak was observed at 48h of induction. Regarding the behavior of each of the cultures during the induction process, the only culture that had increased free fatty acid concentration during the entire culture time was at 18 and 1.5%M. The cultures at low temperatures (14°C), at the end of the 72h, reached concentrations close to 0mM, and cultures at high temperatures (22°C) suffered an abrupt drop values between 0.2 and 0.3mM (Fig. 7).
. Statistical analysis by two-way ANOVA–Bonferroni")
Free fatty acid concentration. Representative graphic of the free fatty acid concentration in different culture conditions. Each point represents the mean±SD (n=3). Statistical analysis by two-way ANOVA–Bonferroni's post-test. *p<0.001 (22°C+2%M vs. 18°C+1.5%M, 14°C+2%M, 14°C+1%M);**p<0.001 (22°C+1%M vs. 18°C+1.5%M, 14°C+2%M, 14°C+1%M);***p<0.05 (18°C+1.5%M vs. all other conditions).
The concentration of the extracellular antibody fragment was measured to determine the best culture and metabolic pathway conditions. All the cultures showed the presence of the fragment. After 24h, the cultures performed at low temperatures (14°C) presented an increase in the production, whereas the cultures carried out at high temperature (22°C) presented a decrease. The culture at 22°C and 1%M at 72h showed a significant difference, where the production of the antibody fragment was the lowest (Fig. 8; p<0.01). By contrast, the culture at 18°C and 1.5%M showed the most stable production in the first hours, then increased the production and released the highest production close to the culture at 22°C and 2%M, indicating that high temperatures (18°C and 22°C) and high methanol concentrations favored the production of this heterologous protein (Fig. 8).
. Statistical analysis by two-way ANOVA–Bonferroni")
The antibody fragment concentration. The graph represents the quantification of antibody fragment purified by its histidine tail. Samples were analyzed every 24h of culture between 0h to 72h of the induction phase in different culture conditions. Each point represents the mean±SD (n=3). Statistical analysis by two-way ANOVA–Bonferroni's post-test.*p<0.001 (14°C+2%M vs. all other conditions); **p<0.01 (22°C+1%M vs. all other conditions);***p<0.05 (18°C+1.5%M vs. all other conditions); αp<0.001 (18°C+1.5%M vs. 22°C+1%M, 14°C+1%M, 14°C+2%M).
For a long time, researchers have tried to optimize different protocols for analyzing the effect of different culture conditions in order to increase the production of heterologous proteins.12 Although the methods used have produced high quantities of these proteins, it is also important to consider that the overexpression of foreign molecules generates metabolic stress on the physiology of recombinant P. pastoris.13
Monitoring the viability of yeast cultures is an important quality control parameter.14 The results indicate that the culture performed at a low temperature (14°C) provided higher cell viability, which suggests that the low temperature increases cell membrane stability. These results are compared to those obtained by Schade et al.,15 who observed that Saccharomyces cerevisiae exposed to temperatures from 30°C to 10°C showed better adaptation of the cell membrane at a low temperature, resulting in decreased membrane fluidity. Yeast undergoes adaptation to culture temperatures between 10°C and 18°C.16 The advantages conferred by culturing at low temperatures are protection of the yeast from freezing damage through the accumulation of trehalose and glycerol, induction of heat shock proteins and leading to changes in membrane fluidity.17 Yeasts can respond and react to environmental changes, inducing protection against stress. That explains why the cultures at low temperatures showed a stable and less permeable cell membrane; thus, we believe that the reduction in temperature to 14°C is favorable and protects cell stability.
The condition of the culture medium can affect cells, generating oxidative stress and forming lipid hydrogen peroxide. Autoxidation of polyunsaturated fatty acids (PUFAs) is detrimental to the cell and has been linked to age-related degenerative diseases9 and is associated with apoptosis.18 Malondialdehyde is a product of membrane lipid peroxidation and is considered a direct indicator of cell damage.19 Our results indicate that the malondialdehyde concentration decreased when the yeasts were exposed to low incubation temperatures (14°C, 18°C and 22°C) during the induction phase of recombinant proteins, and there is a decrease in the lipid peroxidation. This observation agrees with the results obtained in recombinant P. pastoris at 10°C.8 The decrease in the formation of lipid peroxides is induced due to a drop in temperature. This may be because the temperature induces a modulation in the formation of membrane lipids.20 This suggests that culture conditions with high temperatures, such as 30°C in the exponential growth of recombinant P. pastoris, generates higher levels of lipid peroxidation. As in the case of S. cerevisiae, Henderson et al.20 observed that at 35°C higher phosphatidylinositol concentration was produced, whereas higher levels of phosphatidylethanolamine and medium-chain fatty acids were observed at 15°C. Moreover, it has been determined that phosphatidylinositol is a membrane phospholipid able to produce the greatest increase in TBARS.21 Therefore, one would expect that in our culture the initial incubation of yeasts at 30°C could be inducing the formation of phosphatidylinositol, which would increase the TBARS levels during that condition.
Cells subjected to elevated temperature show accelerated mitochondrial respiration and enhanced reactive oxygen species (ROS) production.22 Additionally, heat-induced ROS are thought to be responsible for cell damage upon exposure to heat stress.23 In this way, we observed that ROS production is lower due to the metabolism and the mitochondrial respiration decreases (data not shown), and lower phosphatidylinositol concentrations should be expected in yeasts exposed to low temperatures.
P. pastoris is exposed to two types of stress in the methanol fed-batch phase: stress resulting from methanol degradation and stress resulting from the production of the recombinant protein leading to the induction of oxidative stress and unfolded protein response pathways, respectively. Finally, the mild increase in methanol assimilatory enzymes compared to the strong increase in methanol dissimilatory enzymes suggests here a potential to improve methanol incorporation in biomass/product through metabolic enhancement of the methanol assimilatory pathway.24 Cellular life depends on the energy obtained through biochemical reactions in the form of ATP. The energy charge is maintained by the metabolic network and mostly restored by the glycolytic fermentation and respiration.25 In eukaryotic cells, pyruvate is converted to acetyl-CoA, NADH and releasing carbon dioxide in a process called pyruvate decarboxylation.26 This conversion is usually catalyzed by pyruvate dehydrogenase complex as part of aerobic respiration.27 Looking at the results of the pyruvate concentration it is expected that this metabolite will be spent in the culture media in the course of time, considering that there are multiple pathways that require it (Fig. 4). However, these results highlight the fact that all cultures have the same behavior over time, and even more importantly is the drop from time 0 to 24h, where we expected that the methanol concentration added each time into the medium would generate a decrease in the pyruvate concentration in a similar way to the rest of the times, or in a mild way. This could mean that the use of methanol forces a decline in pyruvate production. For this reason, a clear difference is observed in the concentration from the batch phase (time 0) and the fed-batch phase (24, 48 and 72h). Regarding the behavior of the cultures, the condition at 22°C+2%M is the one that at 72h showed the highest pyruvate concentration, which could be explained in two ways: (1) metabolizing methanol as a carbon source where its pathway favors pyruvate production is better due to the high methanol concentration (2%) and its uptake is facilitated by the temperature of 22°C, or (2) the production of pyruvate is similar to other cultures but its uptake in other metabolic pathways is lower and therefore the accumulation of pyruvate is noted.
Pyruvate is converted to acetaldehyde by pyruvate decarboxylase and this is reduced to form ethanol, a reaction catalyzed by the enzyme alcohol dehydrogenase.5 Glycerol, on the other hand, is a non-fermentable carbon source and P. pastoris is not considered a fermentative yeast; however, ethanol is accumulated during growth when a high glycerol feeding rate is employed. This phenomenon has been reported on several occasions but the mechanism has yet to be explained.4 This effect is observed in Fig. 5, where all the cultures have the glycerol-methanol transition with a high ethanol concentration, which strangely is maintained for 24h after induction contrary to what was expected, where the ethanol concentration should have decreased when the carbon source was changed. This could indicate that ethanol is not being consumed because even after 24h there is glycerol in the culture media, and it does not need to be completely consumed to activate the enzymes related to the metabolism of methanol,4 allowing the activation of the AOX promoter when starting the induction. This happens because pyruvate can trigger the alcoholic fermentation, which depends on the respiratory capacity and metabolic rate of glycolysis. In this process, pyruvate is converted to acetaldehyde and pyruvate decarboxylase is reduced to form ethanol as catalyzed by alcohol dehydrogenase. Furthermore, ethanol can be used as a carbon and energy source, if the breathing capacity of the yeast is restored. In this case, ethanol would be transformed to acetaldehyde by alcohol dehydrogenase and then to acetate by acetaldehyde dehydrogenase and finally acetyl-CoA synthase converts it to acetyl-CoA,5 which would explain the drop in ethanol concentration after 24h because the cell looks for a way to survive the lack of energy, and ethanol becomes an optimal solution to survive throughout the culture time. Therefore, after 48h the production of the antibody fragment increases sharply due to the cell being metabolically suited to carry out the expression of heterologous proteins, although these generate an additional requirement as their functions need more energy (Fig. 9).
. Gray boxes explain the pathway favored in the culture at 18°C+1.5%M, the white boxes explain the pathway favored in the other cultures. PDK1: pyruvate dehydrogenase kinase 1; PDH: pyruvate dehydrogenase; PDC: pyruvate decarboxylase; ALDH: acetaldehyde dehydrogenase; LDH: lactate dehydrogenase; ADH: alcohol dehydrogenase; ATP: adenosine triphosphate; PUFA: polyunsaturated fatty acids; ScFv: antibody fragment scFv anti-LDL(−).")
Mechanism of pyruvate pathway regulation in different culture conditions of Pichia pastoris producing antibody fragment scFv anti-LDL(−). Gray boxes explain the pathway favored in the culture at 18°C+1.5%M, the white boxes explain the pathway favored in the other cultures. PDK1: pyruvate dehydrogenase kinase 1; PDH: pyruvate dehydrogenase; PDC: pyruvate decarboxylase; ALDH: acetaldehyde dehydrogenase; LDH: lactate dehydrogenase; ADH: alcohol dehydrogenase; ATP: adenosine triphosphate; PUFA: polyunsaturated fatty acids; ScFv: antibody fragment scFv anti-LDL(−).
It is known that pyruvate dehydrogenase kinase (PDK) inhibits pyruvate dehydrogenase (PDH) activity and decreases the oxidation of pyruvate in the mitochondria, which leads to an increase in the conversion of pyruvate to lactate in the cytosol,28 as noted in Fig. 6 where after the first induction there was a sharp increase in lactate concentration in the cultures at 14°C and 1%M concentration. It suggests that methanol brings about lactate production in the phase transition (glycerol (time 0) to methanol), since as indicated above, the pyruvate concentration showed a sharp drop after time 0, which may mean that the rate of conversion from pyruvate to lactate is faster than the production of pyruvate. Therefore, after the subsequent induction, pyruvate reduces lactate production considerably for all cultures, reaching null presence of lactate in the medium. Lactate accumulation was observed after 24h of induction, which is according to Yip et al.,29 who indicated that this situation can negatively impact cell growth during the fed-batch process. In this regard, the cultures at 2%M and 22°C – 1.5%M and 18°C had lower lactate concentration, but the latter had greater cell growth, while the rest of the cultures maintained a similar growth. Therefore, the lactate concentration is low in the culture at 18°C and 1.5% M, which could be due to lactate in this culture being degraded to generate one molecule of ATP by lactate,30 which would help cell growth (Fig. 9). On the other hand, the lactate concentration was higher in cultures at 14°C and with concentrations of 1%M suggesting that this accumulation will generate some kind of toxicity in the cells, decreasing at the moment lactate is used by the cell.
Other important molecules for yeasts are free fatty acids. Here, after or at the time they are translocated across the plasma membrane they are activated to form an acyl-CoA ester. This activation could trap the fatty acids in the cytosol and make them available for various processes consuming acyl-CoA, such as lipid synthesis or β-oxidation of fatty acids.31 A thiol ester has a high energy bond, allowing easy transfer of the acyl group to the receptor molecules as acetate or acetic acid, which forms acetyl CoA, a precursor for the biosynthesis of fatty acids, flavonoids, certain amino acids, and so on,32 as this process is important to measure free fatty acids in each culture medium studied (Fig. 7). Our results show that at the start of induction the cultures with temperatures of 22°C had high concentrations of these molecules, with similar behavior being observed in the culture at 14°C and 1%M, although slightly, but this was not maintained throughout the induction process. However, the condition at 18°C and 1.5%M began to produce high free fatty acid concentrations after 24h, which could be due to the presence of the alcohol dehydrogenase (ADH) enzyme, which is activated under anaerobic conditions and produces ethanol (data not shown). Then when the oxygen level is restored in the yeast, ADH reverses its activity and generates acetaldehyde; moreover, it could activate the acetaldehyde dehydrogenase (ALDH) enzyme, thereby producing acetate, which would be used to form acetyl-CoA as described by Ke et al.32 Acetyl-CoA would not only be fully used for energy generation, but also for the production of other molecules such as fatty acids, which under suitable conditions make this process favorable for the secretion of endogenous and exogenous molecules (Fig. 9). Importantly, mitochondrial fatty acid oxidation is the major source of ATP, but it is now suggested that the peroxisome also participates in this process. The difference between the two processes is that mitochondrial fatty acid oxidation is coupled to the generation of ATP, whereas the peroxisomal oxidation of fatty acids produces heat. The acetyl group of the acetyl-CoA generated during peroxisomal oxidation is transported to the cytosol, where it is used in the synthesis of cholesterol and other metabolites.32,33 Therefore, some of the free fatty acids measured were produced in the peroxisome and they could be associated with an activation of AOX related to the production of the antibody fragment. High production of antibody fragments observed at any induction times (Fig. 9) could be taking place because the molecules produced as cholesterol favor metabolic reactions and may benefit the appropriate exchange of foreign molecules in the cell (oxygen, methanol, etc.) and vice versa. It must also be taken into account that cholesterol is particularly linked to membrane permeability, which is also associated with the correct diffusion of molecules. In conclusion, this study allows to recognize how culture conditions regulate metabolic pathways, understanding that those associated with the production of fatty acids allow favoring the production of molecules of commercial interest, regulating even the quality of these.
Conflicts of interestNone of the authors have any conflict of interest in the manuscript.
The authors acknowledge the financial support of the Comisión Nacional de Investigación Científica y Tecnológica de Chile (CONICYT) doctoral fellowship awarded to CFT and AZP (Chile), and 2012/50210-9 FAPESP (Sao Paulo Research Foundation, Brazil) (AP and JGF). None of the authors have any conflict of interest in the manuscript.