


Organic decomposition is a complex interaction between chemical, physical and biological processes, where the variety of aquatic vascular plants is essential for the trophic dynamics of freshwater ecosystems. The goal of this study was to determine the aquatic macrophyte Eichhornia azurea (Sw.) Kunth decomposition rate, the time relation with the limnological parameters, and whether this relationship is a result of decomposition processes. To that end, we collected water and leaves of E. azurea in Surf Leopoldo, PR. The experiment consisted of two treatments: 25 containers with 450mL of water and 0.8g of biomass dry weight were used with or without the addition of macrophytes. Samples were collected in triplicate at times 0, 3h, 6h, 12h, 24h, 72h, 120h, 168h and 240h. When the container was removed, the plant material was dried in an oven. After 48h, the material was measured to obtain the final dry weight. Analyses of pH, conductivity, dissolved oxygen, total phosphorus N-ammonia (NH4), soluble reactive phosphorus (PO4) and dissolved organic carbon were performed, and the decomposition rate was calculated. The results showed significant temporal variation of limnological parameters in the study. Additionally, dissolved oxygen, conductivity, dissolved organic carbon and total phosphorus were correlated with the dry weight of the biomass, suggesting that E. azurea decomposition significantly interferes with the dynamics of these variables.
Aquatic macrophytes are important components of ecosystems that provide flood pulse. They have spatial and temporal characteristics that make them interesting for the study of decomposition in aquatic plants.1–3 Macrophytes are often the primary producers, especially in lentic environments. They have a major role in nutrient cycling and in debris formation, being an abundant source of organic matter.4,5 Additionally, they are a mixed stands, which influences the physical and chemical characteristics of water, altering the turbulence, temperature, sunlight penetration, concentration and distribution of dissolved oxygen and nutrients.6
Eichhornia azurea (Sw.) Kunth is a major macrophyte in constrained, flooded environments. It is a floating fixing species, perennial and rhizomatous.7,8 It is distributed in natural and artificial reservoirs from south of the United States to Argentina and in all of the regions and ecosystems of Brazil.9 It serves as food for capybaras, pigs and other herbivores and as a habitat for many fish, insect larvae, snails and their eggs, etc.10 Aquatic macrophytes reach high biomass values, making them an important source of organic material to be decomposed.11 Several studies have hypothesized about the relationship of this macrophyte with others species, such as ephemeropteras,12 fishes,13–17 insects10,18,19 and the endophytic fungal community.20
Plant material decomposition releases much dissolved organic matter into aquatic environments. This produces a quantity of debris capable of regulating the nutrient flow in the ecosystem both spatially and temporally.21 There is a strong link between primary production, decomposition and nutrient cycling.22 Thus, the compounds released during the aquatic macrophyte decomposition can be responsible for most of the energy flow in aquatic ecosystems.23 One way to monitor the mass loss over time is by calculating the decomposition rate. It affects the nutrient release, the accumulation of decomposing material in the sediment and the quality of the detritus,22 and it is usually expressed by the weight loss in a certain period of time.
The metabolic activity of heterotrophic bacteria has important implications for the function of aquatic ecosystems.24 Bacteria and fungi are essential for organic matter decomposition.25 They use a variety of organic compounds under different environmental conditions, extracting energy from these compounds by fermentation and aerobic and anaerobic respiration.26 They convert large amounts of matter into inorganic nutrients. The factors that affect the composition of the bacterial community and its activity have been the basis for many studies in recent years.1,2,27–29 With no evaluation of the mechanisms that regulate microbial food webs and given the area covered by aquatic ecosystems, the functioning of aquatic ecosystems has been only partly described.30
This study investigated the existence of temporal fluctuations of limnological parameters during E. azurea decomposition that simulates the flood pulse because in this period, there is an organic matter input from aquatic macrophytes.
Materials and methodsCollection and assembly of the experimentSamples of water and E. azurea leaves were gathered in the Ressaco Leopoldo (22°45′24″S, 53°16′7″W), located in Puerto Rico, in the Flood Plain of the Alto Paraná River.
The species E. azurea was chosen because it is more common in areas subjected to flooding and because it has high biomass levels.11 In addition, many decomposition studies have been performed with this macrophyte in floodplains.30,31
In the laboratory, the water collected was kept under aeration until the experimental assembly. The macrophytes were dried in an oven for seven days in order to obtain the dry weight.
For the experimental assembly, 51 bottles of polyethylene were used (500mL). An aeration system was used in each individual container. The experiment occurred in an insulated environment in order to maintain a stable temperature. In the experiment, 450mL of water and 0.8g of macrophyte dry weight were added to the bottles.
The mass was based on the values of macrophyte biomass obtained in the environments of the Upper Paraná River Floodplain30 and simulated the decomposition events during the flood pulse.
The increase in E. azurea biomass can simulate the nutrient input effect characteristic of the flood pulse process. In this process, a large biomass concentration decomposes, leading to an increase in nutrient cycling and affecting the microbial loop.32
A control was also performed, in which the same volume of water was added without the addition of the macrophyte dry weight. Samples were taken at 0 (experiment initiation), 3h, 6h, 12h, 24h, 72h, 120h, 168h and 240h. These sampling times represent the leaching period of organic matter decomposition. At each time point, three containers from each treatment were randomly removed, and the plant material contained within was sent to the oven for drying. After 48h, the material was weighed to obtain the final dry weight. Furthermore, 5mL of water was separated for the bacteriological analysis. The remaining volume was used in physical and chemical analyses.
Bacterial density and biomassThe density and bacterial biomass were estimated by filtering 0.1mL of water from the experiment. Black polycarbonate filters (Nucleopore®) with pore openings of 0.2μm, stained with 1mL of the fluorochrome DAPI (4,6-diamidino-2-phenylindole), were used for 5min in the dark. The filters were mounted on slides and stored in the freezer. Bacteria were quantified using an epifluorescence microscope (1000×). The biovolume was determined using the equation proposed by Fry (1990): v=(p/4)·w2(l×w/3), where v=cell volume, l=length, w=width. For the conversion of biovolume to biomass, it was considered that 1μm3=3.5×10⁻¹³gC.13
Abiotic analysisThe dissolved oxygen (mgL−1) levels and the water temperature were determined directly in the bottles using a portable digital oxymeter (YSI-550A). The electrical conductivity and pH values were determined using portable digital potentiometers. An aliquot of 50mL was used for total dissolved organic carbon (DOC) determination, which was carried out by catalytic oxidation at a high temperature (720°C) using the Shimadzu TOC analyzer V-CSN. The remaining water was filtered through a fiber glass filter (Whatman® GF/C) to determine the soluble phosphorus (P-PO43−), ammonia (NH4+), and total phosphorus concentration (TP).33–36
Decomposition rateFor macrophyte decomposition rate determination, the negative exponential model “Wt=W0e−kt” was used, where Wt is the remnant weight fraction of the vegetation at time “t”, W0 is the initial weight and k is the decomposition rate (day−1). This model assumes that a constant fraction of the remaining mass k decays in each time unit.37
Statistical analysisThe ANCOVA covariance test was conducted to determine the existence of significant differences between treatments. The time parameter was used as a covariate.
The data were correlated using the Pearson's linear correlation coefficient (r) to identify which limnological variables were associated with bacterial density and biomass.
A regression analysis was performed to evaluate the main variables of the bacterial community and their power to predict the dependent variable. The regression was performed including all significant factors in the Pearson correlation (independent variables) and excluding non-significant factors (p>0.05), looking for the simplest model by which to produce the most representative parameters (backward stepwise method). The assumptions of these analyses were verified by residues analysis.
All statistical analyses were performed using the statistical package “Statistica” version 5.5.38 The significance level was set at p<0.05.
ResultsE. azurea decomposition rateThe reduction in the dry weight was the most prominent during the first 6h (12.75%). After this time, the dry weight gradually diminished, with the exception of T5 days, when an increase was obtained relative to the earlier and later times. At T8, which represents ten days of decomposition, there was a decrease of 22.38% in dry weight (Fig. 1). The decomposition exponential rate (k) of the macrophyte E. azurea was 0.0025d−1.

According to the results, it can be presumed that the decomposition rate is inversely proportional to time, thus showing that the decomposition is greatest in the first few hours and slows in the following hours.
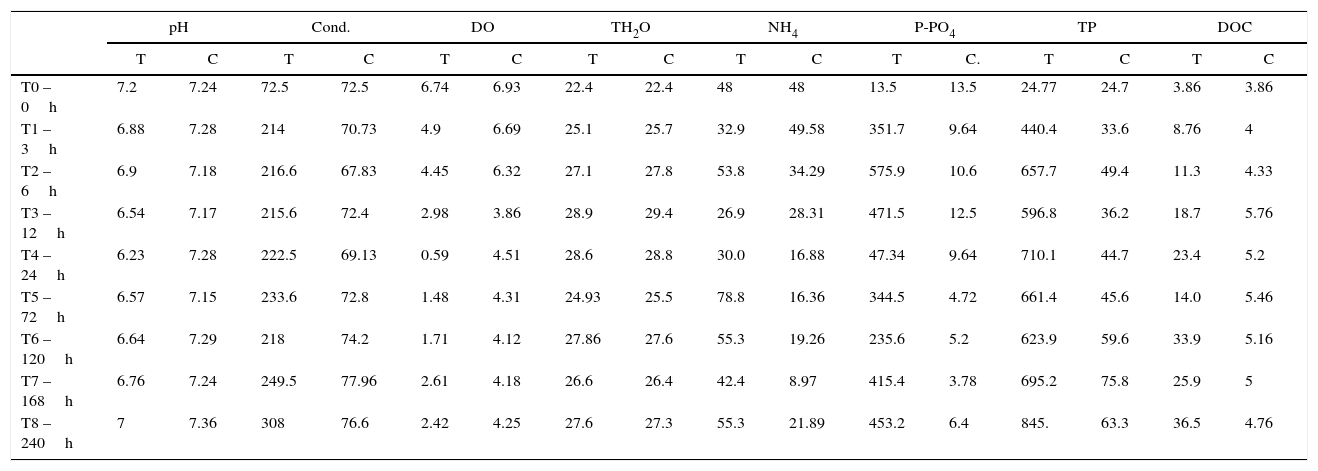
Abiotic analyzesThe abiotic parameters (Table 1) differed between the treatment and control groups.
Limnological data for control and treatment during experiment sampling time (T=treatment; C=control; DO in mgL−1; conductivity in μScm−1; NH4, P-PO43−, TP and DOC in μgL−1).
| pH | Cond. | DO | TH2O | NH4 | P-PO4 | TP | DOC | |||||||||
|---|---|---|---|---|---|---|---|---|---|---|---|---|---|---|---|---|
| T | C | T | C | T | C | T | C | T | C | T | C. | T | C | T | C | |
| T0 – 0h | 7.2 | 7.24 | 72.5 | 72.5 | 6.74 | 6.93 | 22.4 | 22.4 | 48 | 48 | 13.5 | 13.5 | 24.77 | 24.7 | 3.86 | 3.86 |
| T1 – 3h | 6.88 | 7.28 | 214 | 70.73 | 4.9 | 6.69 | 25.1 | 25.7 | 32.9 | 49.58 | 351.7 | 9.64 | 440.4 | 33.6 | 8.76 | 4 |
| T2 – 6h | 6.9 | 7.18 | 216.6 | 67.83 | 4.45 | 6.32 | 27.1 | 27.8 | 53.8 | 34.29 | 575.9 | 10.6 | 657.7 | 49.4 | 11.3 | 4.33 |
| T3 – 12h | 6.54 | 7.17 | 215.6 | 72.4 | 2.98 | 3.86 | 28.9 | 29.4 | 26.9 | 28.31 | 471.5 | 12.5 | 596.8 | 36.2 | 18.7 | 5.76 |
| T4 – 24h | 6.23 | 7.28 | 222.5 | 69.13 | 0.59 | 4.51 | 28.6 | 28.8 | 30.0 | 16.88 | 47.34 | 9.64 | 710.1 | 44.7 | 23.4 | 5.2 |
| T5 – 72h | 6.57 | 7.15 | 233.6 | 72.8 | 1.48 | 4.31 | 24.93 | 25.5 | 78.8 | 16.36 | 344.5 | 4.72 | 661.4 | 45.6 | 14.0 | 5.46 |
| T6 – 120h | 6.64 | 7.29 | 218 | 74.2 | 1.71 | 4.12 | 27.86 | 27.6 | 55.3 | 19.26 | 235.6 | 5.2 | 623.9 | 59.6 | 33.9 | 5.16 |
| T7 – 168h | 6.76 | 7.24 | 249.5 | 77.96 | 2.61 | 4.18 | 26.6 | 26.4 | 42.4 | 8.97 | 415.4 | 3.78 | 695.2 | 75.8 | 25.9 | 5 |
| T8 – 240h | 7 | 7.36 | 308 | 76.6 | 2.42 | 4.25 | 27.6 | 27.3 | 55.3 | 21.89 | 453.2 | 6.4 | 845. | 63.3 | 36.5 | 4.76 |
The parameters analyzed were pH, conductivity (Cond.), dissolved oxygen (DO), water temperature (TH2O), ammonia (NH4), soluble phosphorus (P-PO43−), TP and DOC.
In all of the abiotic parameters studied, there were significant differences between the control and treatment groups (Table 2). All parameters also significantly varied with time (Table 3).
The dry weight of E. azurea had a significant negative correlation with DOC (r=−0.73, p<0.0001), conductivity (r=−0.73, p<0.0001) and P-PO43− (r=−0.70, p<0.0001) and a positive correlation with DO (r=0.80, p<0.0001). This suggests that the dynamics of these factors are closely associated with the decomposition process.
Bacterial density and biomassThe total bacterial density ranged from 4.76×10⁷ to 9.31×10⁷cellsmL−1 in the control group. In the treatment group, the highest density reached 2.95×10⁸cellsmL−1 at the end of the experiment (Fig. 2).

The density variation in the control group had a dynamic very similar to the sigmoid curve. In the treatment group there was a continuous increase in density, except for a decrease that occurred within 72h. At this sampling time, there was also a decrease in DOC (14.0μg/L).
The ANCOVA covariance test showed a significant difference in density between the control and treatment groups (F=20.33 p<0.05).
In the control group (Fig. 3A), the rod density started at 2.95×10⁷cellsmL−1, reaching its highest value in 12h (5.16×10⁷cellsmL−1) and then decreasing until reaching its lowest density at 240h (2.4×10⁷cellsmL−1). The cocci density was the highest at 120h (2.78×10⁷cellsmL−1), and then, it decreased at 168h (2.7×10⁷ and 1.61×10⁷cellsmL−1, respectively). The vibrios density increased with the sampling times, starting with 6.5×10⁶cellsmL−1 and reaching 4.03×10⁷cellsmL−1 at the final time point. The spirillum were only observed at the last sampling time point, with a low density of 6×10⁵cellsmL−1.
 and treatment (B).")
In the treatment group (Fig. 3B), the bacillus density, except for time T7 (8×10⁷cellsmL−1), increased with time, reaching its highest value at T8 (1.26×10⁸cellsmL−1). The highest cocci density was obtained at 120h (4.66×10⁷cellsmL−1), and its lowest density was at 240h (6.83×10⁶cellsmL−1). The vibrios had its highest density at 240h (4.36×10⁷cellsmL−1). The spirillum were only observed at the last four sampling time points, with a density ranging from 1.66×10⁵cellsmL−1 at 120h to 2.16×10⁶cellsmL−1 at 240h.
The biomass values were higher in the treatment than in the control group (Fig. 3A). In the control group, the biomass at time T0 of the experiment was 0.11mgCL−1, reaching its maximum value of 0.22mgCL−1 at 24 and 168h. In the treatment group, the biomass values were crescent, except at 72 and 168h (0.8 and 1.81mgCL−1, respectively), reaching 2.78mgCL−1 by the end of the experiment.
The ANOVA covariance test showed a significant difference between the biomass obtained in the control and treatment groups (F=59.61, p<0.05).
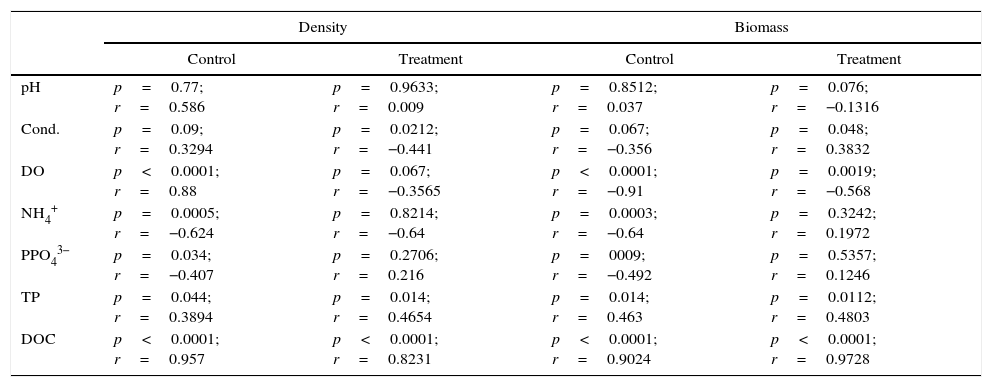
Abiotic and biotic parametersThe parameters DO, NH4+, P-PO43−, PT and DOC were significantly associated with the bacterial density and biomass during the experimental control group. In the treatment group, the parameters conductivity, PT and DOC were significantly associated with biomass and density, while DO was only associated with biomass (Table 4). Both in the control and in the treatment groups, the strongest associations between biomass and density were with DOC.
Results of Pearson's correlation test between bacterial density and biomass with limnological parameters in control and treatment.
| Density | Biomass | |||
|---|---|---|---|---|
| Control | Treatment | Control | Treatment | |
| pH | p=0.77; r=0.586 | p=0.9633; r=0.009 | p=0.8512; r=0.037 | p=0.076; r=−0.1316 |
| Cond. | p=0.09; r=0.3294 | p=0.0212; r=−0.441 | p=0.067; r=−0.356 | p=0.048; r=0.3832 |
| DO | p<0.0001; r=0.88 | p=0.067; r=−0.3565 | p<0.0001; r=−0.91 | p=0.0019; r=−0.568 |
| NH4+ | p=0.0005; r=−0.624 | p=0.8214; r=−0.64 | p=0.0003; r=−0.64 | p=0.3242; r=0.1972 |
| PPO43− | p=0.034; r=−0.407 | p=0.2706; r=0.216 | p=0009; r=−0.492 | p=0.5357; r=0.1246 |
| TP | p=0.044; r=0.3894 | p=0.014; r=0.4654 | p=0.014; r=0.463 | p=0.0112; r=0.4803 |
| DOC | p<0.0001; r=0.957 | p<0.0001; r=0.8231 | p<0.0001; r=0.9024 | p<0.0001; r=0.9728 |
Multiple linear regression analyses were calculated to develop a prediction model for bacterial density in the control group. The analysis suggested that DO and DOC compose the model (N=27, F(5, 21)=152.23, p<0.0001), with an R2=0.97. The model predictions are represented by the equation below:

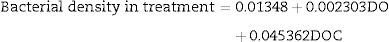
The bacterial density in the treatment group only had DOC as a significant parameter in the regression analysis (N=27, F(1, 25)=26.734, p<0.00002), with R2=0.93. The model predictions are represented by the equation below:

The bacterial biomass in the control group had only DO and DOC as significant parameters in the multiple regression analysis (N=27, F(2, 24)=138.94, p<0.000001), with R2=0.9204. The model predictions are represented by the equation below:
The bacterial biomass in the treatment group was only significant with COD in the analysis of multiple linear regression (N=27, F(1, 25)=440.56, p<0.000001) with R2=0.9463. The model predictions are represented by the equation below:
DiscussionE. azurea decomposition
Dissolved and particulate organic detritus decomposition influences the energy and material flows in lake ecosystems.23
The gradual biomass loss was most intense in the early time points and slowed over time. The biomass loss dynamics are associated with water-soluble compound release, which is most intense in the early hours.39 The weight loss and changes in the chemical composition of the E. azurea debris are affected by these chemical characteristics at the beginning of the decomposition process and by where, geographically, the process occurs.30
The k value for this study was 0.023d−1. The average decomposition coefficient of E. azurea leaves proposed by Petersen and Cummins was 0.0033d−1.40 This coefficient was classified as “slow” by the same authors. In the decomposition study of E. azurea performed by Padial and Thomaz,30 the k for seven days was 0.010d−1. These values show that there is variation in the decomposition rate, even within the same species. This variation is influenced by the chemical and physical conditions of the environments, the microbial diversity, and the chemical composition of the debris.22,30 Studies in areas subject to flooding have shown that the decomposition rate is also affected by the type of environment (lotic or lentic) and water quality.30
The decomposition process still influences the physical and chemical characteristics of water.30 This mostly occurs in tropical regions, where the river system floodplains show marked temporal variation in physical, chemical and biotic factors. Such variations are, mainly, related to changes in hydrometric levels, which have been attributed to the ‘flood pulses’ theory.41 The dry weight loss in this study was correlated with DOC and PT. According to Sridhar and Barlocher,42 high nutrient concentrations are correlated with increased submerged biomass decay rates. One of the factors that influences the degradation of this material is its nutrient concentration.43 There is a positive relationship between the decomposition rate of plants and the phosphorus concentration of their tissues. Total phosphorus is the best indicator of the nutrient content in any ecosystem. This may explain the significant correlation between phosphorus and the dry weight of E. azurea.44
Bacterial density and biomassThe microorganisms found in an aquatic environment are determined by the physical and chemical conditions that prevail in that environment.45 They qualitatively and quantitatively vary for long periods or on a short time scale.46 Thus, temporal variations affect the population ecology and modify the structure and function of the microbial communities.29
Generally, the bacteria density ranges between 105 and 108cellsmL−1 and can increase with the environment trophic status.47 In this study, the bacterial density was 107 in the control group, reaching 108 in the treatment group. Teixeira et al.,48 working in similar environments, found bacterioplankton densities varying between 1.3±0.7×10⁹cellsL−1 and 22.0±4.7×10⁹cellsL−1. The increase of density with the E. azurea biomass can simulate the effect of the typical nutritional contribution of the flood pulse process when large amounts of biomass decompose, causing an increase in nutrient cycling. In our experiment, we observed an increase in the density and bacterial biomass during the decomposition process. Studies performed in the Parana River determined the bacterial abundance and production rates in the low water period, but the differences were not significant in the studies in the Parana River, while the bacterial abundance was significantly higher during the flood.32 Previous studies found greater bacterial abundances and production rates in the low water period, but the differences were not significant.20,49
Gene expression can provide valuable information regarding both structural and functional bacterial populations in aquatic ecosystems.50,51 In general, small bacteria (cocci) inhabit waters with low nutrient concentrations. Larger bacteria (bacillus, vibrios and spirillum) are more common in enriched environments with organic matter.52,53 Thus, the bacterial population composition may be modified according to the trophic level.54
The coccus density was increased during the treatment until T6, decreasing thereafter. Concomitantly, the density of the vibrios and spirilos increased after T6. Because these bacteria have a spherical cell shape, environments with a greater availability of resources facilitate the metabolic activity of these organisms with regard to both the amount of nutrients available in the environment and the ability to drive nutrients into the cells.55 However, factors such as competition may limit resources, thus controlling organism density.
Abiotic factors and bacterial biomass densityBacterioplankton growth is dependent on the availability of inorganic nutrients. The change in the concentration of nutrients can have direct and indirect effects on bacterial growth.56,57 The electrical conductivity was significantly correlated with the density and bacterial biomass only in the treatment group. According to Esteves,44 conductivity values are related to the trophic state of the water. Thus, increased nutrient concentrations from the decomposition and subsequent release of ions affected the conductivity.
In this experiment, there was a negative correlation between biomass and DO in the control and treatment groups. This indicates the microorganisms’ action in organic matter decomposition and the formation of anoxic zones.
The P-PO43− was positively correlated with the biomass and bacterial density only in the control group. In other studies, this correlation has also been found.58 This result may represent a bottom-up control of the bacterial community20,59 because phosphorus is an essential nutrient for bacterial growth and is often limited in the environment.60 This concept is most evident by the fact that this correlation occurred only in the control group, where the P-PO43− decreased with time, suggesting its assimilation by the bacterial community. Therefore, in the treatment group, where nutrients were supplied from E. azurea decomposition, the P-PO43− was not a limiting factor of bacterial growth.
Using multiple linear regression analysis, we verified that the DO and DOC are the major variables that explained bacterial dynamics. The DOC strongly affects the bacterial dynamics, as the heterotrophic planktonic bacteria are associated with the carbon metabolism in a pelagic environment.1 A great part of the dissolved organic matter can be consumed by these organisms.47,61 As the DOC is generally regarded as a growth limiting factor of bacterioplankton,62,63 a strong association between bacterioplankton and DOC likely occurs.
Despite its ecological importance, knowledge regarding the diversity of aquatic environments and the factors that control the freshwater bacterioplankton composition is far from complete.49
Conflicts of interestThe author has no conflicts of interest to declare.
We thank Maria do Carmo Roberto (Maringá State University) for field assistance and nutrients analysis, CAPES (Coordenação de Aperfeiçoamento de Pessoal de Nível Superior) scholarships and CNPq (Brazilian Council of Research). This study was also supported by the “Long-Term Ecological Research” (LTER) program of CNPq (Brazilian Council of Research).