


Nanosilica (NS) powders were synthesized from sodium silicate solution (SSS) and their effects on ceramics engobes were investigated. Synthesized NS powder was subjected to various characterization studies by transmission electron microscopy (TEM), X-ray diffractometry (XRD), X-ray fluorescence spectroscopy (XRF), Brunauer–Emmett–Teller (BET) method, Fourier transform infrared measurements and gravimetric/differential thermal analysis (TGA and DTA) techniques. The results indicate that the synthesized NS consisted of pure silica particles (96.8%) with the particle size in the range 8.64–18.31nm, amorphous structure having surface area 160.29m2/g and the thermal analysis show that the weight losses of 6.23. The study showed that NS powder significantly improved physico-chemical properties of prepared ceramics engobes such as whiteness, thermal expansion coefficient (TEC), the crystallinity, water absorption (WA), linear shrinkage (LSH), breaking strength and bulk density (BD). The study can serve as theoretical basis for further traditional ceramics applications of NS powder. The best results were found when the NS powder content increases, whiteness as well as linear shrinkage increased whereas thermal expansion coefficient, water absorption and bulk density decreased.
Se sintetizaron polvos de nanosilica (NS) a partir de una solución de silicato de sodio (SSS) y se investigaron sus efectos sobre los engobes de cerámica. El polvo de NS sintetizado se sometió a diversos estudios de caracterización mediante microscopía electrónica de transmisión (TEM), difractometría de rayos X (DRX), espectroscopía de fluorescencia de rayos X (FRF), método Brunauer-Emmett-Teller (BET), transformada de Fourier. Mediciones infrarrojas y técnicas de gravimetría/análisis térmico diferencial (TGA y DTA). Los resultados indican que el polvo de NS sintetizado consistió en partículas de sílice pura (96.8%) con el tamaño de partícula en el rango (8.64-18.31), estructura amorfa que tiene un área de superficie de 160.29m2/g y el análisis térmico muestra que las pérdidas de peso de 6.23. El estudio demostró que el polvo de NS mejoró significativamente las propiedades físico-químicas de las cerámicas preparadas como la blancura, el coeficiente de expansión térmica (TEC), la cristalinidad, la absorción de agua (WA), el encogimiento lineal (LSH), la resistencia a la rotura y la densidad aparente (BD). El estudio puede servir como base teórica para otras aplicaciones de cerámica tradicional del polvo de NS. Los mejores resultados se encontraron cuando aumenta el contenido del polvo de NS, la blancura y la contracción lineal aumentaron, mientras que el coeficiente de expansión térmica, la absorción de agua y la densidad aparente disminuyeron.
Nanotechnology is one of the most active research areas with both novel science and useful applications that has gradually established itself in the last two decades [1]. Also, it is growing very rapidly and has infinite applications in almost everything. It is deals with the synthesis of nanoparticles and their applications; nanoparticles are smaller than the micro particles and have a higher area to volume ratio which gives the surface properties more influence than the same particle with a larger size. Nanoparticles belong to be prospective materials in the field of civil engineering. Nano-materials have important applications such as in: health, medical treatments, environments, fabrication, information, techniques and energy sources [2,3]. Some researchers have employed nanoparticles into cementitious materials based on Portland cement aiming to modify mechanical strength and durability of this system [4].
Silicon dioxide is one of the most important utilized nano-materials, it used in variety of applications and its use has increased by 5.6% per year to reach a projected 2.8 million tons in 2016 [5]. Silica may be either amorphous or crystalline. The amorphous silica is silica gel, precipitated silica, colloidal silica sols, and non-porous (pyrogenic silica). The crystalline forms of silica are cristobalite, quartz and tridymite [6]. NS has high surface area making it attractive for a wide range of application such as, reinforcing filler in rubber industry [7], enhance plant development, growth and yield of many crop species [8], improve the properties of concrete [9,10], food industry [11], medicine [12,13], insecticide industry [14], painting field [15,16], as adsorption materials in recyclable ceramic membrane [17], preparation of glass ceramic system (SiO2–Al2O3–CaO–CaF2) [18]. It was produced by different procedures which differ in energy consumption, used raw materials and the optimum conditions, such as surrounding temperature, time of precipitation, pH, addition of coagulant, and methods of washing as well as drying. These factors influence on the size of the SiO2 particles, their aggregation and specific surface area. One example of these methods, production by sol–gel process for rice husk (RH) [7,8].
Jafari and Allahverdi developed method for production of NS from silica fume using an acid-base precipitation technique [19]. Also, Mourhly et al. developed another method for preparing of mesoporous NS from Pumice Rock [20]. Lazaro et al. extracted amorphous nanosilica from the dissolution of olivine in acid [21].
Nanosilica can be prepared by ball milling method [22]. Its powder can be prepared also from Na2SiO3, which is low cost raw material [23–25].
This study aims to synthesize of nanosilica using simple methods as well as low cost materials (sodium silicate solution) in the absence of burning process, which consumes a large amount of fuel and its usage in traditional ceramics industry.
Nanosilica can be used in the traditional ceramics to improve their physico-chemical properties. In this work we study the layer which coats the floor and wall tiles which called “engobe” and investigate the effect of prepared NS with high surface area and amorphous in nature to improved their properties such as thermal expansion, crystallization temperature, whiteness, water absorption, linear shrinkage and bulk density.
Engobe can be defined as a coating layer (under glaze layer) that used to opacify the ceramics surface and produce the required color properties. Engobe plays a very important role in the production of floor and wall tiles because this layer between the ceramic body and glaze improves the coefficient of thermal expansion (TEC) matching and prevents water stains from appearing on the ceramic surface [26].
Experimental methodsRaw materialsLiquid sodium silicate Na2SiO3 (Egyptian-Saudi Co.), conc. HCl (30–34%) (El Nasr Pharmaceutical Chemicals Co., Egypt), floor tiles were supplied by Ceramica Royal Co. (El-Obour City, Egypt), silica sand (SiO2) (Egypt), sodium feldspar (albite) (Na2O·Al2O3·6SiO2) (Minas Co., Egypt), ball clay or white clay ((H. blue), England), (kaolin Bulgaria) and industrial frit (Ferro Egypt, code No. 1054).
Preparation of nanosilica (NS)Silica nanoparticles were prepared by drop wise addition of conc. hydrochloric acid (HCl) to 500ml of sodium silicate solution with constant stirring at room temperature (20–23°C) until pH equal to 8–9, silica gel was produced, the gel obtained was aged for 24h at room temperature, after this filtration occurred to separate the precipitate from water and remove the filtered water, then washing stage carried out with hot distilled water several times until free from chloride was tested using dilute AgNO3 solution. The solution was filtered and nanosilica powder was collected after drying at 90°C for 18h, the obtained white silica particles were ground in rapid mills for 30s.
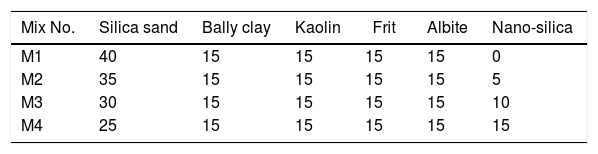
Preparation of engobes mixturesThe raw materials powders (ball clay, kaolin, albite, silica sand, industrial frit and synthesized nanosilica) were used for preparation of four mixtures of engobes by weighting of these materials and ground it in rapid mills for 1h. The percent of raw materials used are tabulated in Table 1, this step called dry milling which screened with sieves size lower than 63μm particle size by sieves analysis system.
We notice that, the four mixtures of engobes were mixed with 30 (wt.%) tapped water, mixtures with NS addition needs more water in order to keep the workability of the mixtures constant, also NS exhibits stronger tendency for the formation of agglomerates is expected. So, it is necessary to use a dispersing additive or plasticizer to minimize this effect, thus addition of 0.3wt.% of sodium tripoly-phosphate (STPP) as deflocculates to improve engobes slip properties in mixtures mills and rapid ground for 5min to obtain homogenized slurries (1780g/L), this step called wet milling, then we consider the M1 as blank sample and make slips between M1 and M2 by ceramic instruments a rectangle iron funnel with spreading techniques onto 41×41cm2 green floor tiles (which were hot and subjected to air compressor to clean their surface from any impurities and spraying with water).
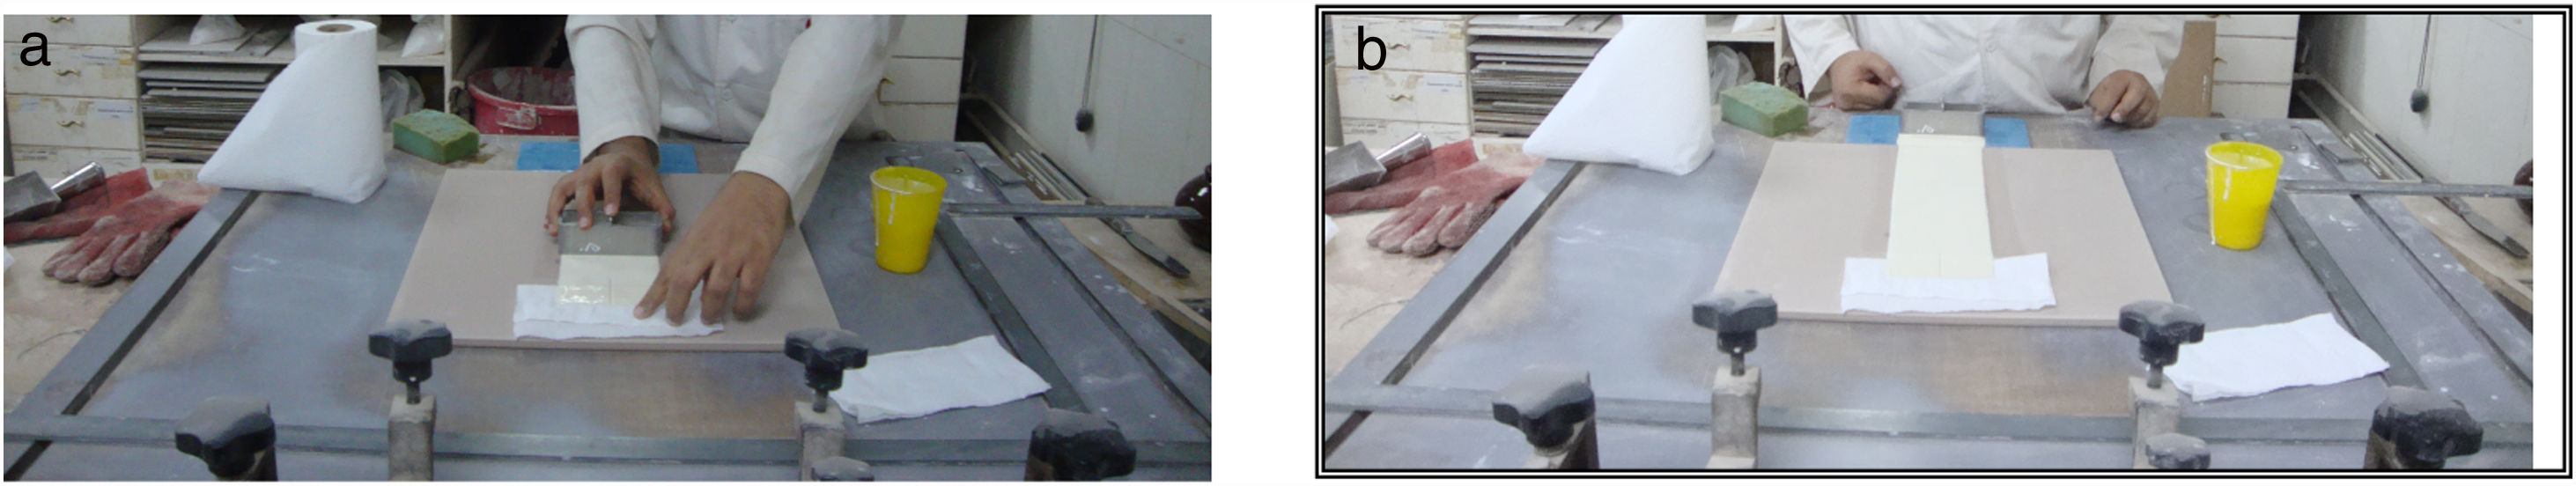
Fig. 1 illustrates the spreading techniques occurred by iron rectangle funnel which placed on the surface of the green and clear floor tile then the M1 was poured in one side of the funnel and M2 in the other side. The funnel pull on the surface of the green tile with constant speed and the thickness of the slide were controlled by which the funnel face we used, to produce the coating with the same thickness of 0.45mm. Repeat this step between M1 with M3 and between M1 with M4. The engobed tiles were dried in dryer for 1h at 150°C and then fired in the production kiln (SACMI-kiln, Made in Italy), at 1175°C for 38min to compare whiteness of the mixtures with different percentage of NS and the blank one.

After whiteness test carried out, we dry the four mixtures slurries at 150°C for 8h and ground in rapid mill for 5min, screened with sieve size of <63μm and the chemical composition of the four mixtures were obtained by XRF. The four mixtures powder were humidified by 6wt.% tapped water and screen in wide sieve, after sieving takes place we weight 100g from each mix and pressed at 200bars to make seven specimens from each mixture with 5×10cm2, drying the specimens takes place at 150°C for 2h to evaporate water and dry shrinkage occurred, after drying measure the initial length (L1). The four drying specimens fired in laboratory kiln (Ceramic Instruments srl-SASSUOLO-ITALY) at 1100, 1150, 1200, 1225 and 1250°C for 1h and measure the length of fired specimens (L2). Fired specimens were used to characterize the physical properties of the materials according to Egyptian Standard Specifications (ESS 293) and International Organization for Standardization (ISO 10 as well as 545). Water absorption, bulk density and linear shrinkage were calculated [27].
Characterization methodsThe prepared NS powder as well as ceramics engobes were subjected to various characterization studies for identification of their structure and particle size such as:
The transmission electron microscope (TEM) used for identification of particle size of NS and their structure. (JEOL JEM-2100 electron microscope was operated at 200kV) [28].
Nova type was used for measuring total pore volume and surface area. Surface areas of the different materials were determined using standard volumetric method by nitrogen adsorption at 0°C and out gas temperature of 150°C for 2h [29].
The stoichiometry of the components was specified using Philips sequential X-ray spectrometer-2400 [30].
The crystalline structure was detected by the X-ray diffractometer (XRD) technique. Measurements of XRD patterns of materials were carried out using a Bruker D2 Phaser 2nd Gen. The analysis was carried out using X-ray diffractometer with Cu anode (λ=1.5406Å), generator tension at 30kV and generator current 10mA.
Differential and gravimetric thermal analyses (DTA/TGA) using a Shimadzu DTG-60/60H in which the Sample of NS (20mg) was analyzed with sample holder made of Al2O3 in N2 atmosphere. Alumina powder as reference material and maintaining the heating rate at 20°C/min.
FTIR spectra were recorded by (BURKER-VERTEX 70 – Germany) using KBr disc method.
The whiteness of the mixtures of engobes was measured by colorimeter (X-Rite® SP62-162, EB05, 004840, made in USA).
Determination of water absorption (WA) and bulk density (BD) was carried out on the samples according to both the ESS 293 and ISO 10 & 545 [27]. WA test was determined by vacuum method which divided into three main stages, vacuum time (30min), submission time (30min) and empty time (20min). We weight all fired specimens before and after test and recorded as W1 and W2, respectively. Water absorption can be calculated according to the following Eq. (1)[27].

When W1 is the mass of dry specimens. W2 is the mass of immersion specimens under vacuum.
Bulk density (BD) is the mass divided by bulk volume [31]. BD or Archimedes immersion test carried out after WA test immediately, in which the weight of each specimen was determined while suspended in water. Weighting was carried out by placing each specimen in basket that is suspended from one arm of the balance and this specimen immersed in water, results were recorded as W3. BD can be calculated according to the following Eq. (2)[27].
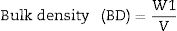
When V is the external volume calculated using the following Eq. (3)

W3 is the mass of the suspended specimens.
Thermal expansion coefficient (TEC) test was carried out by dilatometer (Misura (SD)). The apparatus measures the expansion of the fired bar length during desired heating temperature range.
Linear shrinkage as mentioned above, the initial length of the specimens was measured before firing and the final length after firing were measured also. The shrinkage can be calculated from the following Eq. (4)
where L1 is the initial length before firing. L2 is the final length after firing.
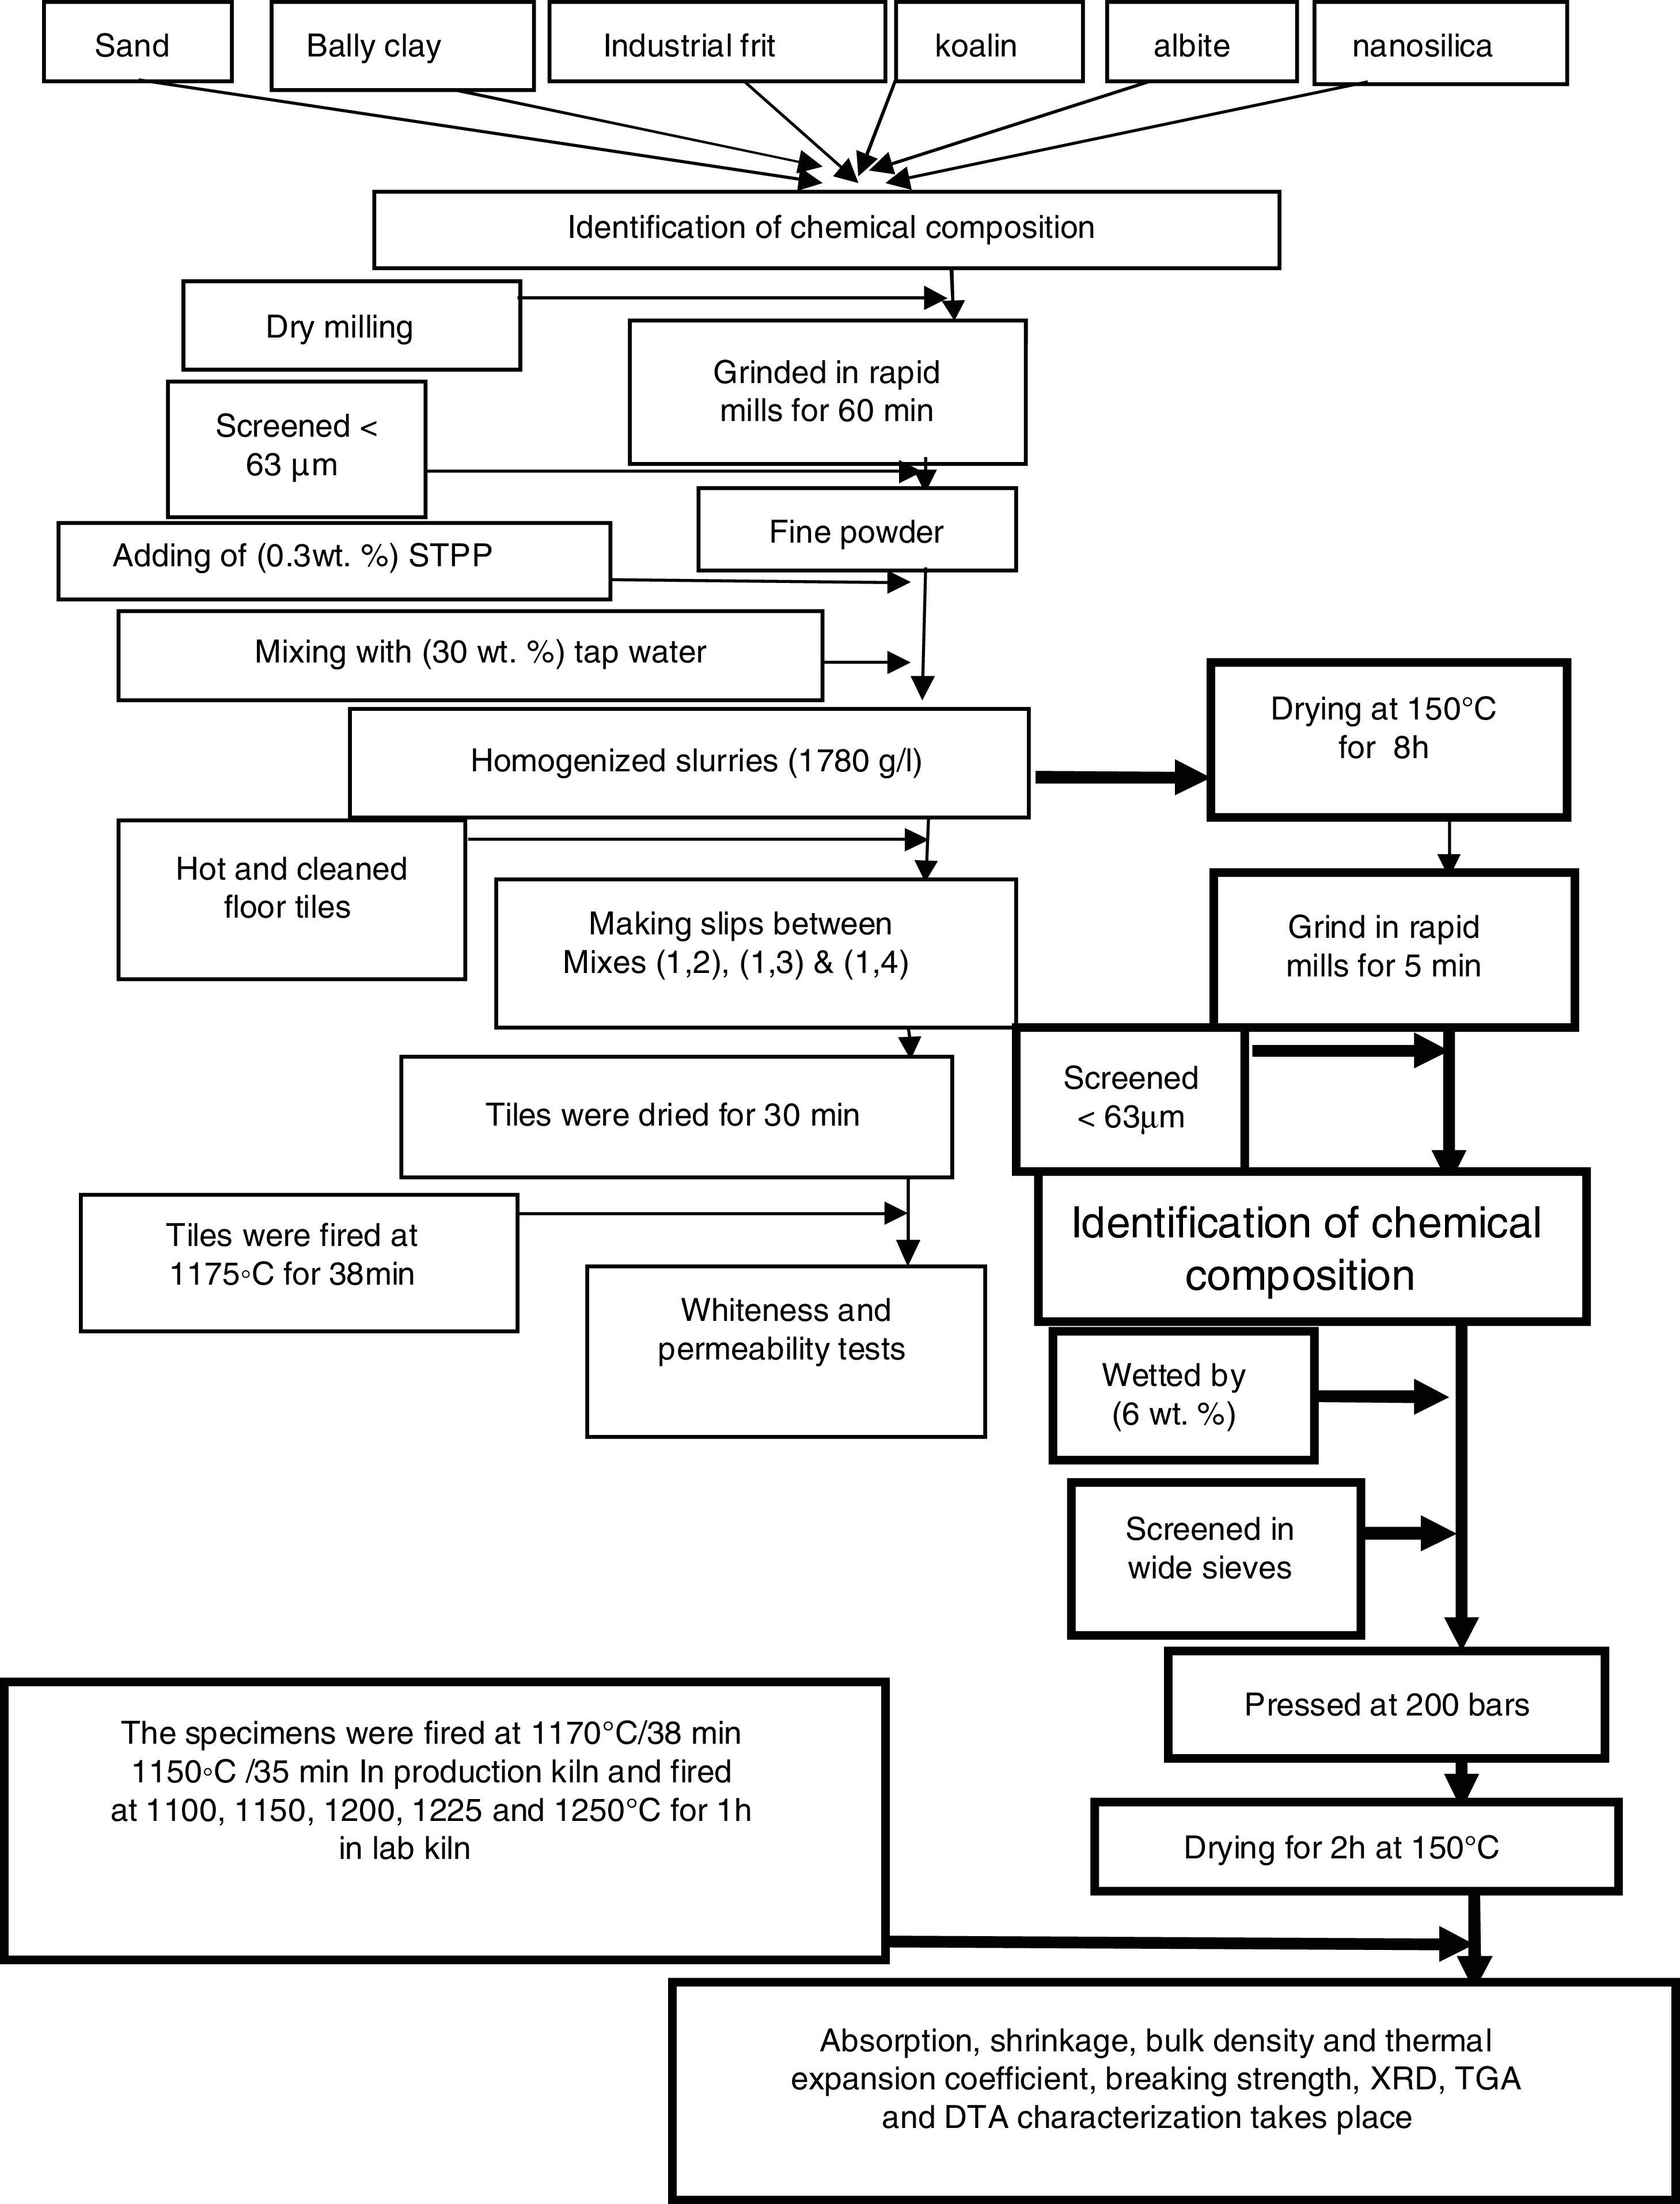
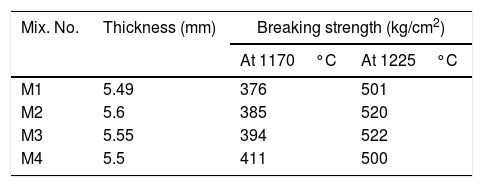
The determination of the breaking strength takes placed by MOR-TS/125–800kg. It is possible to draw a simplified chart to explain the previous steps as shown in Fig. 2.
Results and discussionCharacterization of nanosilicaSurface area and porosity
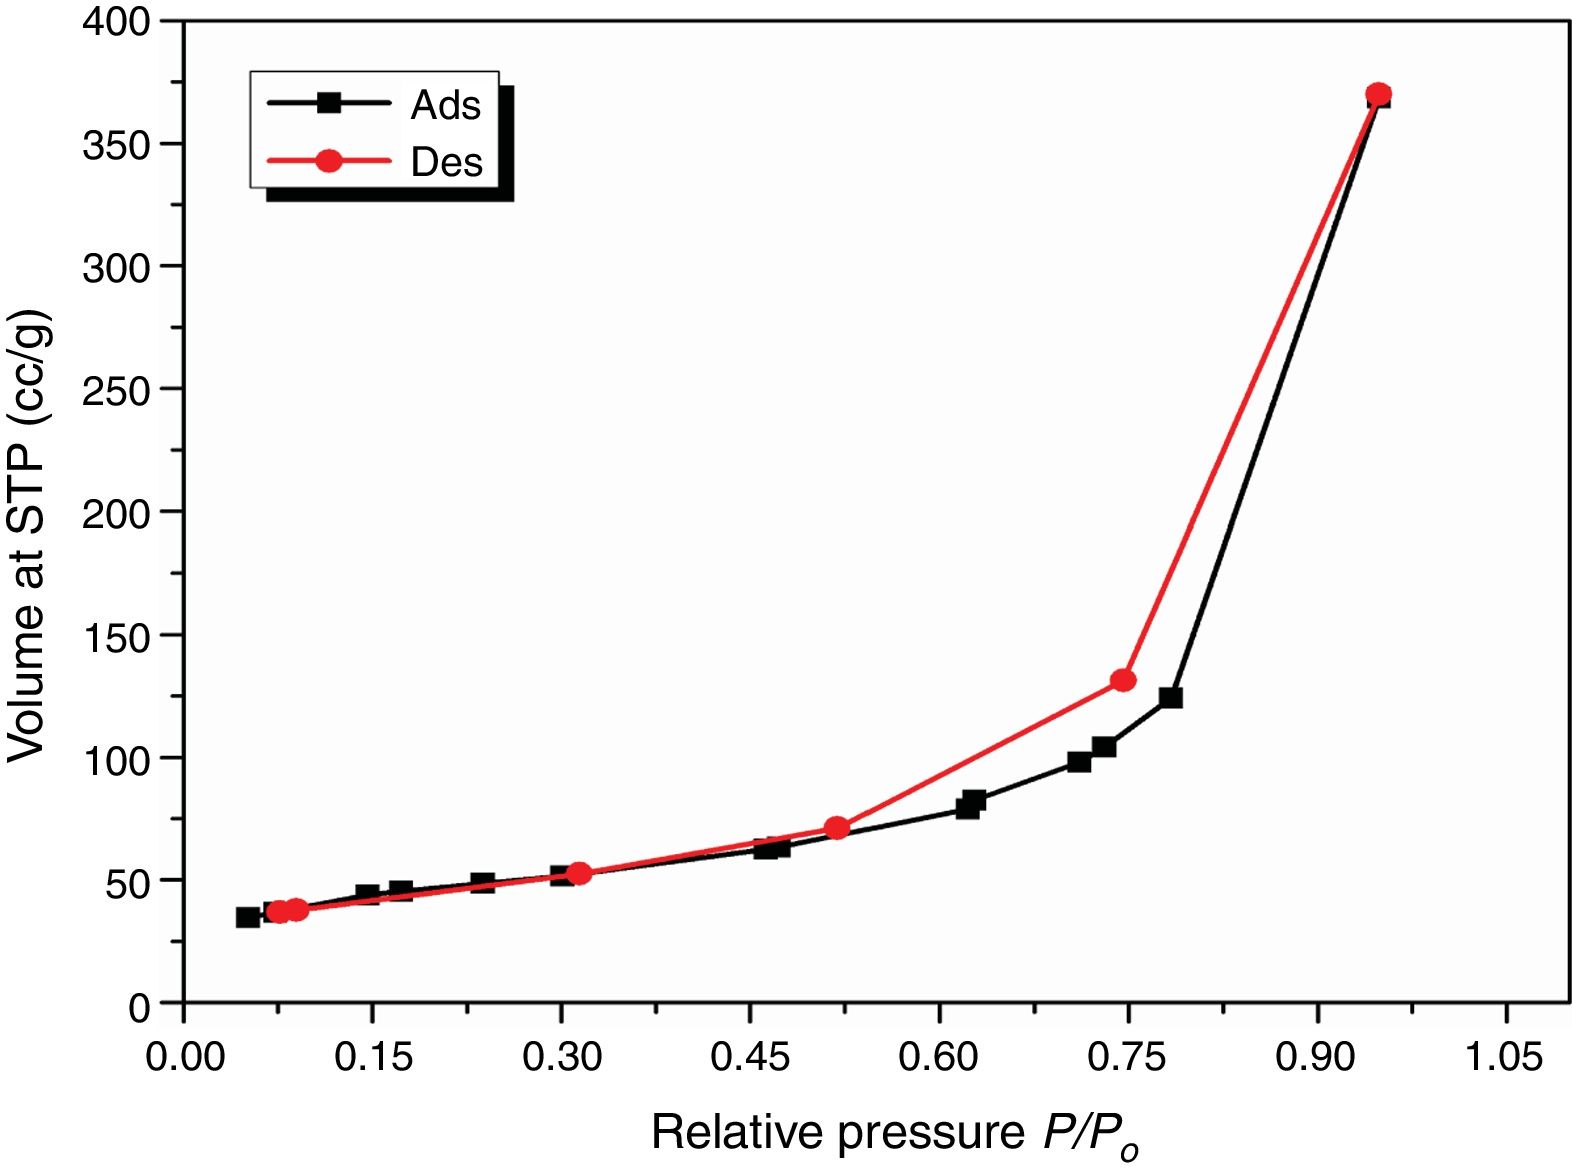
Fig. 3 is used to determine the surface area and pore texture, i.e. SBET (m2/g), pore volume (cc/g), and average pore radius (nm). Surface area (SBET, m2/g) can be obtained using the following BET equations (5) and (6)[32].
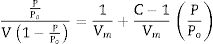
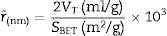

Since V is the volume of nitrogen (cm3/g) that is adsorbed at equilibrium pressure P, Po is the saturation vapor pressure, Vm is the monolayer capacity (cm3/g), and C is called BET-constant, r¯(nm) is the average pore radius, VT is the adsorbed volume near saturation and SBET is the surface area.
The obtained value of the surface area was found to be 160.29m2/g, which is higher than the value which obtained by Enobong et al. [23] (SBET=5.02 m2/g). Also, it is higher than the porous silica which synthesized by Musić et al. [24] (SBET=130m2/g). While the total pore volume of 0.57cm3/g exceeds that reported for silica nanoparticles (0.195ml/g) derived from rice straw ash which prepared by Hessien et al. [33].
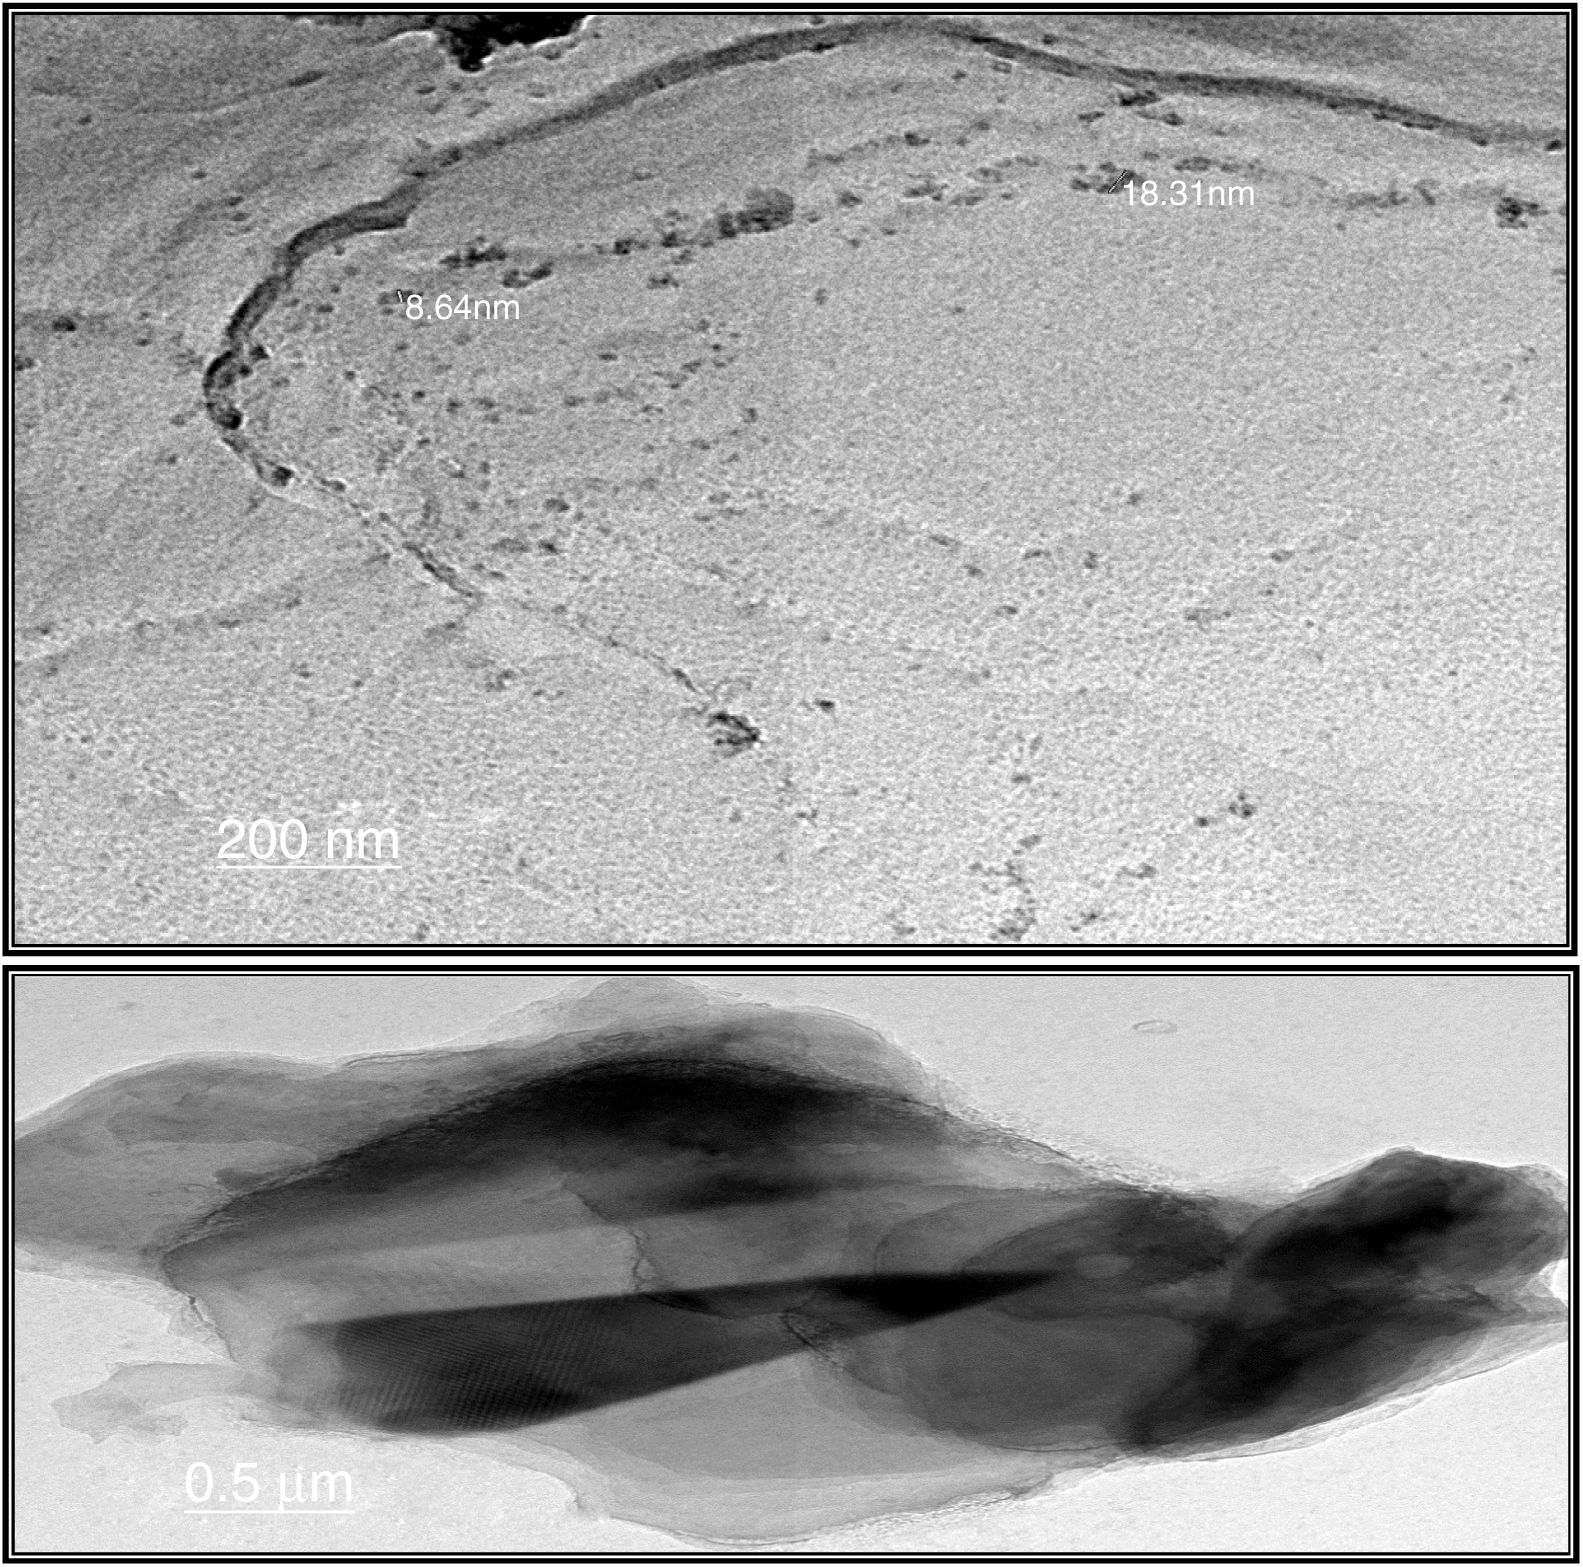
Transmission electron microscopeThe surface morphologies of prepared silica are displayed in Fig. 4. The particle sizes of extracted silica are of a nanometric scale, with diameters in the range of 8.64–18.31nm which is smaller than that reported for silica nanoparticles (50–450nm) derived from rice straw ash which prepared by Lu et al. [34], and that reported by Hassan et al. [32], for nanosilica (20–25nm) which synthesized from rice husk ash by surfactant-free sol–gel method. TEM micrographs of the synthesized nanosilica powder showed that the particles were in agglomerated form with spherical morphology.
Elemental analysis of prepared NS and its purity
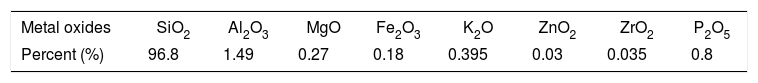
The chemical composition of prepared nanosilica and its purity was determined using XRF technique and the results obtained in Table 2. It is clear that the prepared sample contains 96.8% of silicon dioxide and the rest of it is in different residual oxides which are the part of the prepared nanosilica sample. The increased of alumina oxide may be attributed to crack of the alumina balls milling.
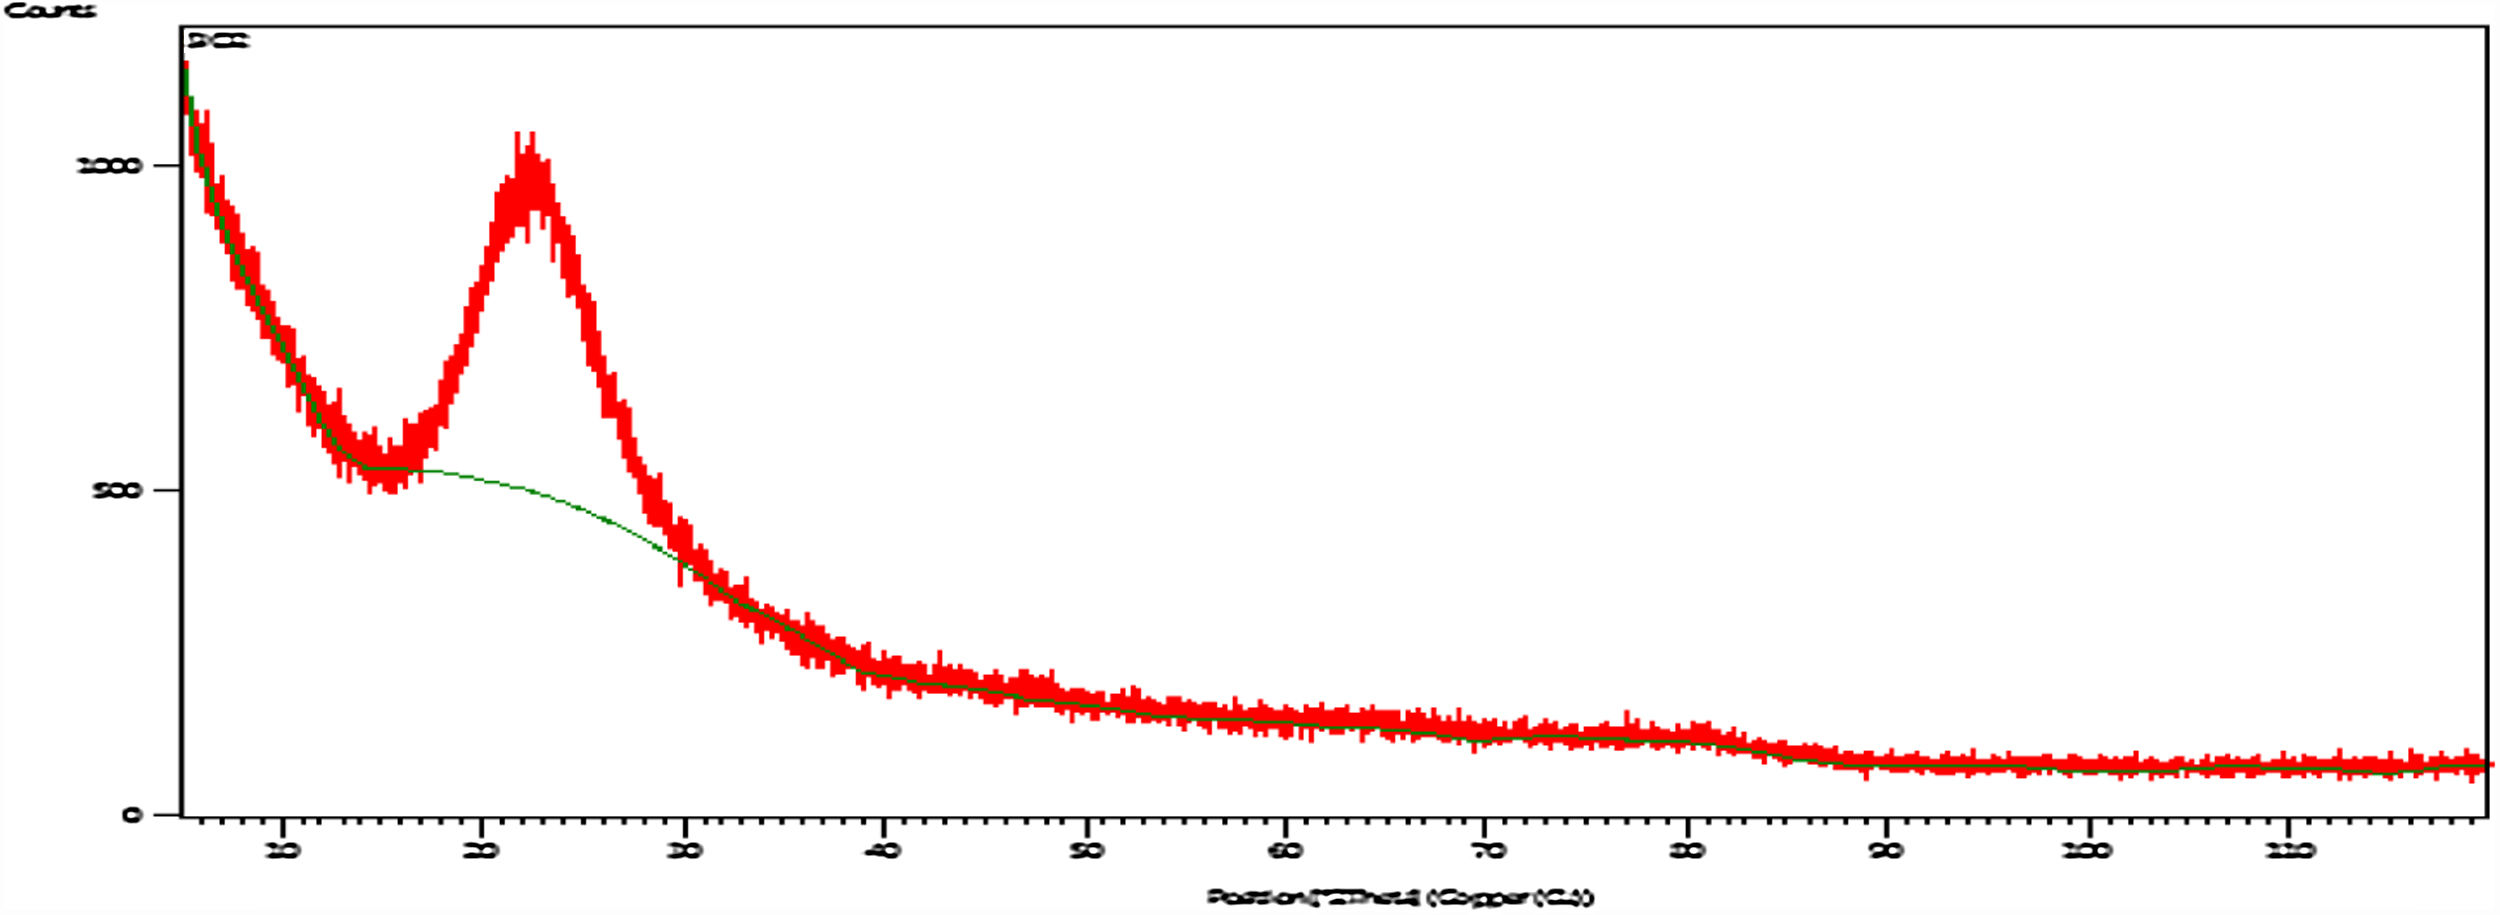
X-ray diffraction (XRD)Fig. 5 shows XRD pattern of the silica particles, the spectrum appears as a broad band at 2θ=22°, which indicates the disappearance of crystalline phases and confirms amorphous state of the sample and contains pure SiO2. The disappearance of the sharp peaks and the softness of the band also indicate that the absence of peaks of the possible impurities [8].
Fourier transforms infrared spectroscopy (FTIR)
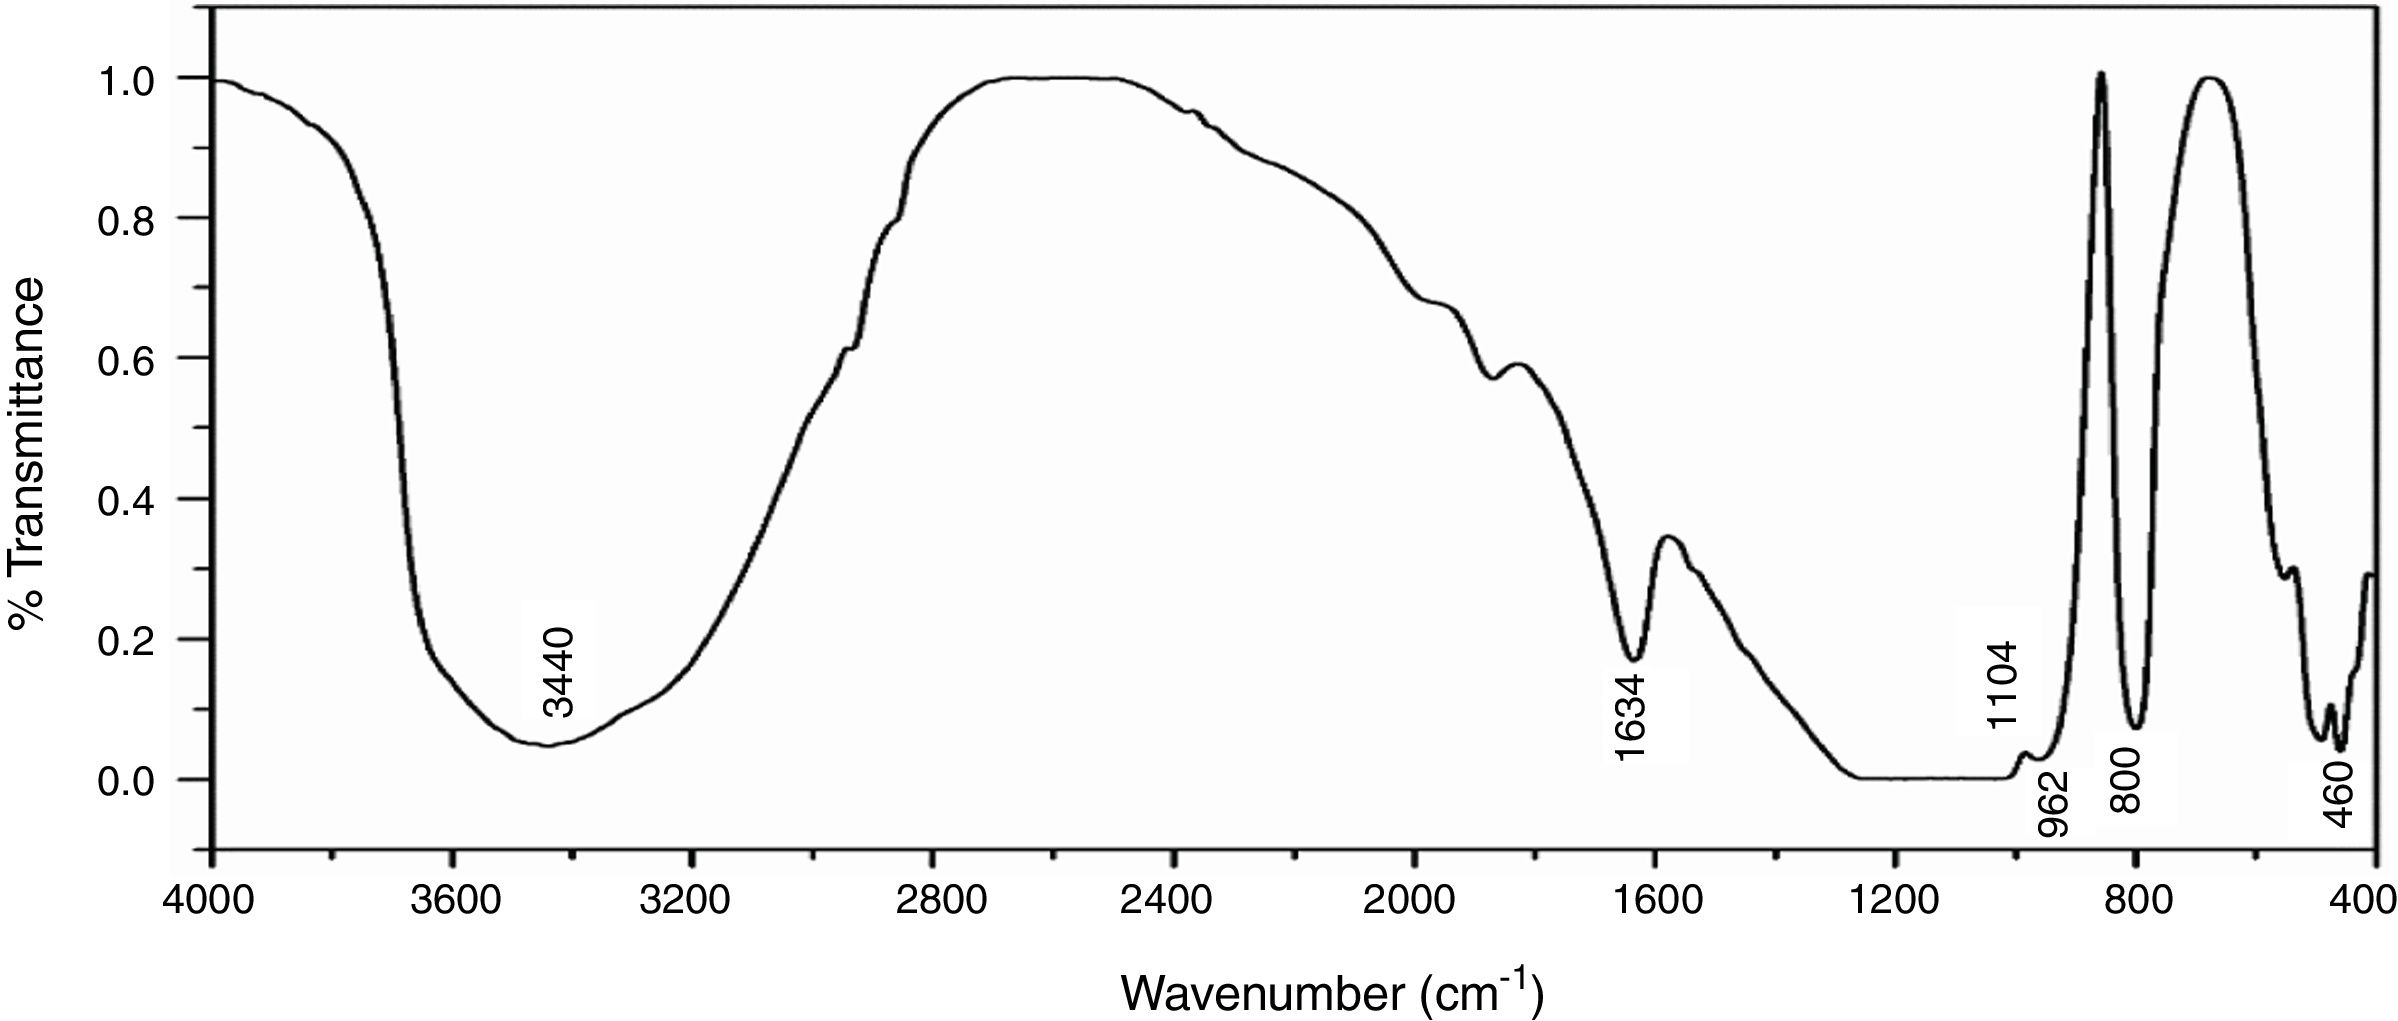
Fig. 6 shows the infrared spectra of NS which was examined by FTIR technique in the range of 4000–400cm−1, the broad band around 3440cm−1 is characterized by (OH) stretching vibration of the silanol or adsorbed water molecules on the surface of NS, the bending vibration of the trapped water molecules in the silica was detected at 1634cm−1 which could not be completely removed by heating [35]. The predominant band at 1104cm−1 corresponds to the asymmetric vibration of the siloxane bond Si–O–Si [20], the presence of an absorption band at 800cm−1 is assigned to the stretching vibration of Si–O–Si bond. The band observed at 460cm−1 is due to the bending vibration of Si–O–Si bond. The presence of shoulder at 962cm−1 is ascribed to the bending vibration of the silanol group (Si–OH) [34].
Differential and gravimetric thermal analyses (DTA/TGA)
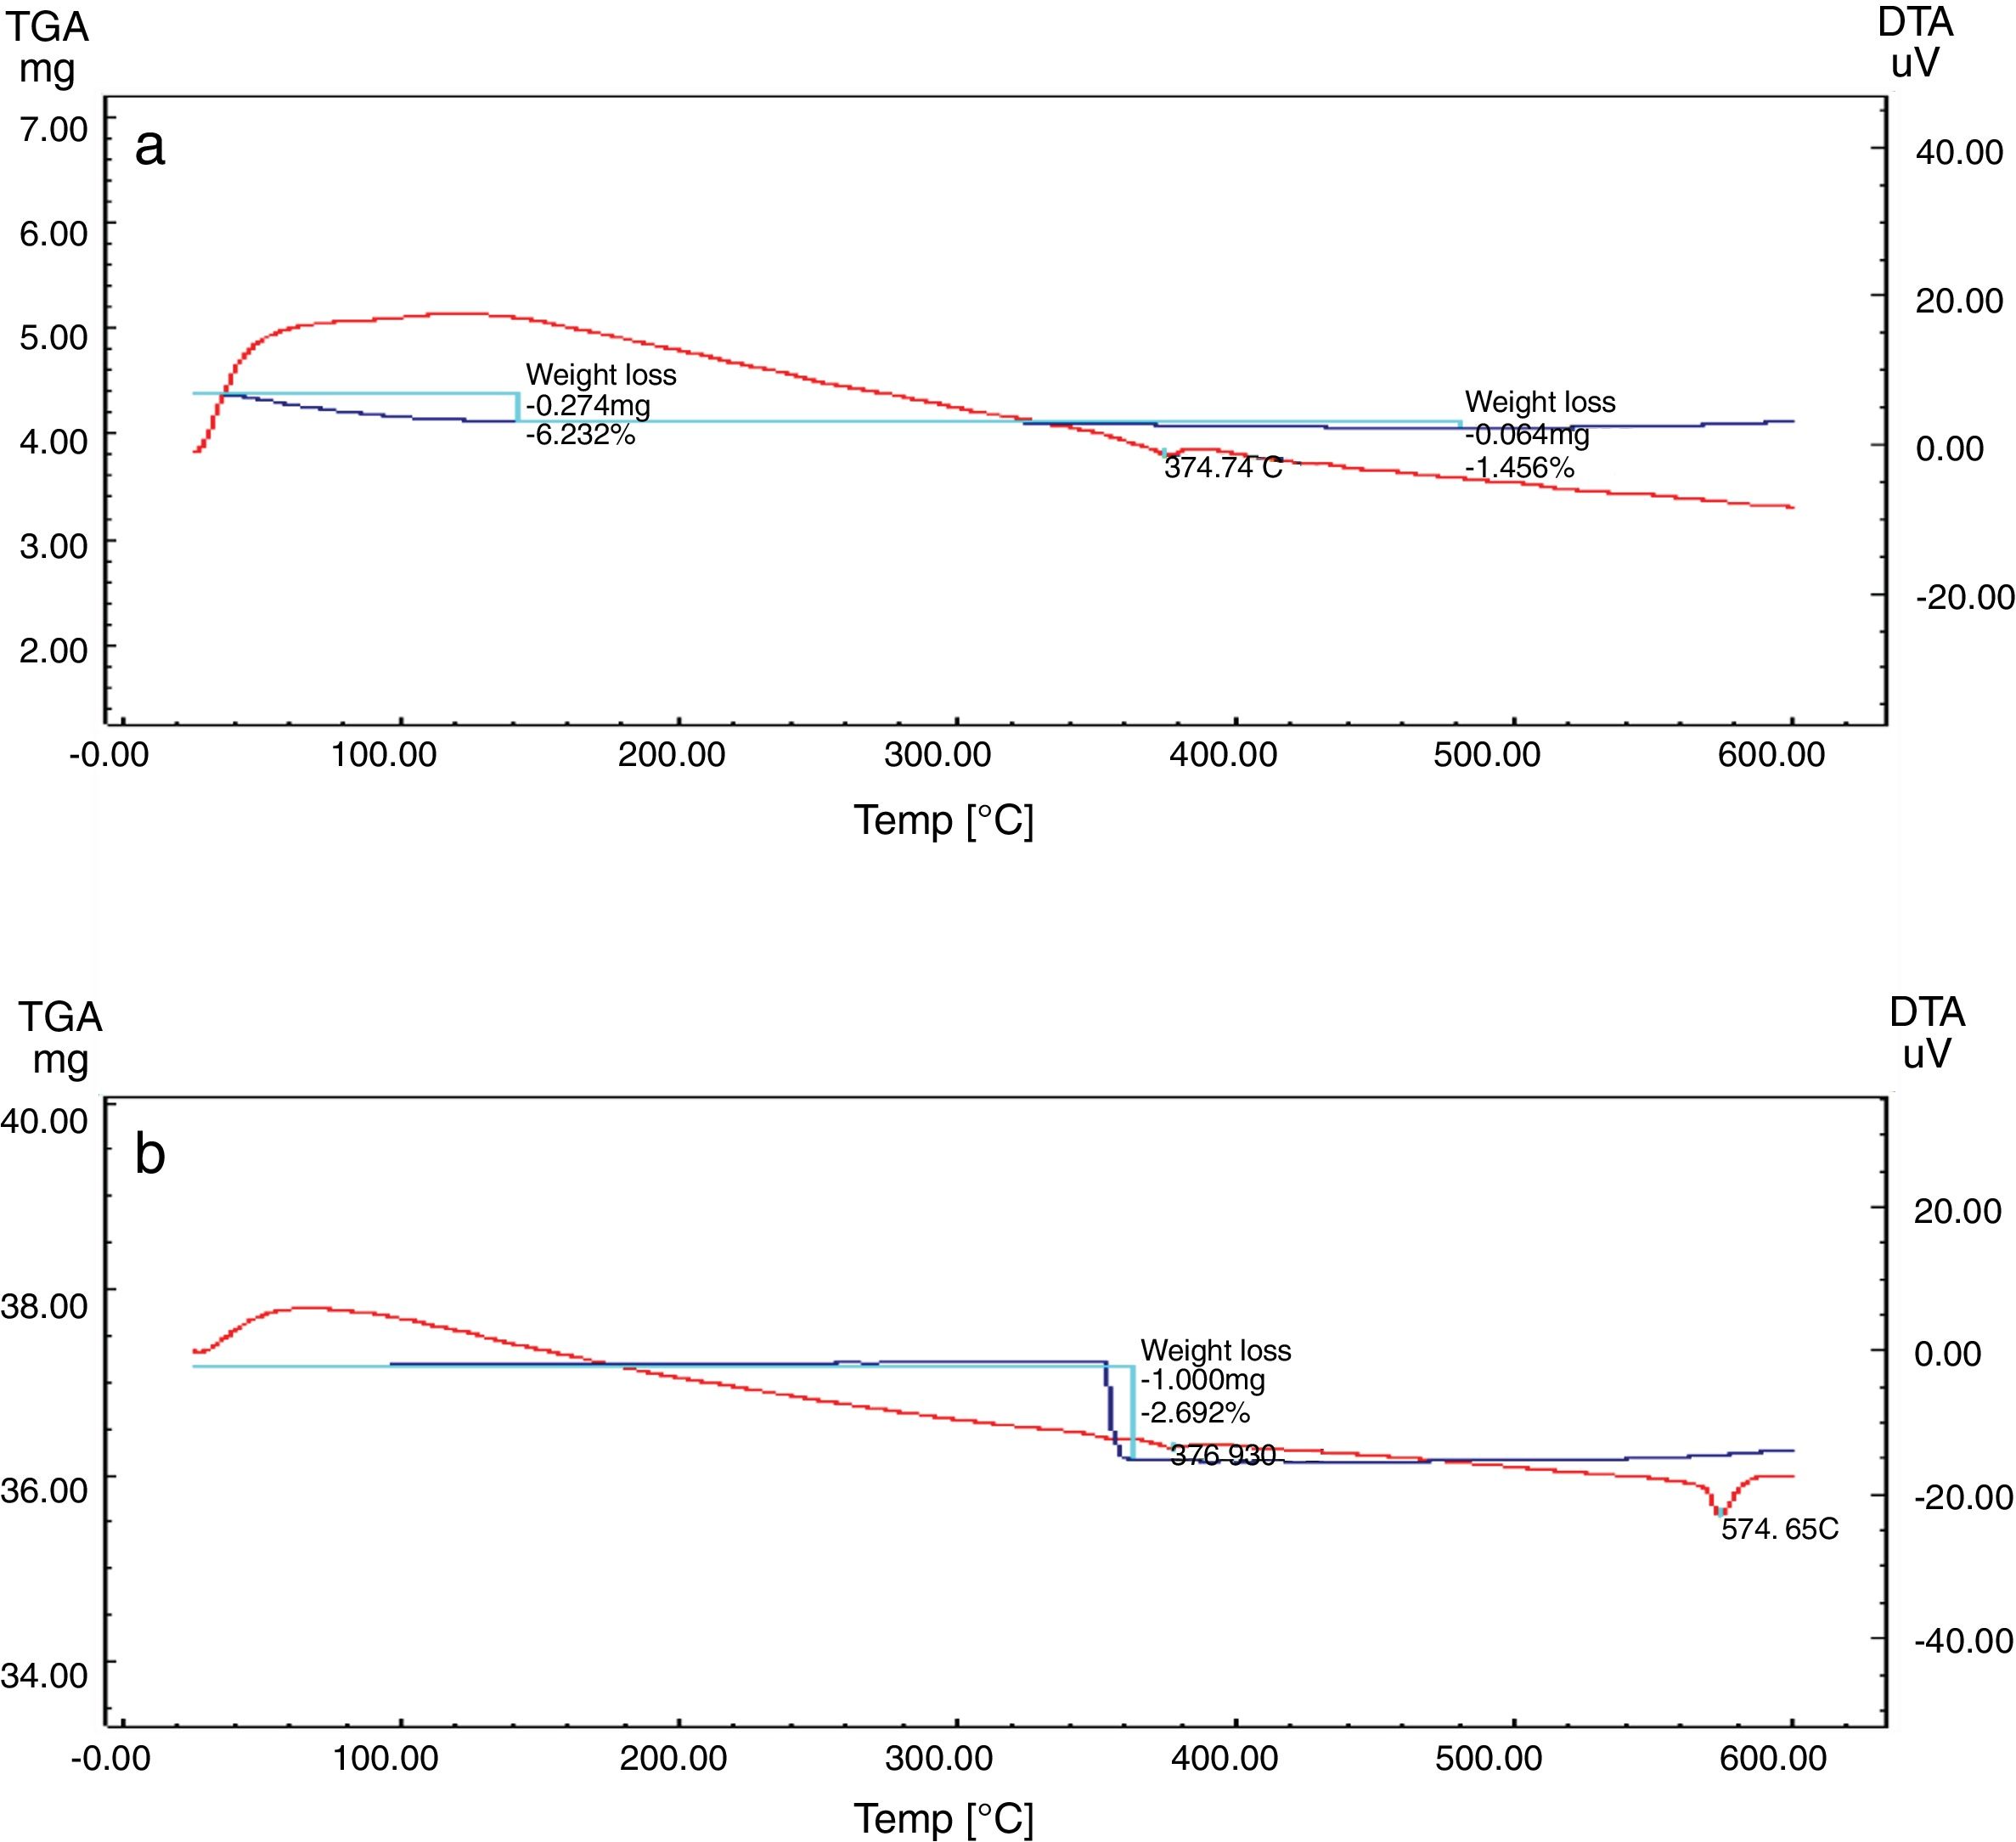
Nanosilica particles and silica sand were subjected to a 20–600°C range of temperature to estimate their performance. The weight loss of the sample was registered as a function of temperature in Fig. 7a and b. The observable weight loss for NS (Fig. 7a) is about 6.23% between 80 and 150°C may be due to the removal of the moisture and bounded water molecules in the pores of NS. It is also expected that, the high porosity of NS exhibiting a small weight loss at high temperature. Therefore, the silica nanoparticles needed more heating time to liberate water molecules from the nanosilica sample [32]. Losses of mass of the sample slowly decrease with temperature increases. In the case of silica sand (Fig. 7b), there is a suddenly loss of weight at range 350–400°C as well as there was no observed loss of weight at range 20 and 200°C, this may be attributed to the presence of some organic residue. The endothermic peaks on the DTA curve at same temperatures confirm this fact, it is clear that there is another endothermic peak located at 574.65°C in silica sand (Fig. 7b). At this temperature the silica sand undergoes a process of transformation from alpha phase to beta phase [36,37], whereas in the case of NS (Fig. 7a), this peak did not announce its presence strongly. This result supporting the fact that nanosilica powder has a good thermal stability.
Characterization of the mixtures of engobes of (a) nanosilica and (b) silica sand.")
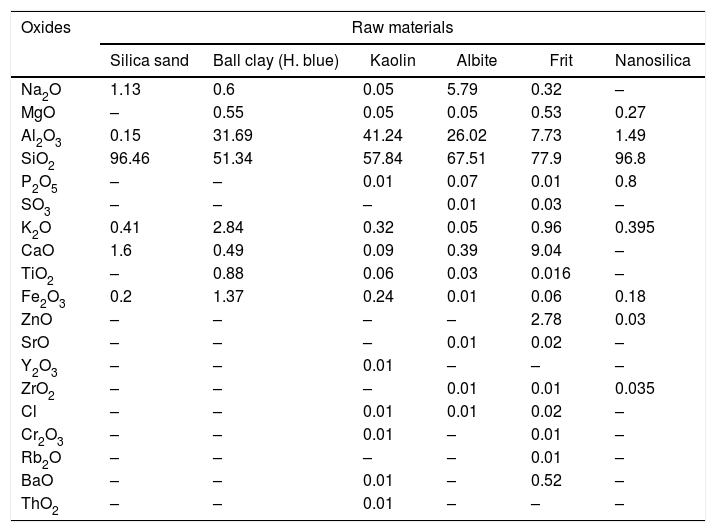
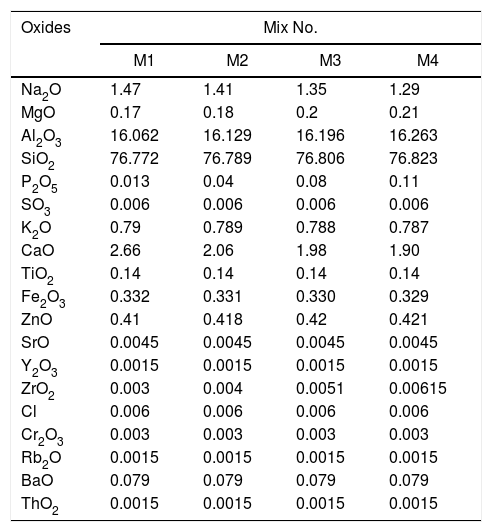
Engobe recipes are tabulated in Table 1 with constant clayed materials and fluxing agent and partially substitution of commercial sand with nanosilica. Tables 3 and 4 show the chemical composition of raw materials as well as engobe mixes characterized by XRF technique, respectively. The chemical analysis of mixes reveals presence of silica and alumina with greatest ratio 76 and 16% which utilized white and opaque appearance of engobe. The residual oxides are alkaline and earth alkaline oxides with 8% that enhances softening and engobe partially fusibility.
Chemical composition of raw materials, wt.%.
| Oxides | Raw materials | |||||
|---|---|---|---|---|---|---|
| Silica sand | Ball clay (H. blue) | Kaolin | Albite | Frit | Nanosilica | |
| Na2O | 1.13 | 0.6 | 0.05 | 5.79 | 0.32 | – |
| MgO | – | 0.55 | 0.05 | 0.05 | 0.53 | 0.27 |
| Al2O3 | 0.15 | 31.69 | 41.24 | 26.02 | 7.73 | 1.49 |
| SiO2 | 96.46 | 51.34 | 57.84 | 67.51 | 77.9 | 96.8 |
| P2O5 | – | – | 0.01 | 0.07 | 0.01 | 0.8 |
| SO3 | – | – | – | 0.01 | 0.03 | – |
| K2O | 0.41 | 2.84 | 0.32 | 0.05 | 0.96 | 0.395 |
| CaO | 1.6 | 0.49 | 0.09 | 0.39 | 9.04 | – |
| TiO2 | – | 0.88 | 0.06 | 0.03 | 0.016 | – |
| Fe2O3 | 0.2 | 1.37 | 0.24 | 0.01 | 0.06 | 0.18 |
| ZnO | – | – | – | – | 2.78 | 0.03 |
| SrO | – | – | – | 0.01 | 0.02 | – |
| Y2O3 | – | – | 0.01 | – | – | – |
| ZrO2 | – | – | – | 0.01 | 0.01 | 0.035 |
| Cl | – | – | 0.01 | 0.01 | 0.02 | – |
| Cr2O3 | – | – | 0.01 | – | 0.01 | – |
| Rb2O | – | – | – | – | 0.01 | – |
| BaO | – | – | 0.01 | – | 0.52 | – |
| ThO2 | – | – | 0.01 | – | – | – |
Chemical composition of the engobes mixtures, wt.%.
| Oxides | Mix No. | |||
|---|---|---|---|---|
| M1 | M2 | M3 | M4 | |
| Na2O | 1.47 | 1.41 | 1.35 | 1.29 |
| MgO | 0.17 | 0.18 | 0.2 | 0.21 |
| Al2O3 | 16.062 | 16.129 | 16.196 | 16.263 |
| SiO2 | 76.772 | 76.789 | 76.806 | 76.823 |
| P2O5 | 0.013 | 0.04 | 0.08 | 0.11 |
| SO3 | 0.006 | 0.006 | 0.006 | 0.006 |
| K2O | 0.79 | 0.789 | 0.788 | 0.787 |
| CaO | 2.66 | 2.06 | 1.98 | 1.90 |
| TiO2 | 0.14 | 0.14 | 0.14 | 0.14 |
| Fe2O3 | 0.332 | 0.331 | 0.330 | 0.329 |
| ZnO | 0.41 | 0.418 | 0.42 | 0.421 |
| SrO | 0.0045 | 0.0045 | 0.0045 | 0.0045 |
| Y2O3 | 0.0015 | 0.0015 | 0.0015 | 0.0015 |
| ZrO2 | 0.003 | 0.004 | 0.0051 | 0.00615 |
| Cl | 0.006 | 0.006 | 0.006 | 0.006 |
| Cr2O3 | 0.003 | 0.003 | 0.003 | 0.003 |
| Rb2O | 0.0015 | 0.0015 | 0.0015 | 0.0015 |
| BaO | 0.079 | 0.079 | 0.079 | 0.079 |
| ThO2 | 0.0015 | 0.0015 | 0.0015 | 0.0015 |
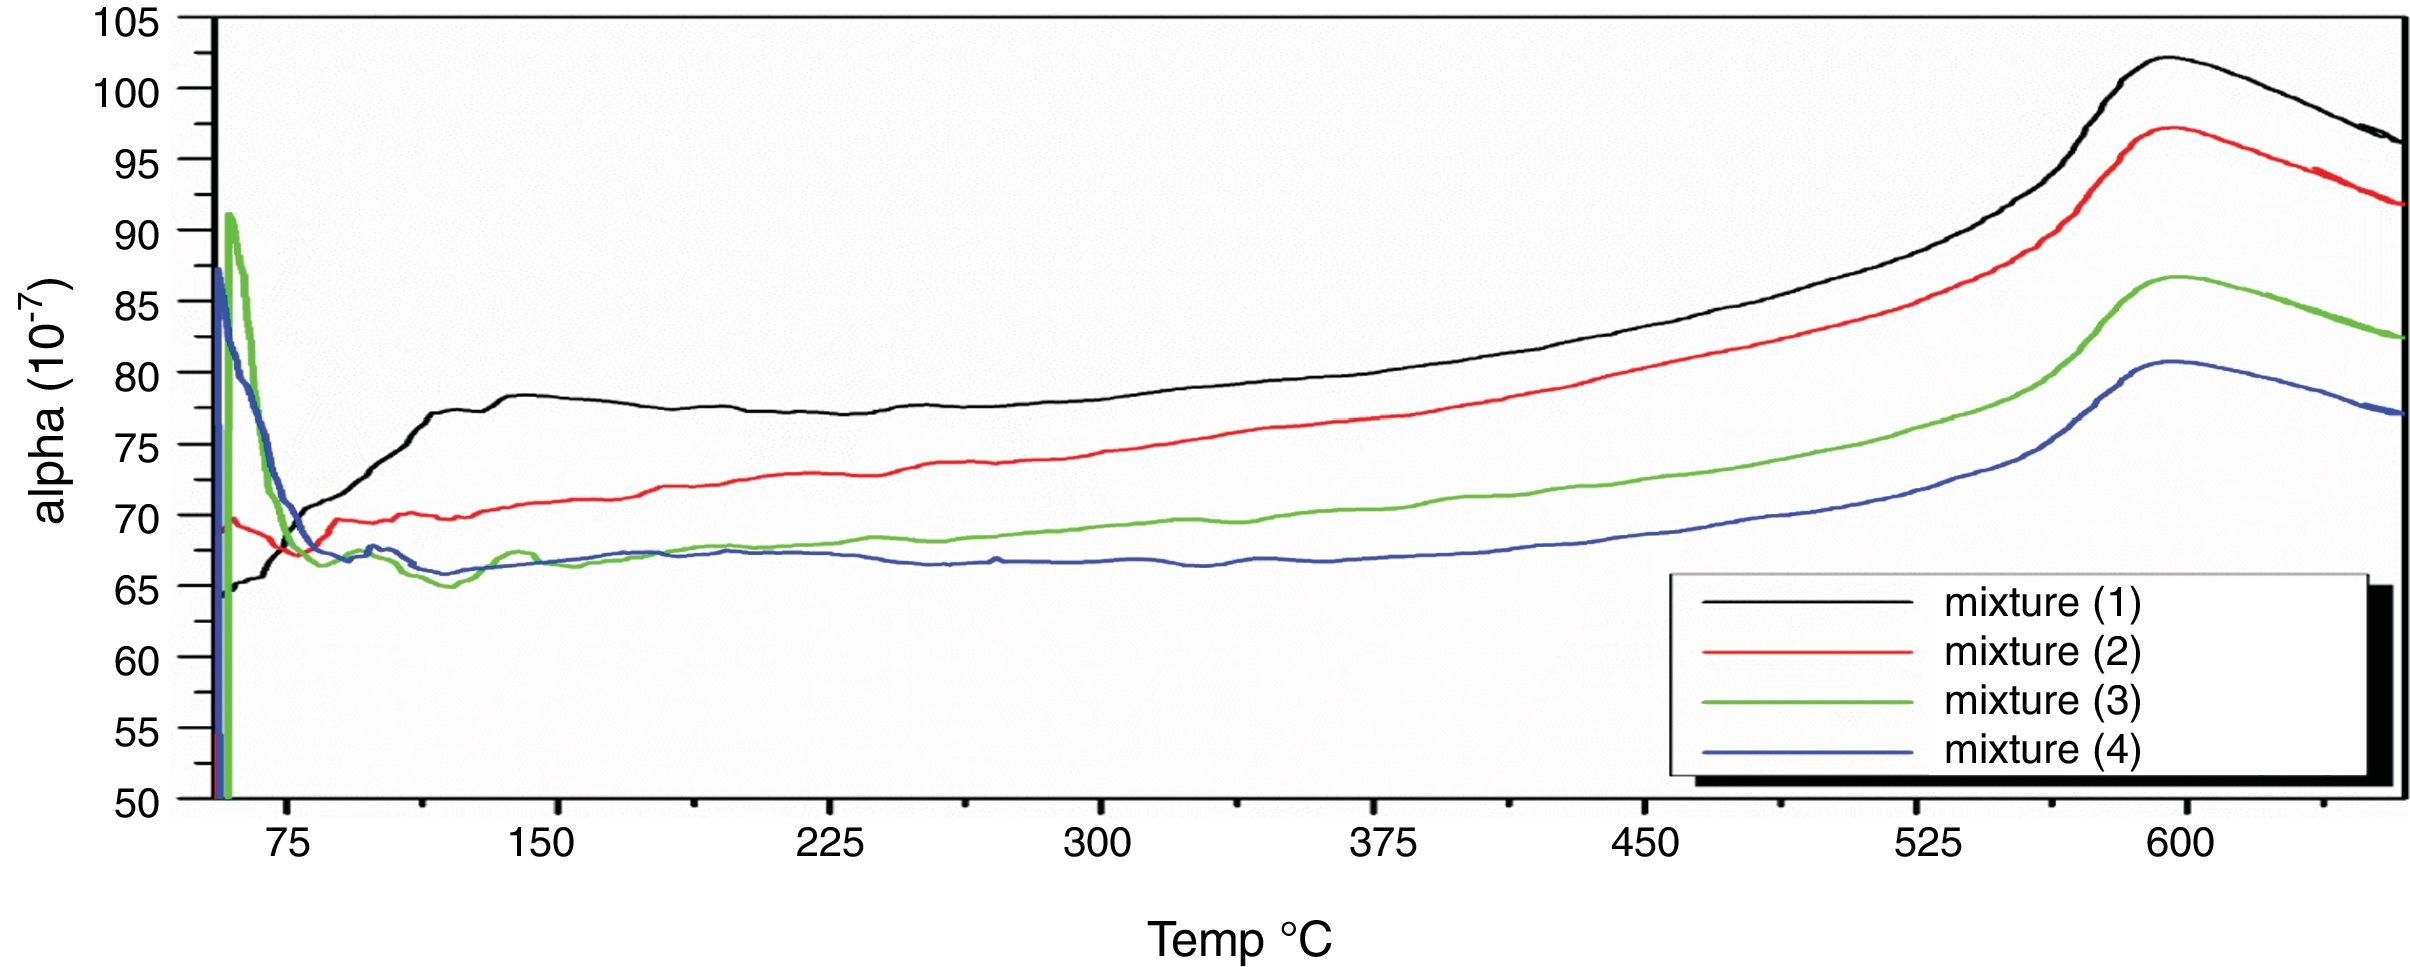
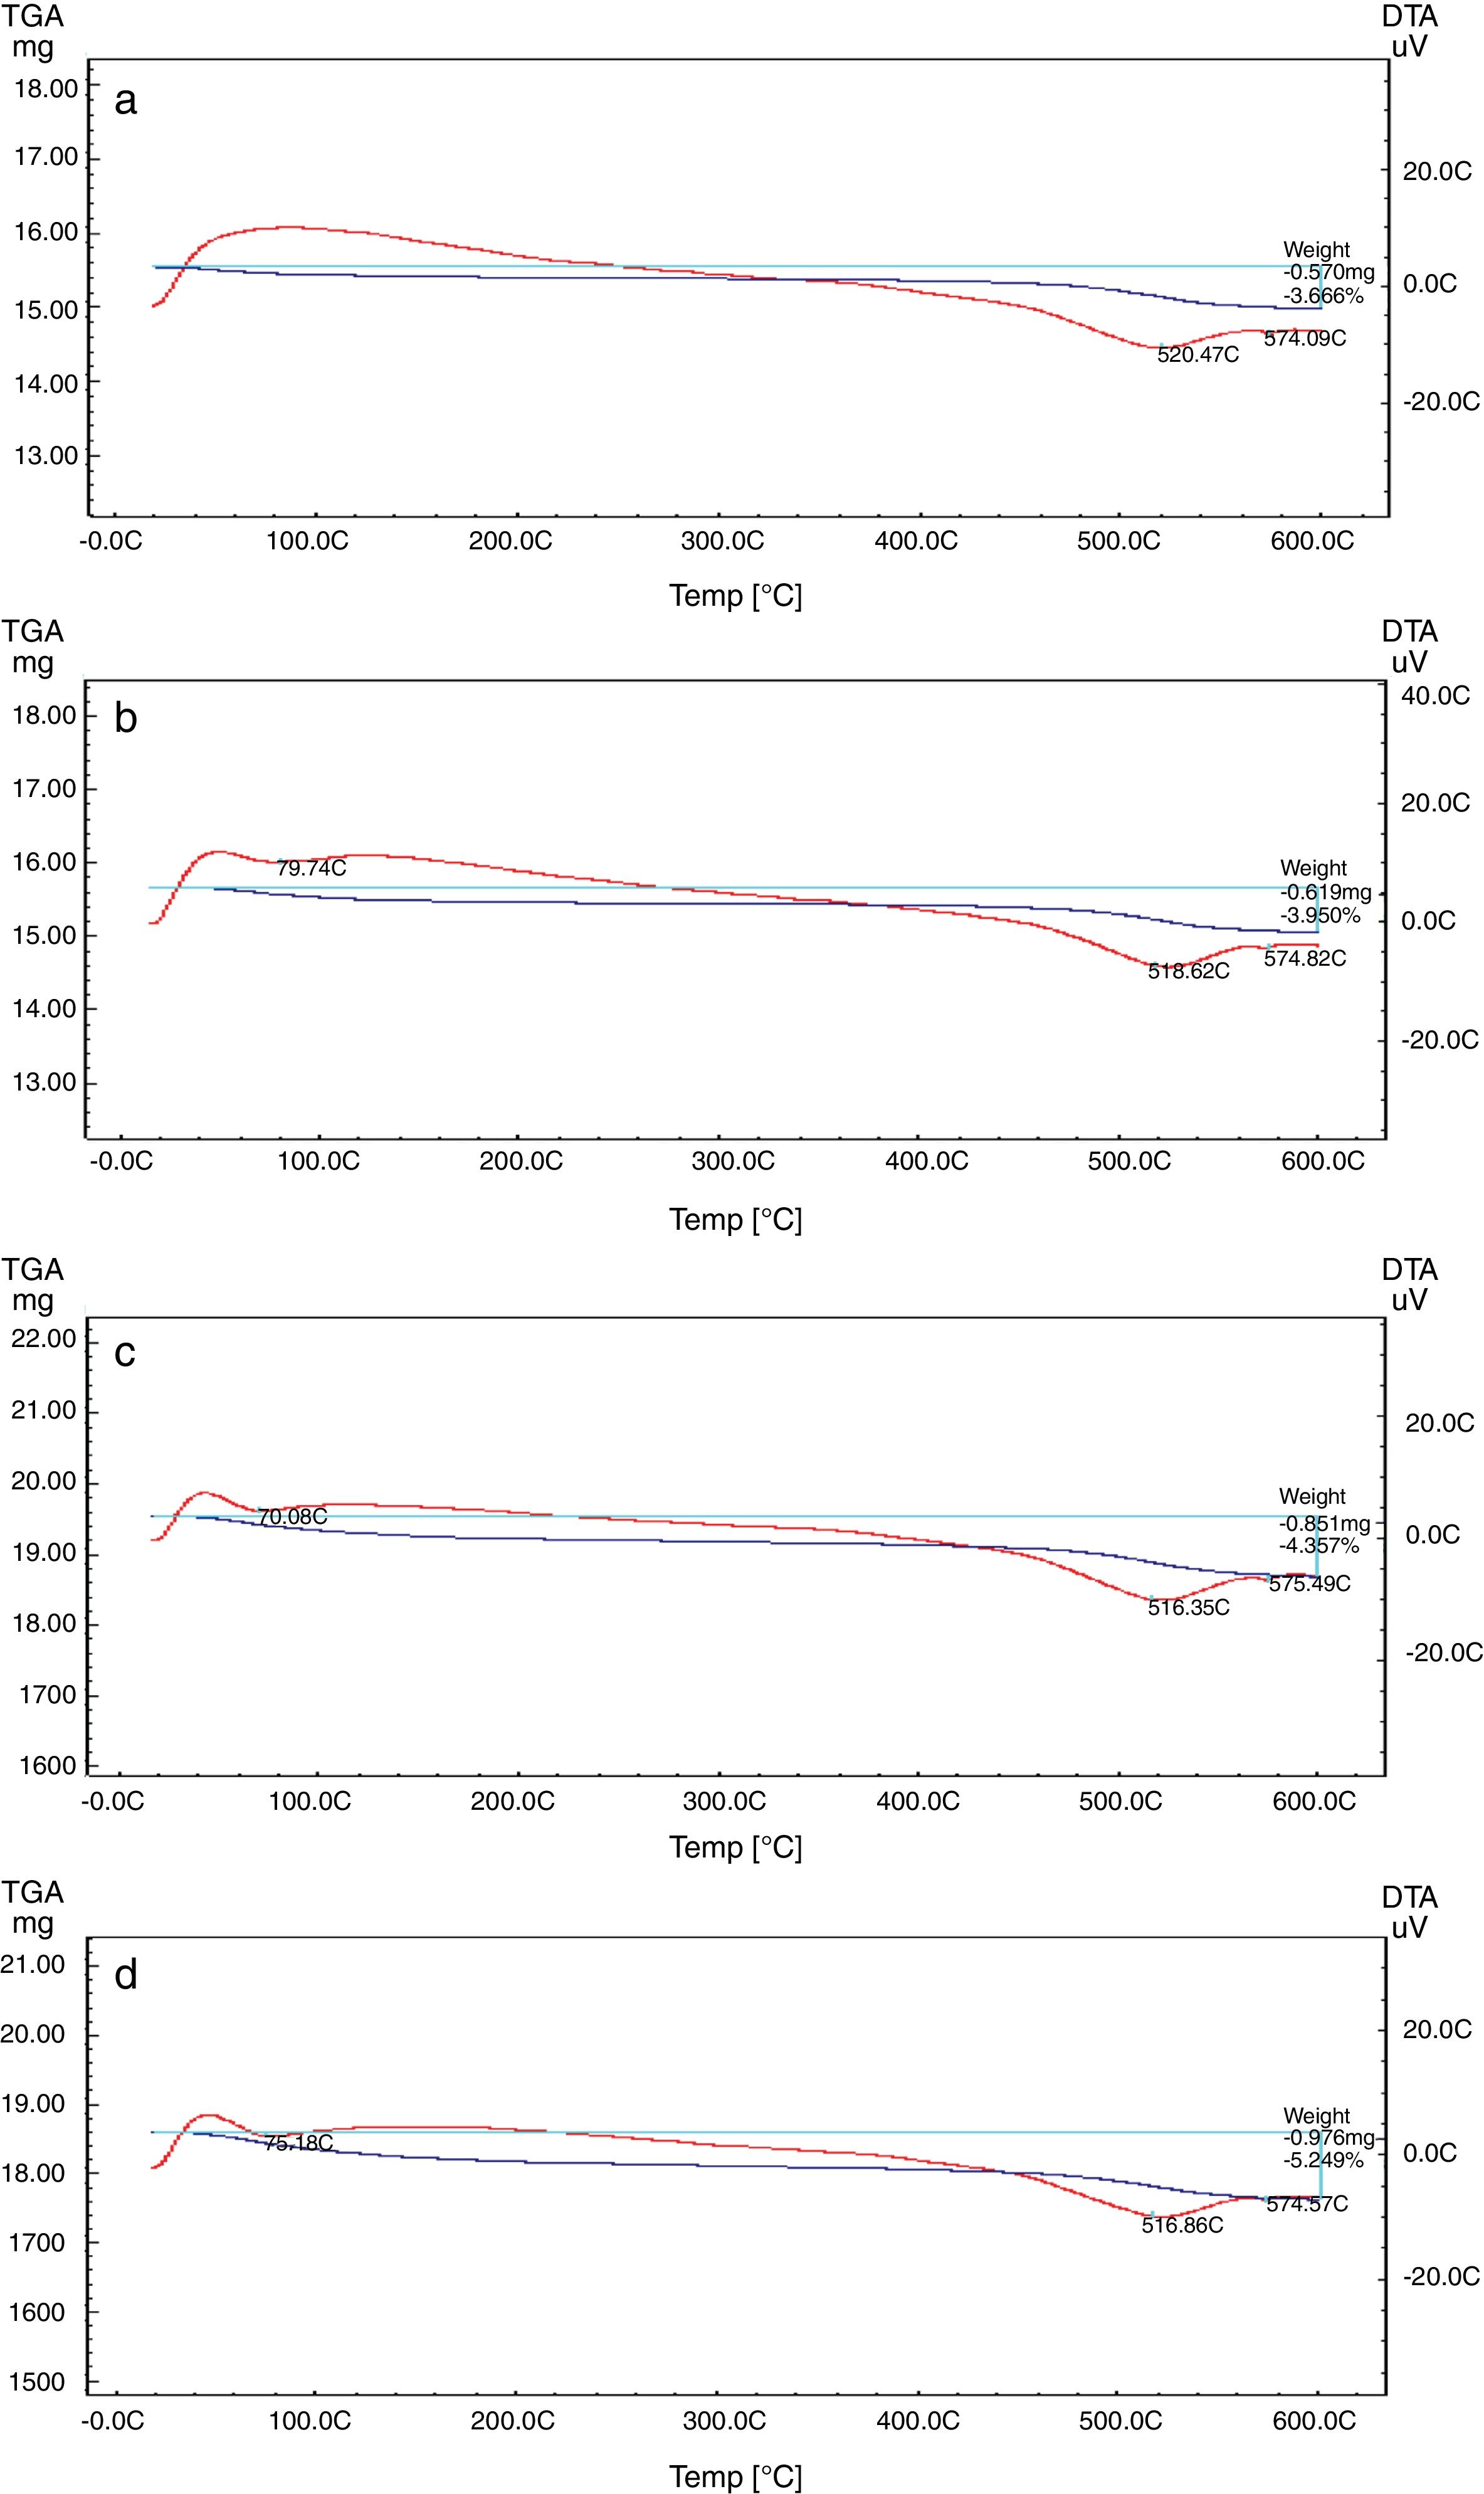
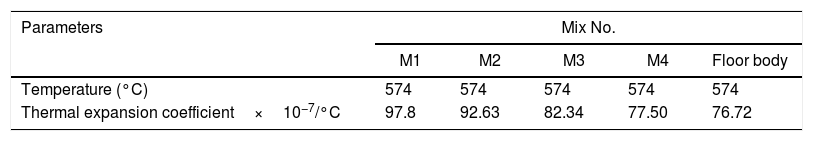
Fig. 8 depicts thermal expansion coefficient (α) and thermal expansion curves of different mixes (M1, M2, M3 and M4). In Table 5, the thermal expansion coefficients of ceramic body as well as engobe samples measured between 20 and 574°C are summarized. The temperature of 574°C is selected from the thermal expansion curves of the engobes, at which, quartz undergoes a phase transition from the lower temperature α-phase to the higher temperature β-phase. This phase change is accompanied by a variation in volume, symmetry and shape, where the α-phase has lower symmetry as well as volume than the β-phase [36] and the rate of expansion begins to increase rapidly. From Table 5, it is evident that M1 without NS content shows generally higher thermal expansions coefficient than the other mixes from M2 to M4. Presence of silica in nanosize enhances increase of amorphous, vitreous phase with constant physical property “shape and size” with changing temperature leading to low thermal expansion as shown in M4. On the other hand, presence of commercial silica sand enhanced presence of different crystalline phases of quartz, cristobalite or tridymite that affected with temperature leading to phase transition as well as increase of thermal expansion as shown in M1.

The TEC value shifting to the lower value when the amount of silica sand was replaced with the same amount of NS which has high purity, amorphous in nature and its particles size is smaller than silica sand, NS affecting on the viscosity, when particle size decreased, the viscosity increased because the specific surface of the powder increases in fine particle [38]. The TEC values of M4 with (15wt.%) NS and the floor tile were 77.50×10⁻⁷/°C and 76.72×10⁻⁷/°C, respectively, these TEC values were almost equal with the TEC of the roof tile suggesting a good match between the body and the top engobe layer [26,39,40]. This result was supported by thermo gravimetric (TGA) and differential thermal analyses (DTA) (Fig. 9a–d), in which there is an endothermic peaks located at ∼574–580°C due to the transformation of alpha-beta quartz [36,37]. It is also evident that the endothermic peaks become weaker with increasing the percentage of NS. The characteristic endothermic peaks for the engobes at 80–120°C are due to the loss of free water in M2, M3 and M4, this endothermic peak not found in M1 (0wt.%) and the weight losses are in sample M2, M3 and M4 are increased with replacement of silica sand with NS, this may be attributed to the ability of NS to keep water for long time and at high temperature.
 curves of (a) M1, (b) M2, (c) M3 and (d) M4.")
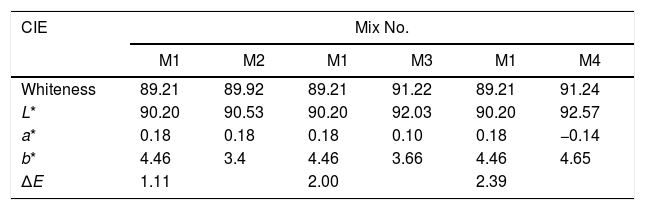
The whiteness of the fired engobe mixtures were investigated in terms of color (tonality) can be obtained from the following Eq. (7)[26].
where L* indicates the lightness coordinate of the object, with value from 0 (absolute black) to 100 (absolute white), the coordinate a* is (+ve) the object color tends to red and when this coordinate is (−ve) the object color tends to green. The coordinate b* indicates the direction to yellow (+b*) or blue (−b*) [41,42], as in Table 6 in which the whiteness increase with increasing the amount of replaced NS, whereas, the value of (a*) transform from (+) brown to (−) greenish with increasing the percentage of nanosilica and decreasing the percentage of Fe2O3 (Table 4). The value of b* decreased with increasing the amount of NS until the mix M4 with 15wt.%, NS in which the b* increased again. M4 was smoothing in surface than M3, M2 as well as M1, respectively. ΔE calculated as a color difference (the space between two colorful points).
The magnitude of (ΔE) can be obtained by the following Eq. (8)[40]

From ΔE value it is evidence that when the amount of nanoparticles silica increased the value of ΔE increases.
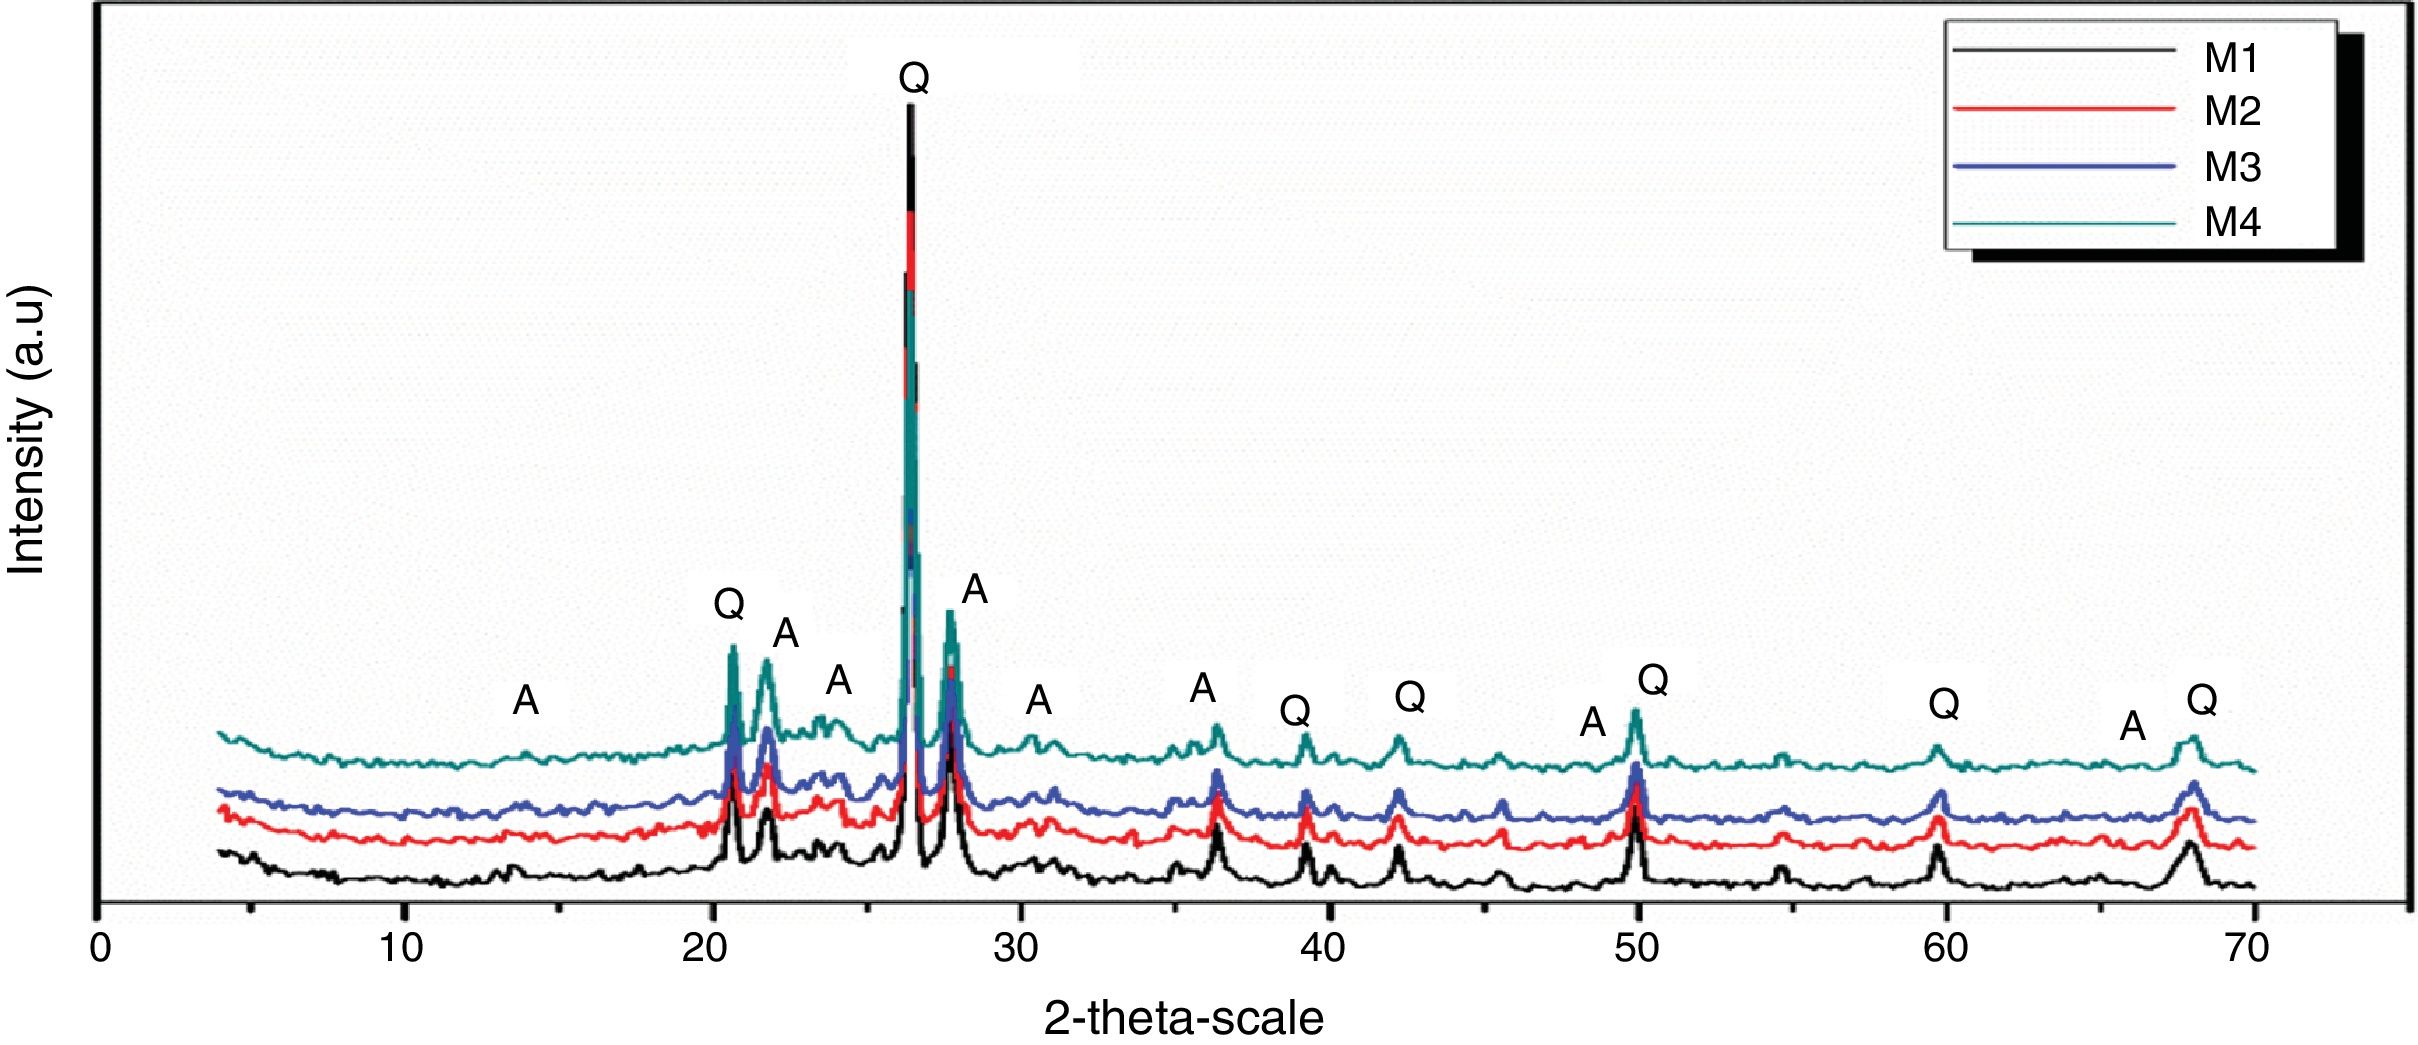
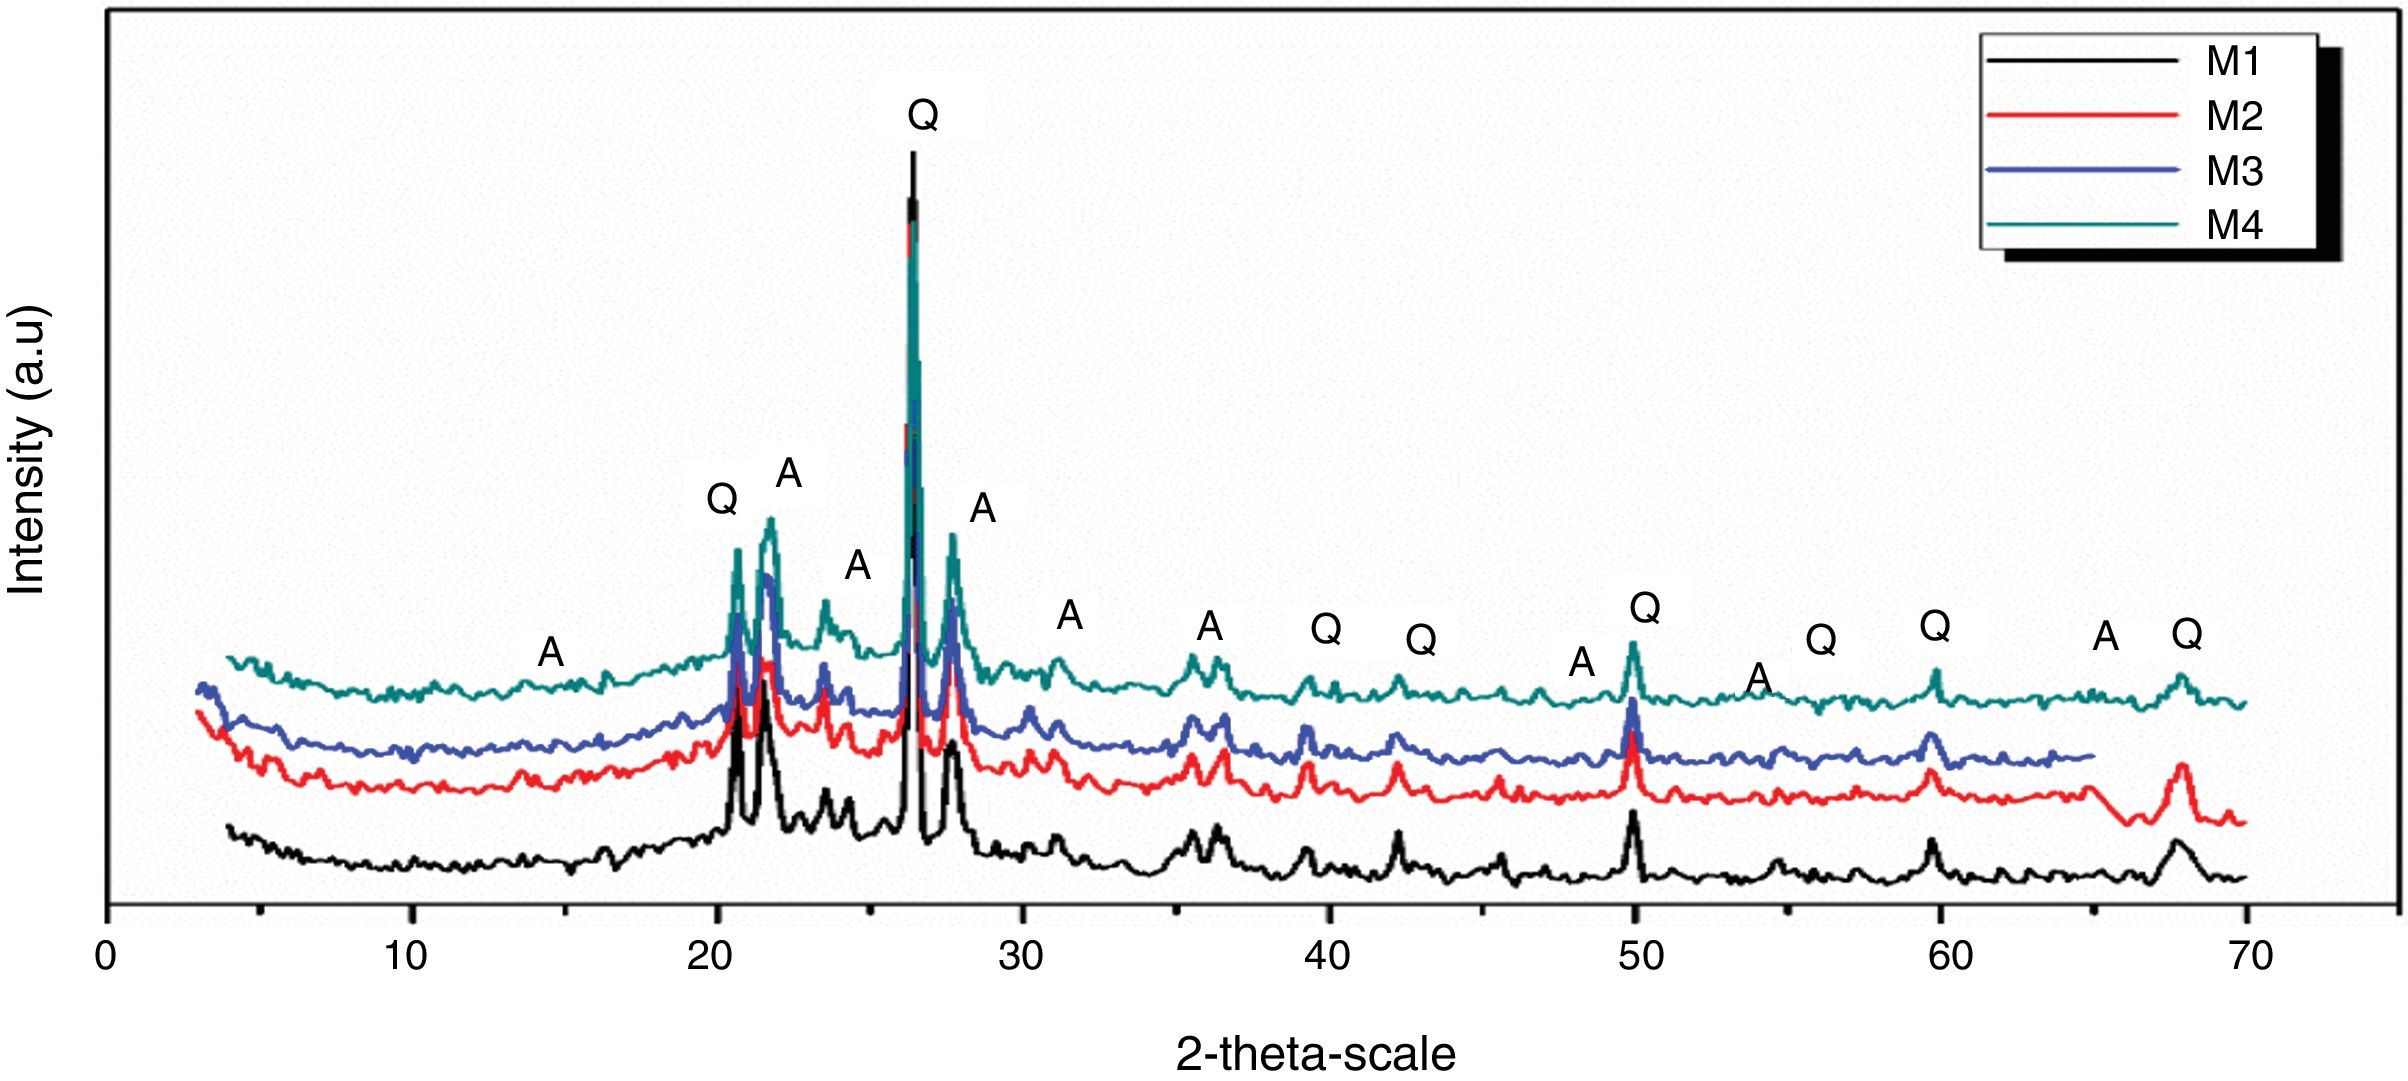
Figs. 10 and 11 show the XRD spectrum of the four mixes of engobes (M1, M2, M3 and M4) after firing at 1200 and 1225°C for 1h. These samples were characterized by the presence of quartz (SiO2) and albite (NaAlSi3O8) as the major phases by using the XRD card number 05-0490 and 01-0739 respectively. Quartz was supposed to originate from non-reacted raw materials, the intensity of the quartz phase decrease with increasing the firing temperature for the same sample and with increasing the amount of the replaced silica sand by the same percentage of nanosilica in the same sintering temperature (i.e. the intensity of quartz in M1>M2>M3>M4) this may be attributed to the small particle size of NS which dissolved in the feldspar rich melt and motivates the formation of albite type crystals which lead to increase in the viscosity value, linear shrinkage and decrease in the water absorption values.


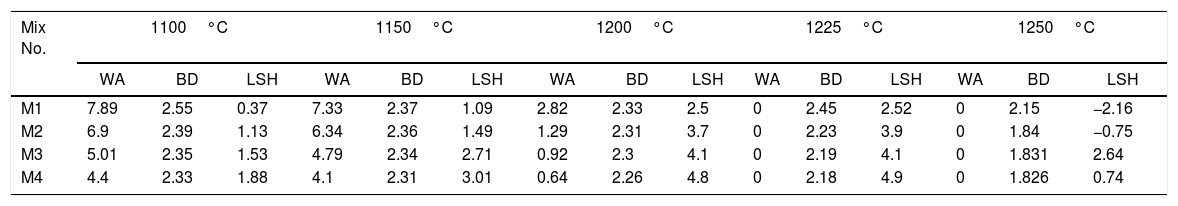
Table 7 illustrates physical properties of fired engobe at different temperatures 1100–1250°C in response to water absorption, bulk density and linear firing shrinkage. Linear firing shrinkage and bulk density increase with temperature and nanosilica. While, the water absorption decreases with increase of nanosilica addition and firing temperature till maturation then reverse values of all physical properties. This is attributed to viscosity of melt which related to nanosize of silica, alkaline oxides content and firing temperature. The fineness, high temperature and alkaline oxides decrease the melt viscosity; increase the melt fluidity leading to less porosity and higher shrinkage.
Water absorption % (WA), linear shrinkage % (LSH) and bulk density (BD) (g/cm3) of different mixes at different fired temperatures in laboratory kiln for 1h.
| Mix No. | 1100°C | 1150°C | 1200°C | 1225°C | 1250°C | ||||||||||
|---|---|---|---|---|---|---|---|---|---|---|---|---|---|---|---|
| WA | BD | LSH | WA | BD | LSH | WA | BD | LSH | WA | BD | LSH | WA | BD | LSH | |
| M1 | 7.89 | 2.55 | 0.37 | 7.33 | 2.37 | 1.09 | 2.82 | 2.33 | 2.5 | 0 | 2.45 | 2.52 | 0 | 2.15 | −2.16 |
| M2 | 6.9 | 2.39 | 1.13 | 6.34 | 2.36 | 1.49 | 1.29 | 2.31 | 3.7 | 0 | 2.23 | 3.9 | 0 | 1.84 | −0.75 |
| M3 | 5.01 | 2.35 | 1.53 | 4.79 | 2.34 | 2.71 | 0.92 | 2.3 | 4.1 | 0 | 2.19 | 4.1 | 0 | 1.831 | 2.64 |
| M4 | 4.4 | 2.33 | 1.88 | 4.1 | 2.31 | 3.01 | 0.64 | 2.26 | 4.8 | 0 | 2.18 | 4.9 | 0 | 1.826 | 0.74 |
It can be noted also that the increasing in sintering temperature above 1225°C, distortion (abnormal shape) of the engobes mixtures takes placed for all engobes mixes, except in mixes M3 and M4 with high NS contents, the deformation effect is lower than in M1 and M2 which have little amount of NS. The value of bulk density (BD) decreased with increasing the amount of nanosilica. The low density of the nanosilica may be attributed to its content of silanol groups on the surface, its amorphous and porous in nature. The increasing of albite phase at a high rate in M4 at 1225°C causes the weakness of the observed bending strength as shown in Table 8.
ConclusionsWall and floor ceramics, one of the largest commodities consumed by humanity, it has enormous potential, but not completely explored. Better understanding and precise engineering of an extremely complex structure of ceramics-based materials at the nanolevel will result in a new generation of ceramics that is stronger and more durable, with whiteness in color, desired thermal expansion coefficient, very low water absorption and low bulk density at low temperatures. Nanoparticles, such as silicon dioxide, were found to be a very effective additive to traditional ceramics, it can be prepared from very low cost raw materials such as sodium silicate solution (SSS) using a power saver (low temperature and electricity) and simple method (sol–gel method). As it is clear, it is a friendly way of the environment, since there is no carbon dioxide emission because there is no burning process. It is therefore possible to say that this method is a commercial way of manufacturing nanosilica. Because of the high purity of the produced SiO2 and the low temperatures required which makes it the cheapest way. Nano-ceramics with nanosized ceramics components or other nanosized particles are the next ground breaking development.
