


In the present work, samples of barium borate glasses containing different molar ratios of ZnO were prepared using the conventional melt-quenching technique. X-ray diffraction studies confirmed the amorphous nature of the studied materials. Structural analysis using FT-Infrared confirmed the incorporation of the Zn atom in the glass matrix as a ZnO4 unit and the existence of ZnO in the tetrahedral interstitial sites. TEM images for the studied materials show that the average particle size is about 20nm and the ZnO4 structural units reside in the glass matrix with high homogeneity. Density and molar volume studies manifested an increase in the density as the amount of ZnO increases and a subsequent decrease in the molar volume. UV absorption studies showed a blue shift in the absorption peak from 343nm to 315nm. Additionally, an observed reversible behavior around 338nm divides the absorption range into high energy and low energy regions. In the high energy region, both absorbance, absorption coefficient, and refractive index increased with ZnO content increment. In the low energy region, this behavior was reversed, and the calculated values of the refractive index agreed with the measured ones in this region. Studies of optical dielectric parameters showed a Debye-type relaxation process in which increasing the ZnO content shortens the sample relaxation time. Our results, collectively, suggest the studied materials for several optoelectronic device applications such as high-energy optical filters, optical switches, and frequency converters.
En el presente trabajo se prepararon muestras de vidrios de óxido de borato de bario que contienen diferentes proporciones molares de ZnO, utilizando la técnica convencional de melt-quenching. Los estudios de difracción de rayos X confirmaron la naturaleza amorfa de los materiales estudiados. El análisis estructural utilizando FT-Infrared confirmó la incorporación del átomo de Zn en la matriz del vidrio como una unidad de ZnO4 y la existencia de ZnO en los sitios intersticiales tetraédricos. Las imágenes TEM de los materiales estudiados muestran que el tamaño promedio de partícula es de aproximadamente 20nm y las unidades estructurales de ZnO4 residen en la matriz de vidrio con alta homogeneidad. Los estudios de densidad y volumen molar manifestaron un aumento de la densidad con el incremento de la cantidad de ZnO y una posterior disminución del volumen molar. Los estudios de absorción de UV mostraron un corrimiento al azul en el pico de absorción de 343 a 315nm. Además, un comportamiento reversible observado alrededor de 338nm divide el rango de absorción en regiones de alta y baja energía. En la región de alta energía, tanto la absorbancia como el coeficiente de absorción y el índice de refracción aumentaron con el incremento del contenido de ZnO. En la región de baja energía, este comportamiento se revirtió, y los valores calculados del índice de refracción coincidieron con los datos experimentales en esta región. Los estudios de parámetros dieléctricos mostraron un proceso de relajación tipo Debye en el que el aumento del contenido de ZnO acorta el tiempo de relajación de la muestra. Nuestros resultados, en conjunto, recomiendan los materiales estudiados para varias aplicaciones de dispositivos optoelectrónicos, como filtros ópticos de alta energía, interruptores ópticos y convertidores de frecuencia.

Due to their technological applications and optoelectronic properties, barium borate oxide glasses are of the most interesting materials. Boric oxide B2O3 is one of the most popular and excellent glass formers, which is well-known to form glass at the lower melting point with good transparency, high chemical durability, and thermal stability [1–3]. Improved structure–property relationship suggests borate-based glasses for wide optical and optoelectronic applications [4–6]. Barium oxide can react with boron oxide, in borate-based glasses, in a dual nature as a network former and a network modifier. Barium borate glasses can be an effective host for other metal oxides, such as ZnO, TiO2 for radiation protection and improved optoelectronic applications [7,8]. Studies on different compositions of borate-based glasses doped with Al2O3 showed an interesting interaction between structural compositions and obtained properties [9]. The addition of ZnO improves the glass matrix's chemical durability, increases thermal stability, and lowers the batches’ melting temperatures during the preparation process [10]. ZnO plays the role of network former and network modifier and effectively improves the host glass system's physical properties [11,12]. On the other hand, density and molar volume are two important physical characteristics that give precise information about glassy materials’ structural peculiarities [13,14]. ZnO incorporation into borate glasses was reported to increase the glass compactness and refractive index at room temperature [15]. On the other hand, studying optical absorption behavior of oxide glasses can give precise information about their internal electronic states and the electronic transitions in terms of light absorption. In this regard, both linear and nonlinear optical parameters can give clear vision about the band gap structure and hence can suggest the studied material for suitable applications. On the other hand, dielectric parameters such as the dielectric constant ɛ′, the dielectric loss ɛ″, and the loss tangent, or dissipation factor, (tanδ) can be calculated from optical absorption data [16,17]. They can be informative data when implementing studied glasses for optoelectronic applications.
The present work aims at studying structure–property relationship of the proposed materials and interpreting the observed behaviors in terms of the structural composition. This will be performed by studying UV–Vis absorption behavior and deduce linear and nonlinear optical parameters. In addition, dielectric behavior in the same frequency region will be studied based on the data of optical absorption.
Experimental techniquesBased on the molar fraction, the following chemical formula was used to describe the ratios of the components for the proposed oxide glasses, where the ratio between B2O3 and BaO was kept fixed at 4:1, [(80−0.8x) mol.% B2O3+(20−0.2x) mol.% BaO + x mol.% ZnO], where x=0, 5, 10, 15 and 20. Each sample was coded by the first letter of their components and its number as BBZ1, BBZ2, BBZ3, BBZ4, and BBZ5 for x=0, 5, 10, 15, and 20, respectively. Molecular weight of raw materials was calculated separately; then, batches were weighted using a 4-digits balance. After this, all batches were mixed and finely ground in a porcelain mortar and transferred into platinum crucibles. Afterward, for melting purposes, an electrical furnace was adjusted to reach 980±20°C. As the furnace reached the desired temperature, all crucibles were introduced for 2h with repeated stirring to establish completely homogenous melts. All melts were quenched rapidly in the air, using two pre-cooled copper plates. X-ray diffractometer (Rigaku Miniflex, Japan, Cu Kα radiation of λ=1.5406Å) was used to characterize the prepared samples’ internal structure. XRD studies were carried out in the 2θ range from 5° to 80° with a scan rate of 2°/min. Fourier transforms infrared (FTIR) (Jasco 5300) spectrometer was used in the range from 2000 to 400cm−1 to perform the structural analysis. For that purpose, the prepared glass samples were ground, mixed well with KBr powder, and then pressed into suitably shaped pellets. Transmission electron microscopy measurements were performed using HRTEM JEOL2100, Japan. For optical absorption studies, a Jenway 6405 UV–Vis spectrophotometer was used in the range of 200–750nm. Density measurements were carried out by the fluid displacement method in xylene at room temperature using an electric balance of 10−4g sensitivity.
Results and discussionStructural and functional analysisXRD measurements were executed on powdered glass samples to confirm their non-crystalline nature. XRD diffractograms, not shown here, for all samples are nearly the same with no observed sharp peaks, confirming the short-range order structure of the studied materials.
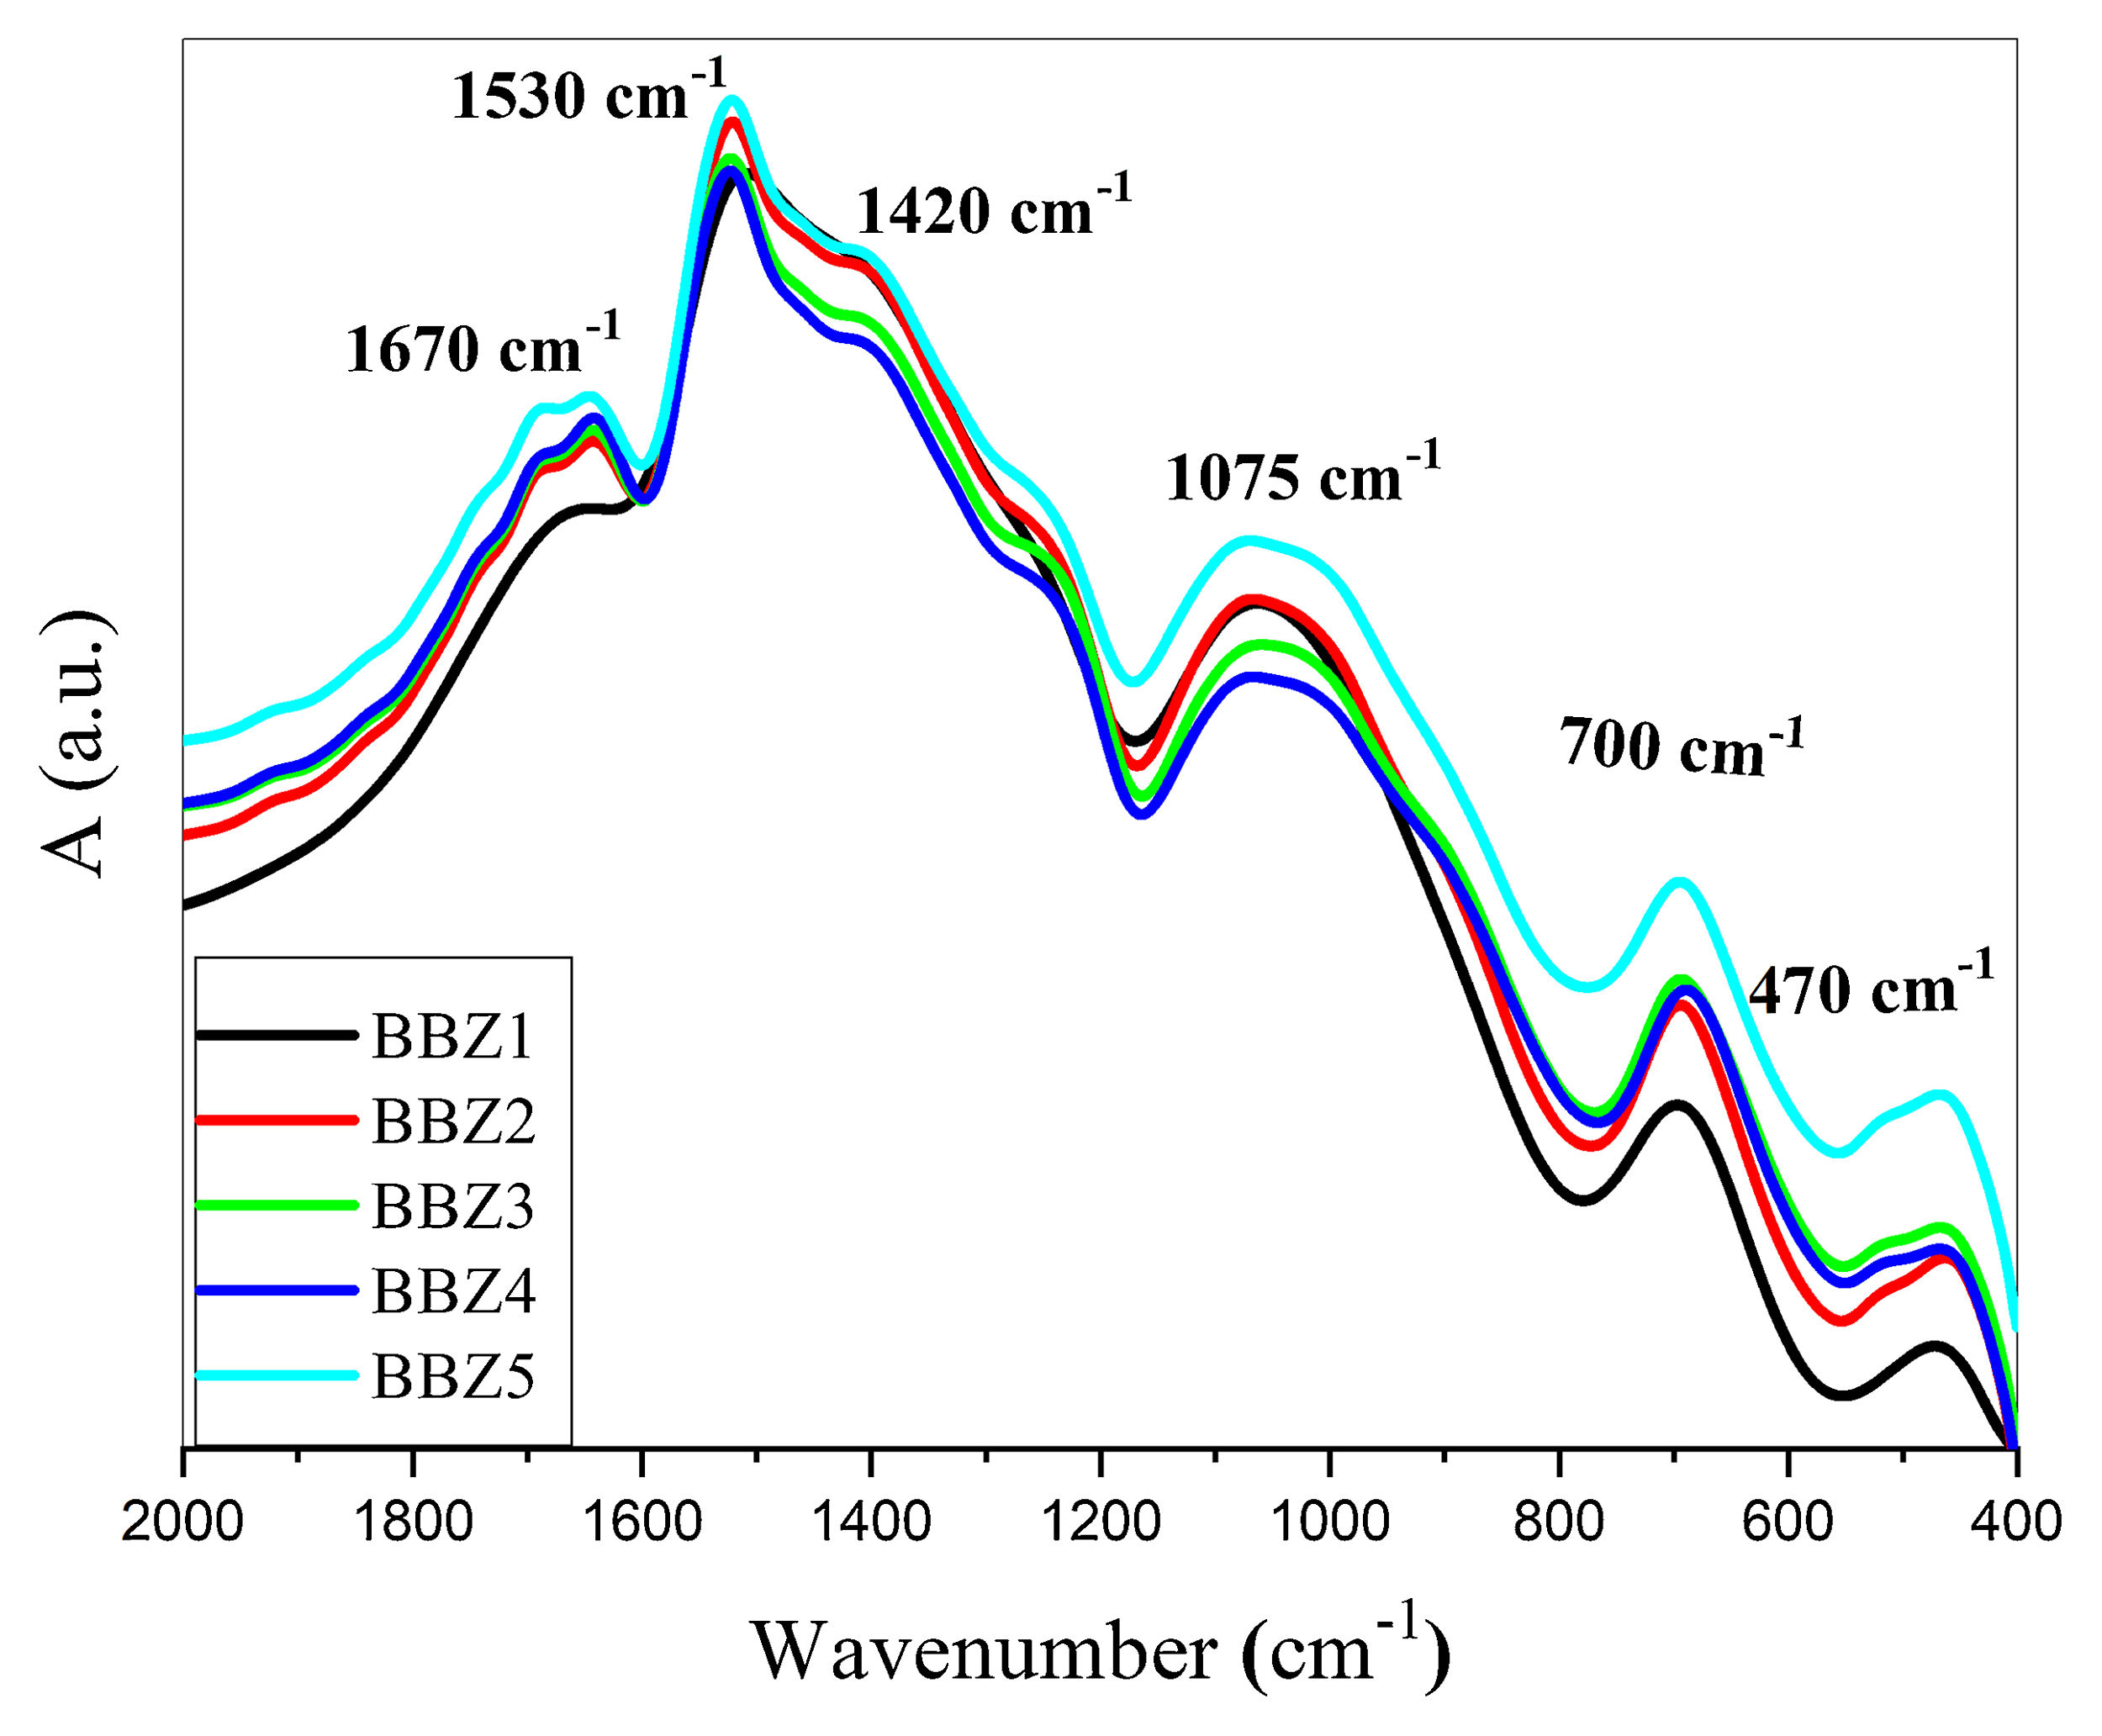
Fourier transform infrared, FTIR, absorption spectra are considered fingerprints for the building block units. It was used to determine the formative-structural units and bonds in each glass’ matrix of the studied samples, as seen in Fig. 1, which shows the FTIR charts for all studied samples in the spectral range from 2000 to 400cm−1. The observed bands can be assigned to their structural groups and their chemical bonds based on the previous studies. The band from 460–470cm−1 is attributed to the ZnO bond tetrahedral bending vibrations in the ZnO4 structural units [15,18,19]. The band centered around 700cm−1 is due to the bending modes of BOB bonds in BO3, while the broadband around 1075cm−1 may be attributed to the stretching vibrations of the BO bond in the BO4 tetrahedral units [18,20,21]. The broad bands around 1420, 1530, and 1670cm−1 may be attributed to the BO symmetric stretching vibration of BO3 units [18,22,23]. These results confirm the incorporation of the Zn atom in the glass matrix as a ZnO4 unit.

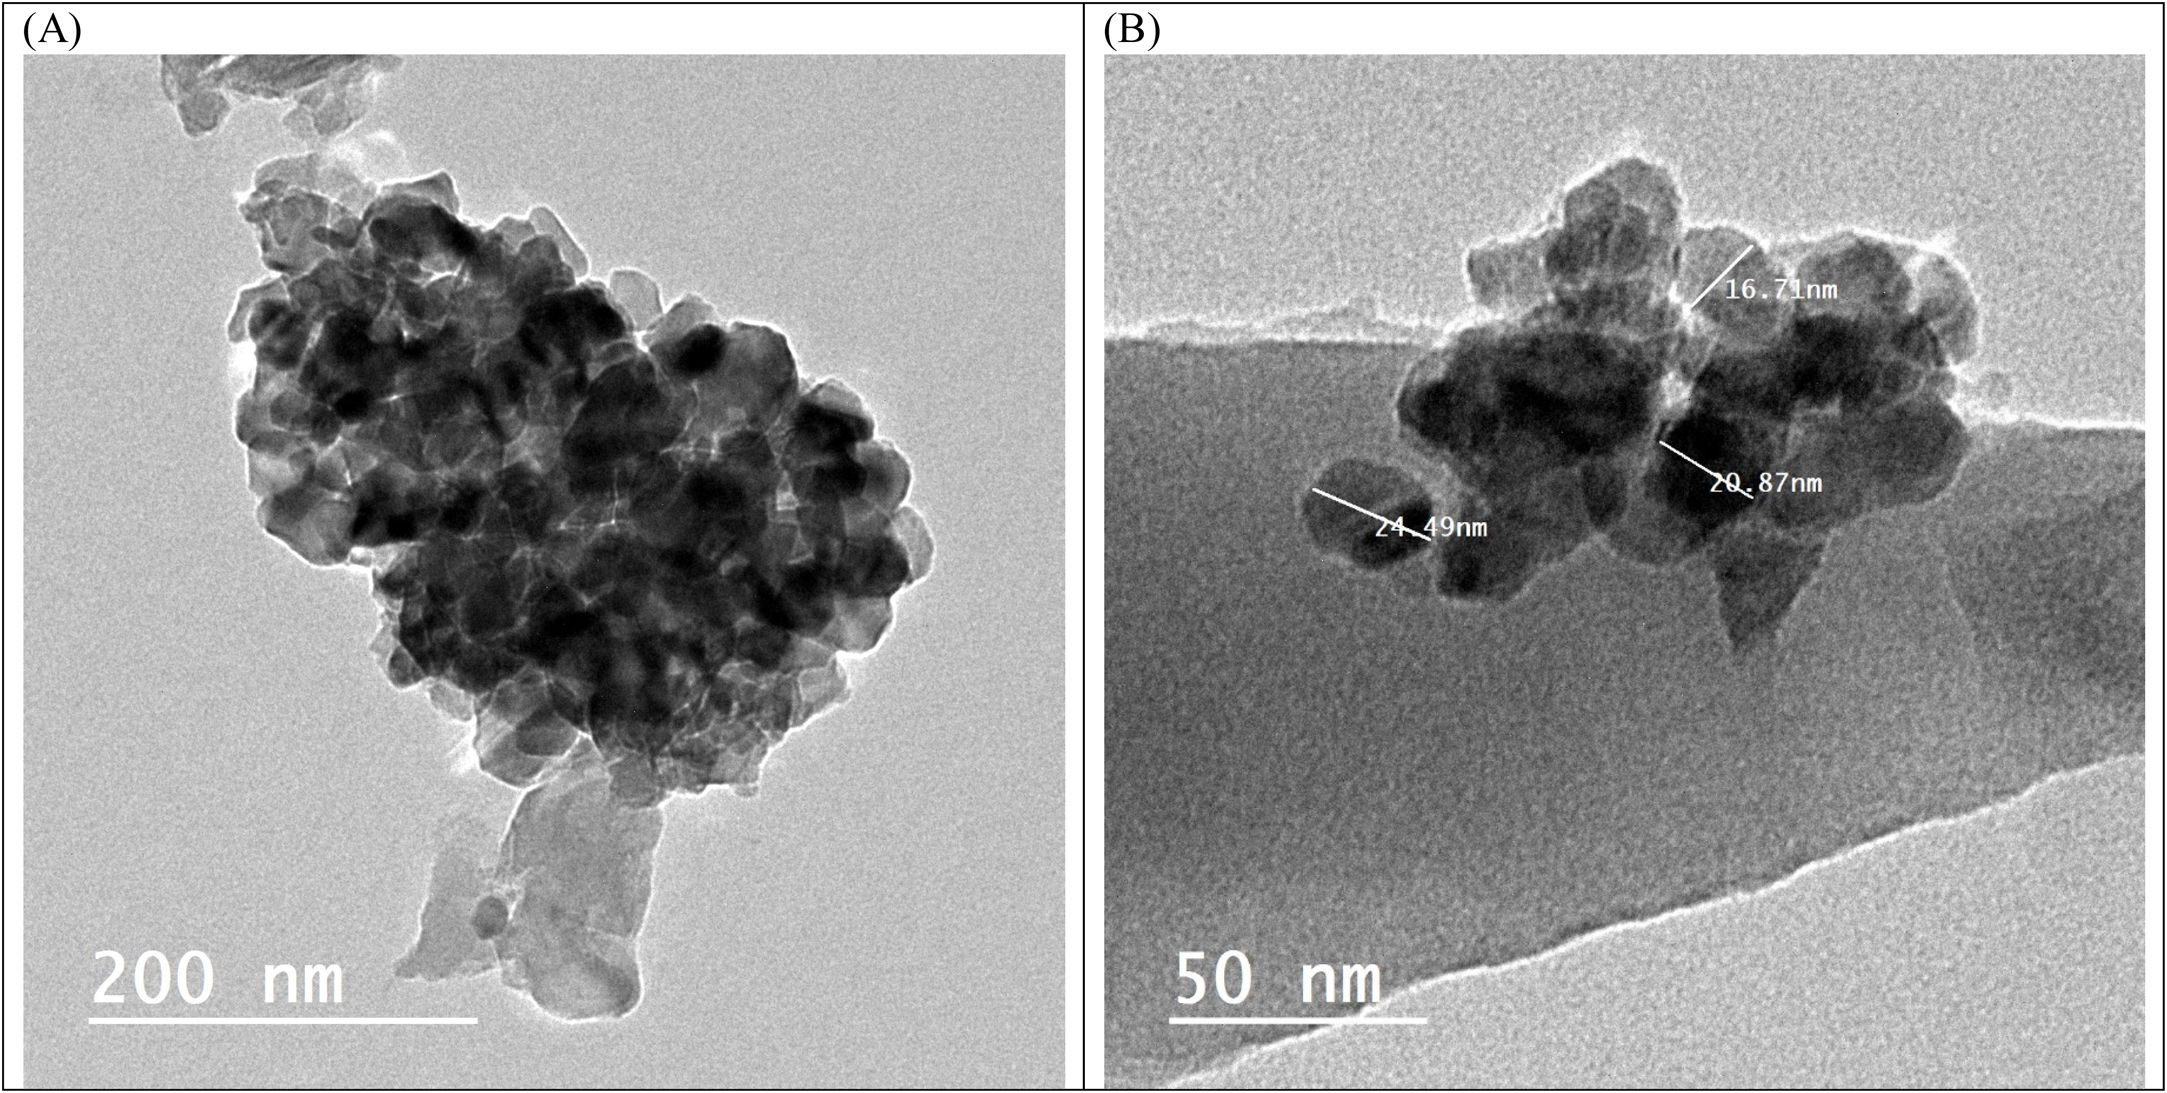
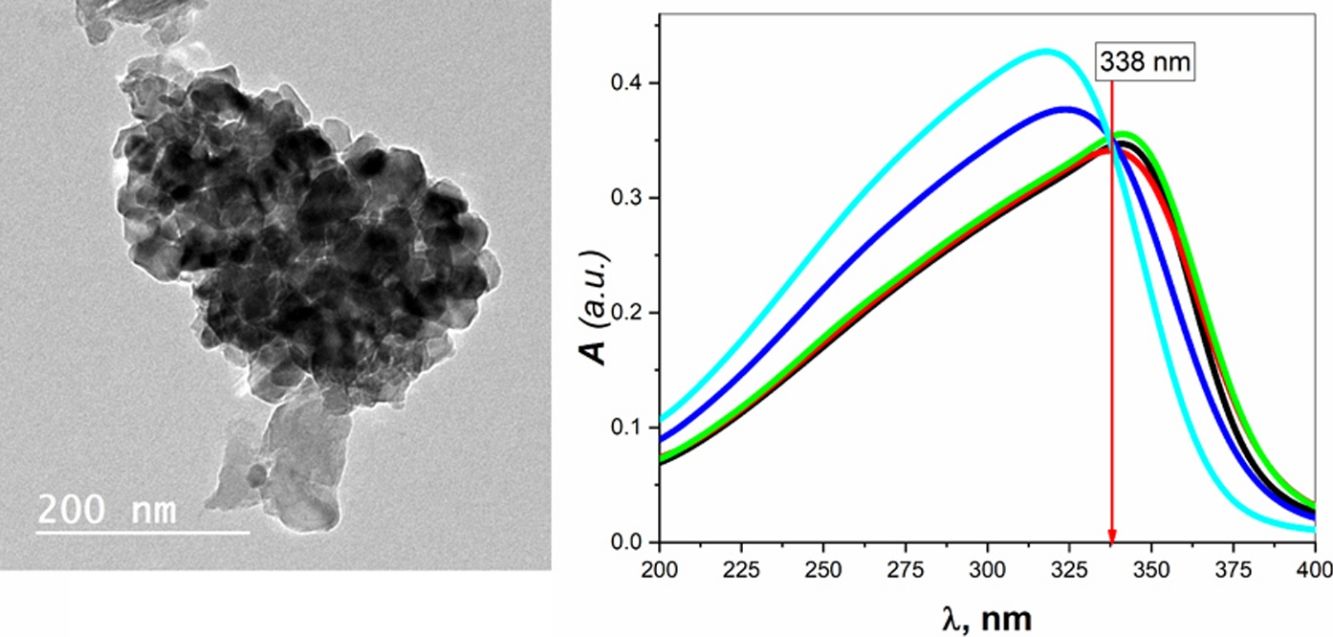
Transmission electron microscopy (TEM) studies were performed on the sample BBZ5, with the highest concentration of ZnO (x=20mol.%), Fig. 2. Low magnification, 200nm, and high magnification, 50nm, TEM images show that the particle size is 20nm on average, ranging from 16 to 25nm. Furthermore, some four-fold ZnO4 structural units (black spots) are well dispersed into the glass matrix, as glass former, with highly homogenous structure. Some large-sized particles may indicate that ZnO in this sample starts giving some sort of crystallinity to the system. This could be ascribed to the accommodation of some ZnO in the interstitial sites, however, this was not shown in XRD pattern, only broad humps were observed. This observation will be further confirmed by density, molar volume, and Urbach energy calculations.
Density and molar volume. (A) Low magnification 200nm, and (B) high magnification 50nm.")
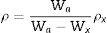
Density and molar volume are characteristic physical properties that are sensitive to any slight changes in the internal structure solid substances. In this regard, to study the effect of ZnO incorporation on the glass matrix, the densities were measured for all samples. Their molar volumes were calculated and recorded in Table 1. Density was measured by the fluid displacement method, and values were calculated using formula (1), where Wa, Wx, and ρx are the weight of the sample in air, the weight of the sample in Xylene, and Xylene density, respectively. Molar volume Vm was calculated using formula (2) where MW is the molecular weight of the samples.

Density, molar volume, electronegativity and calculated refractive index.
| Sample code | MW (g/mol) | ρ (g/cm3) | Vm (cm3/mol) | X | ngomaa |
|---|---|---|---|---|---|
| BBZ1 | 86.36 | 1.08 | 79.96 | 2.760 | 1.63 |
| BBZ2 | 89.38 | 1.28 | 69.83 | 2.750 | 1.61 |
| BBZ3 | 92.41 | 2.42 | 38.18 | 2.739 | 1.51 |
| BBZ4 | 95.43 | 2.55 | 37.42 | 2.729 | 1.50 |
| BBZ5 | 98.45 | 2.69 | 36.60 | 2.718 | 1.49 |
The observed increase in the density (ρ) value is related to the increase in the molecular weight, which is attributed to the replacement of low-density oxide B2O3 (2.55g/cm3) by high-density oxide ZnO (5.61g/cm3). Simultaneously, the observed decrease in the molar volume (Vm) value may be attributed to the relative decrease in the total number of Oxygen atoms, in agreement with published results [18,24]. Additionally, the Van der Waals radius values for both Zn and B atoms are 139pm and 192pm, respectively. This means that the smaller Zn atom, when it replaces the bigger B atom, fills the spaces in the glass matrix, increasing the system's compactness. This behavior of both density and molar volume indicates that the glass system becomes more compact with the addition of ZnO, in which the Zn2+ has a contracting effect. Values of both the density and molar volume were then substituted in the empirical formula (3)[22] to calculate the samples’ average refractive indices.
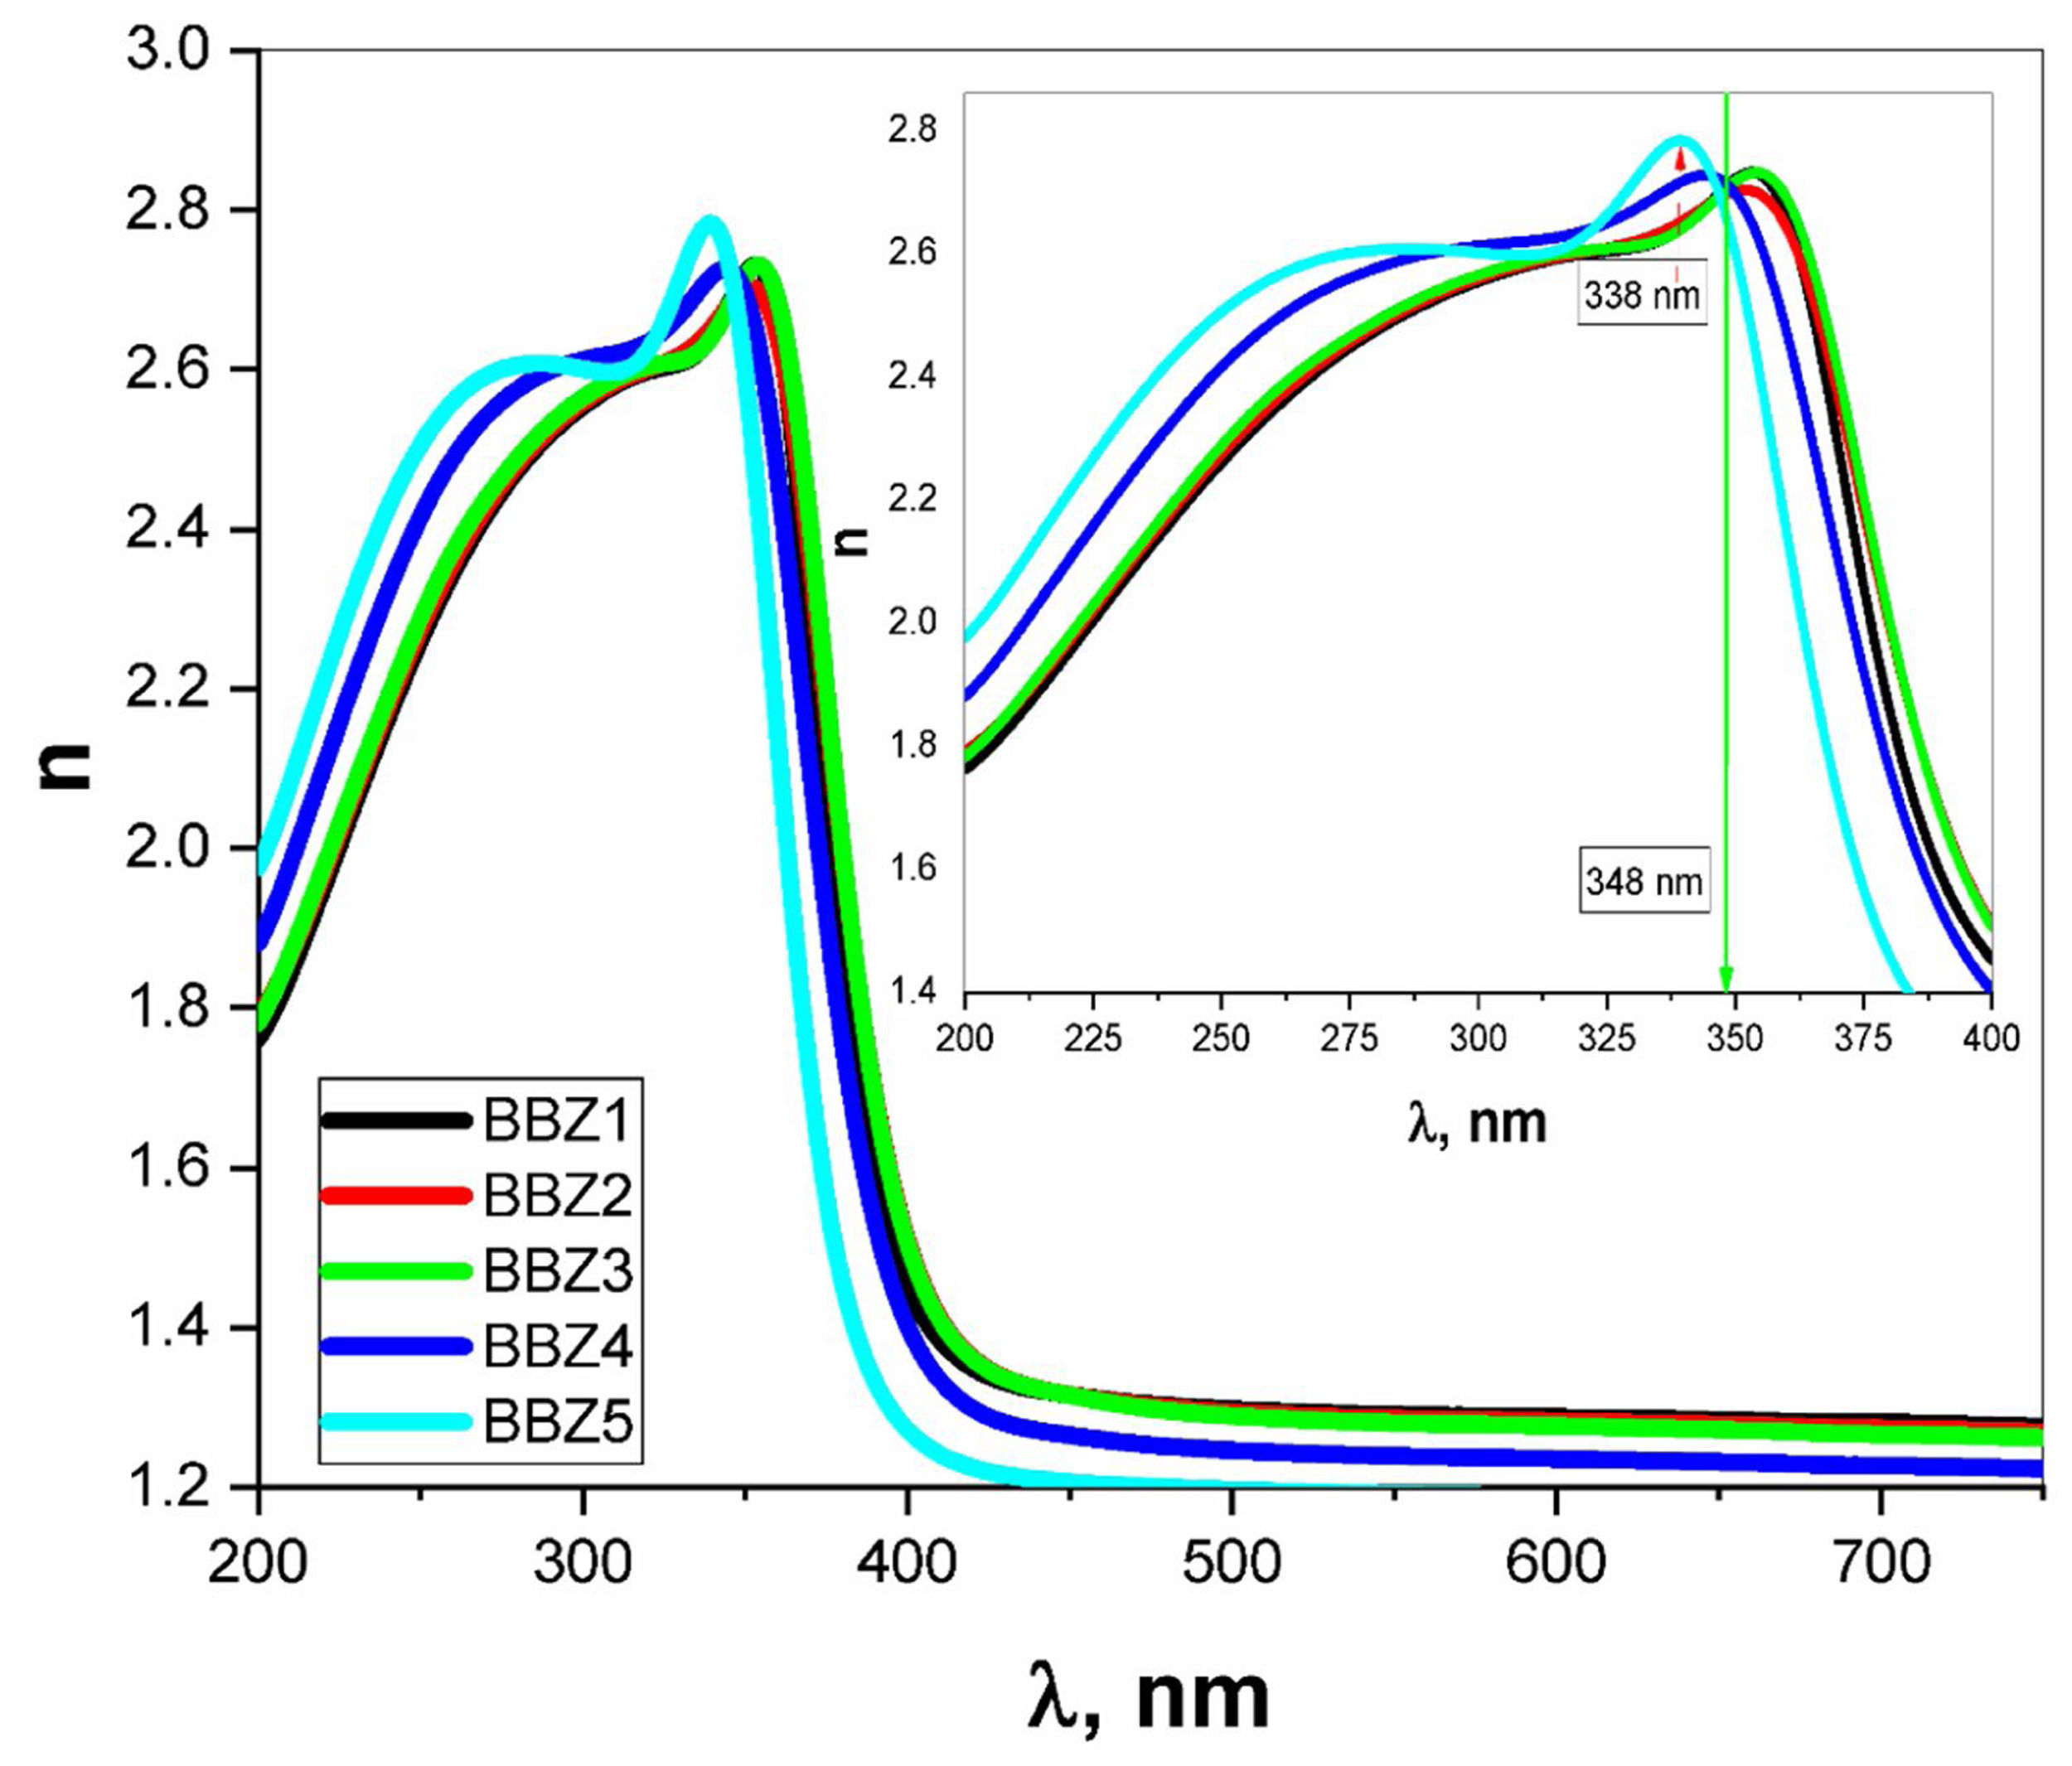
where Vm is the molar volume, χ is Pauling electronegativity, ni is the number of atoms of ith elements, N is the total atoms in the chemical compound, ri is the molar fraction of the oxide ith in the glass matrix. ngomaa is the empirically calculated refractive index, while A and B are the numbers of cations and all atoms in the glass chemical formula, respectively. Calculated values of refractive index tabulated in Table 1 agree with the measured values at wavelengths higher than about 338nm. Behavior of all optical parameters is reversed at this value, as will be seen and explained later.UV spectral analysis and linear optical parameters
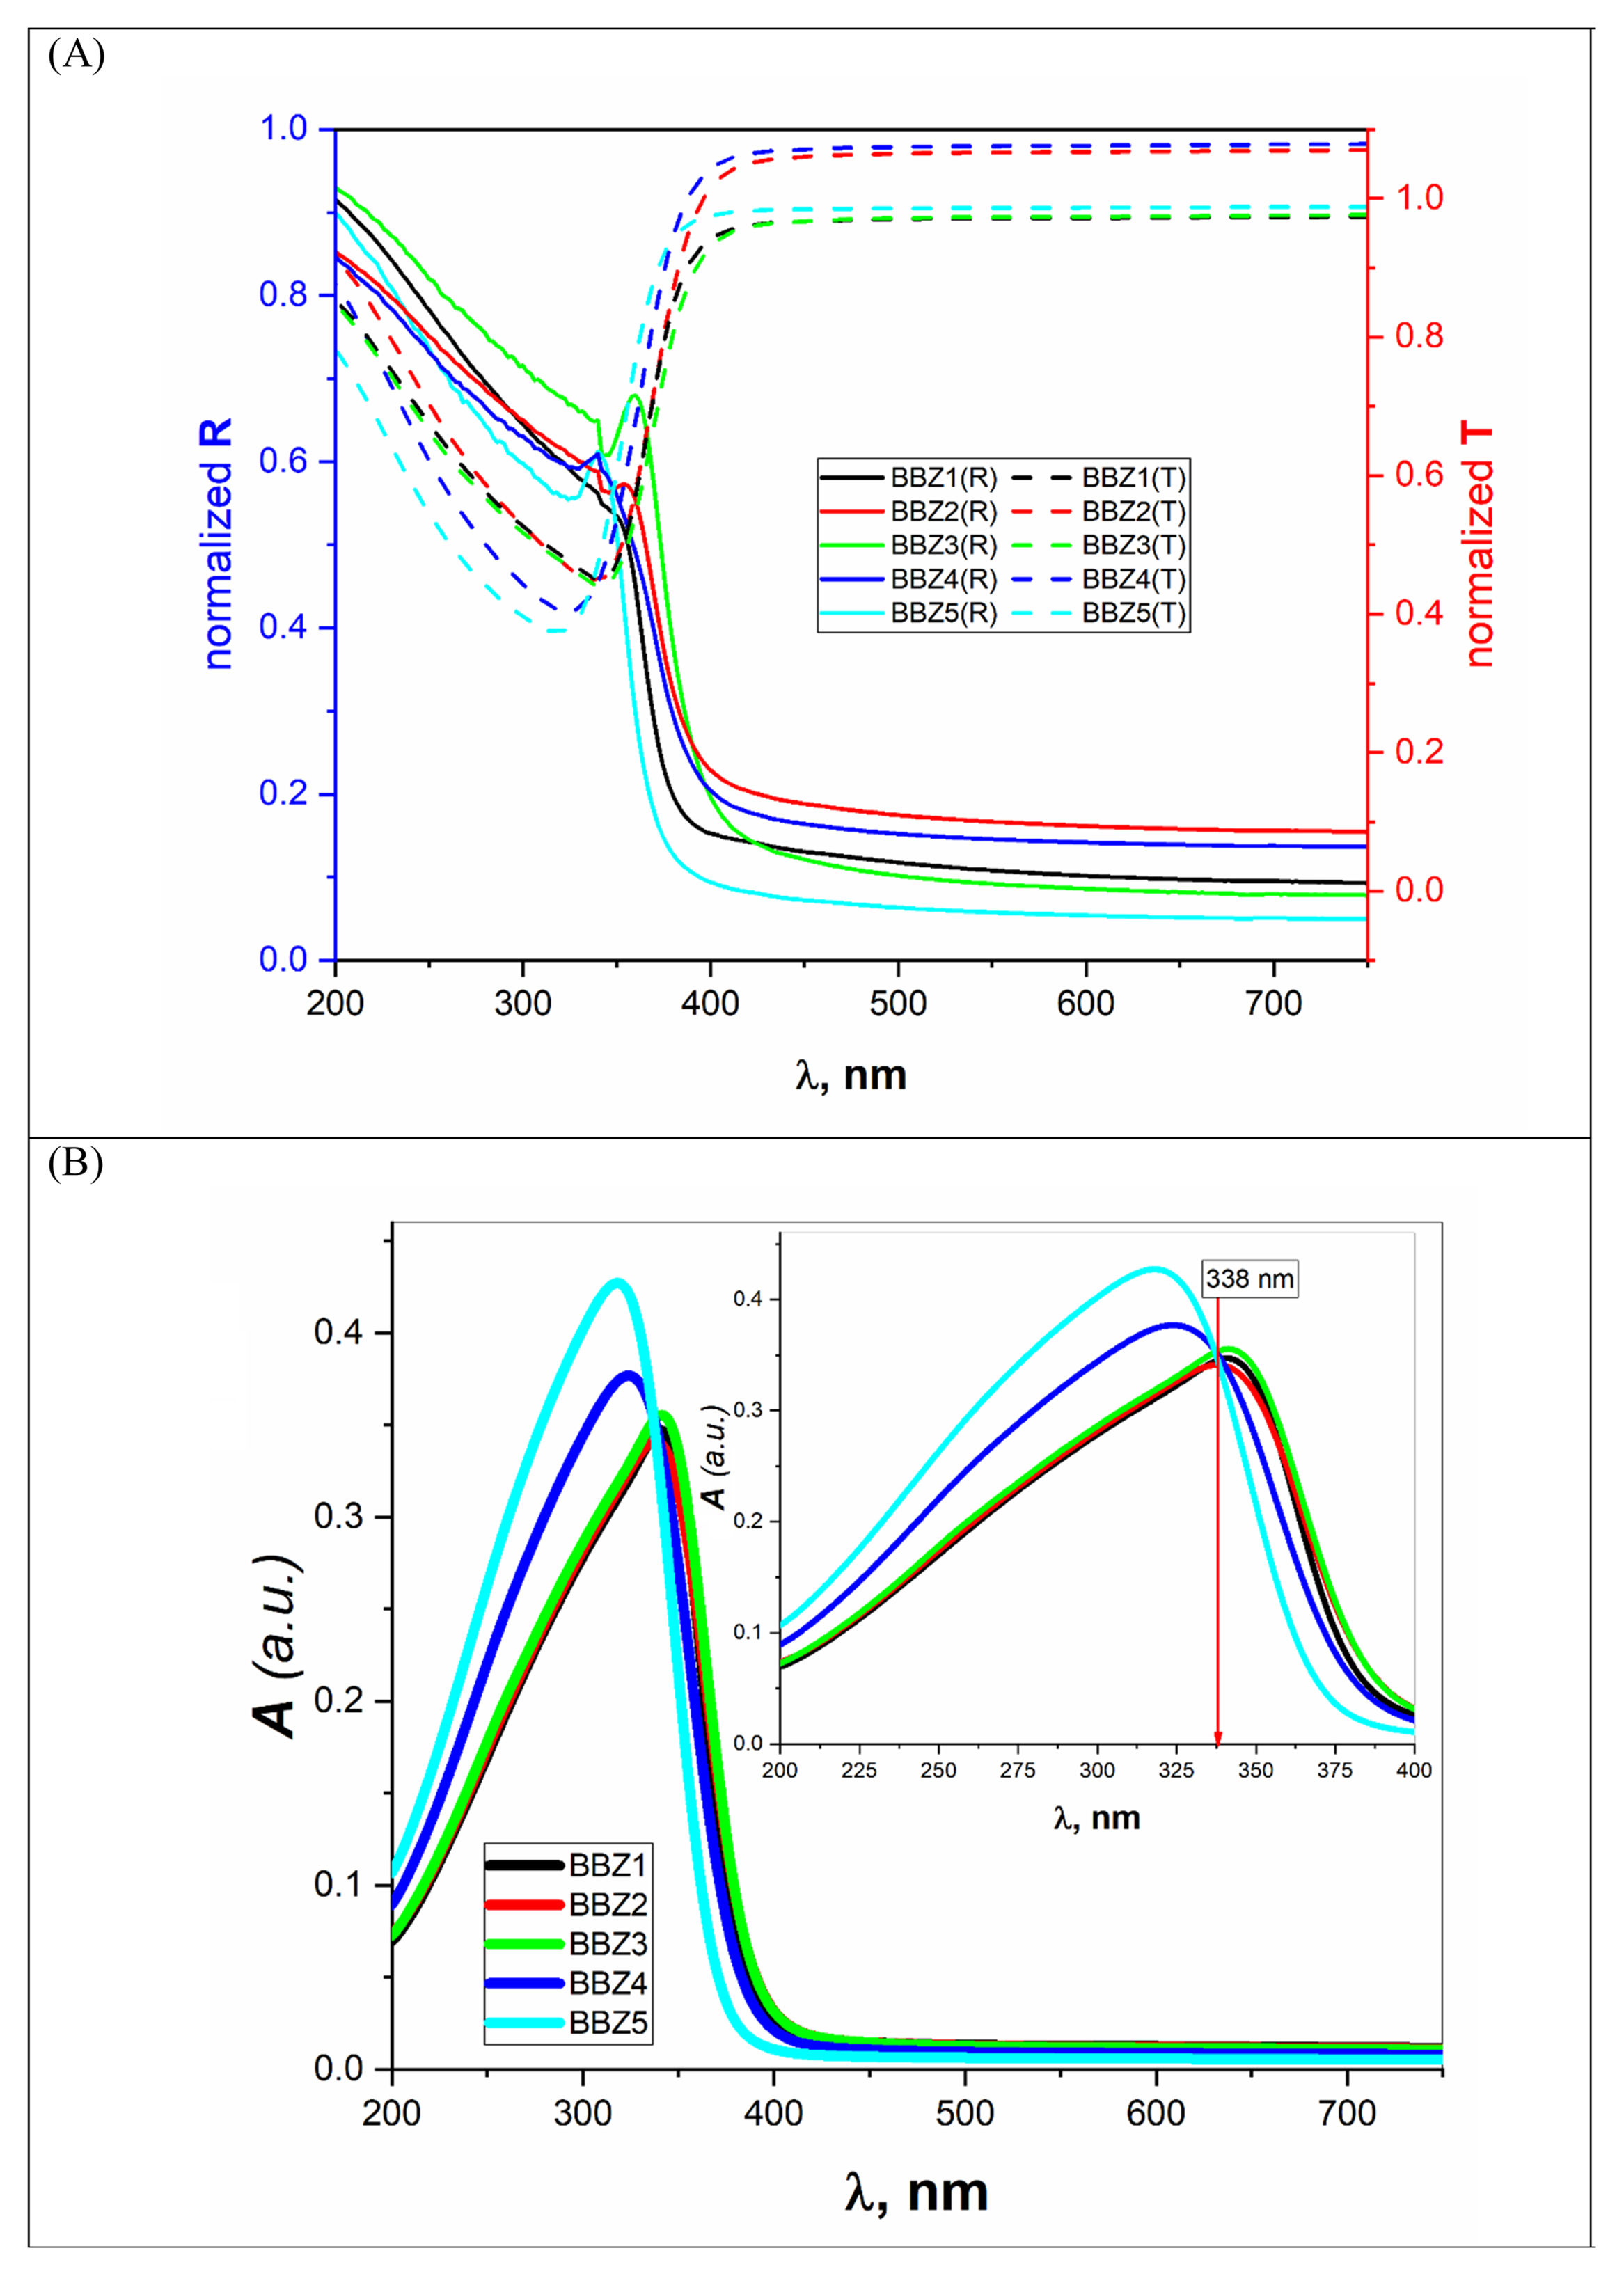
The absolute optical absorbance Aλ is an important optical parameter and was calculated based on the measured optical transmittance Tλ and the measured optical reflectance Rλ for all samples over a range of the wavelengths from 200nm to 750nm, using relation (5). Normalized measured optical transmittance T and reflectance R are presented in Fig. 3A over the full range from 200 to 750nm.
 Measured transmittance T and measured reflectance R in the wavelength range from 200 to 750nm. (B) Optical Absorption spectra over the wavelength range from 200 to 750nm. Inset: A over the significant range of 200 to 400nm.")
The absolute optical absorbance A is plotted in the wavelength range from 200 to 750nm for all samples. However, interesting observations were shown only between 200 and 400nm, as depicted in Fig. 3B. The optical absorption of the studied samples was affected by the incident light's wavelength and the structural compositions. It is found that as the wavelength increases, the absorbance increases until it reaches a maximum value and then decreases. Additionally, samples containing more ZnO show higher absorbance; until the wavelength of about 338nm (near the value of ZnO energy band gap) is reached, the behavior is reversed.
What happens here is that at wavelengths below 338nm, the ZnO is mainly responsible for electronic (π→π*) excitation transitions until all electrons in the top of the valence band are transferred to the conduction band. Here, despite the existence of ZnO in the interstitial states, as confirmed by the FTIR analysis, the electronic transitions dominate the situation and weaken the role of ZnO from modifying the glass matrix. However, after 338nm, ZnO is no longer absorbing and hence playing the role of matrix modifier and starts to increase the glass transparency, until the glass is totally transparent in the visible region. Another important observation is the shift of the absorption band center to lower values of wavelength (blue shift) as the amount of ZnO increases. For the zinc-free sample BBZ1, the maximum absorbance is reached at a wavelength value of about 343nm; meanwhile, when the ZnO content is maximum in sample BBZ5, the band center shifts to wavelength of about 315nm. This means that the changes in chemical structure/environment affected the absorption spectrum of the studied glasses. This spectral shift refers to a decrease in the molar absorptivity when increasing ZnO content related to the increased density. From another point of view, this blue shift can be explained along with the increase in the optical basicity of the samples by replacing oxide B2O3 of low optical basicity (0.43) with oxide ZnO of high optical basicity (1.03) [25,26].
Furthermore, this shift may refer to an increase in the glass matrix polarizability by increasing ZnO content, which can be acceptable on the basis that the electronic polarizability of ZnO is approximate twice the value that of B2O3 regardless of BaO [11,27]. Also, it can be observed that both height and broadness of the absorbance peak are increased by increasing the ZnO content, which can be related to an extreme increase in the optical bandgap. Moreover, the relative decrease in the total number of oxygen atoms can be attributed to the glass central linker, which confirms the glass molar volume decrease. Hence, one should realize the decrease in optical transparency and increase the optical absorption by increasing the ZnO concentrations. These results suggest the studied glasses be used as high-energy UV-filters and optical switches.
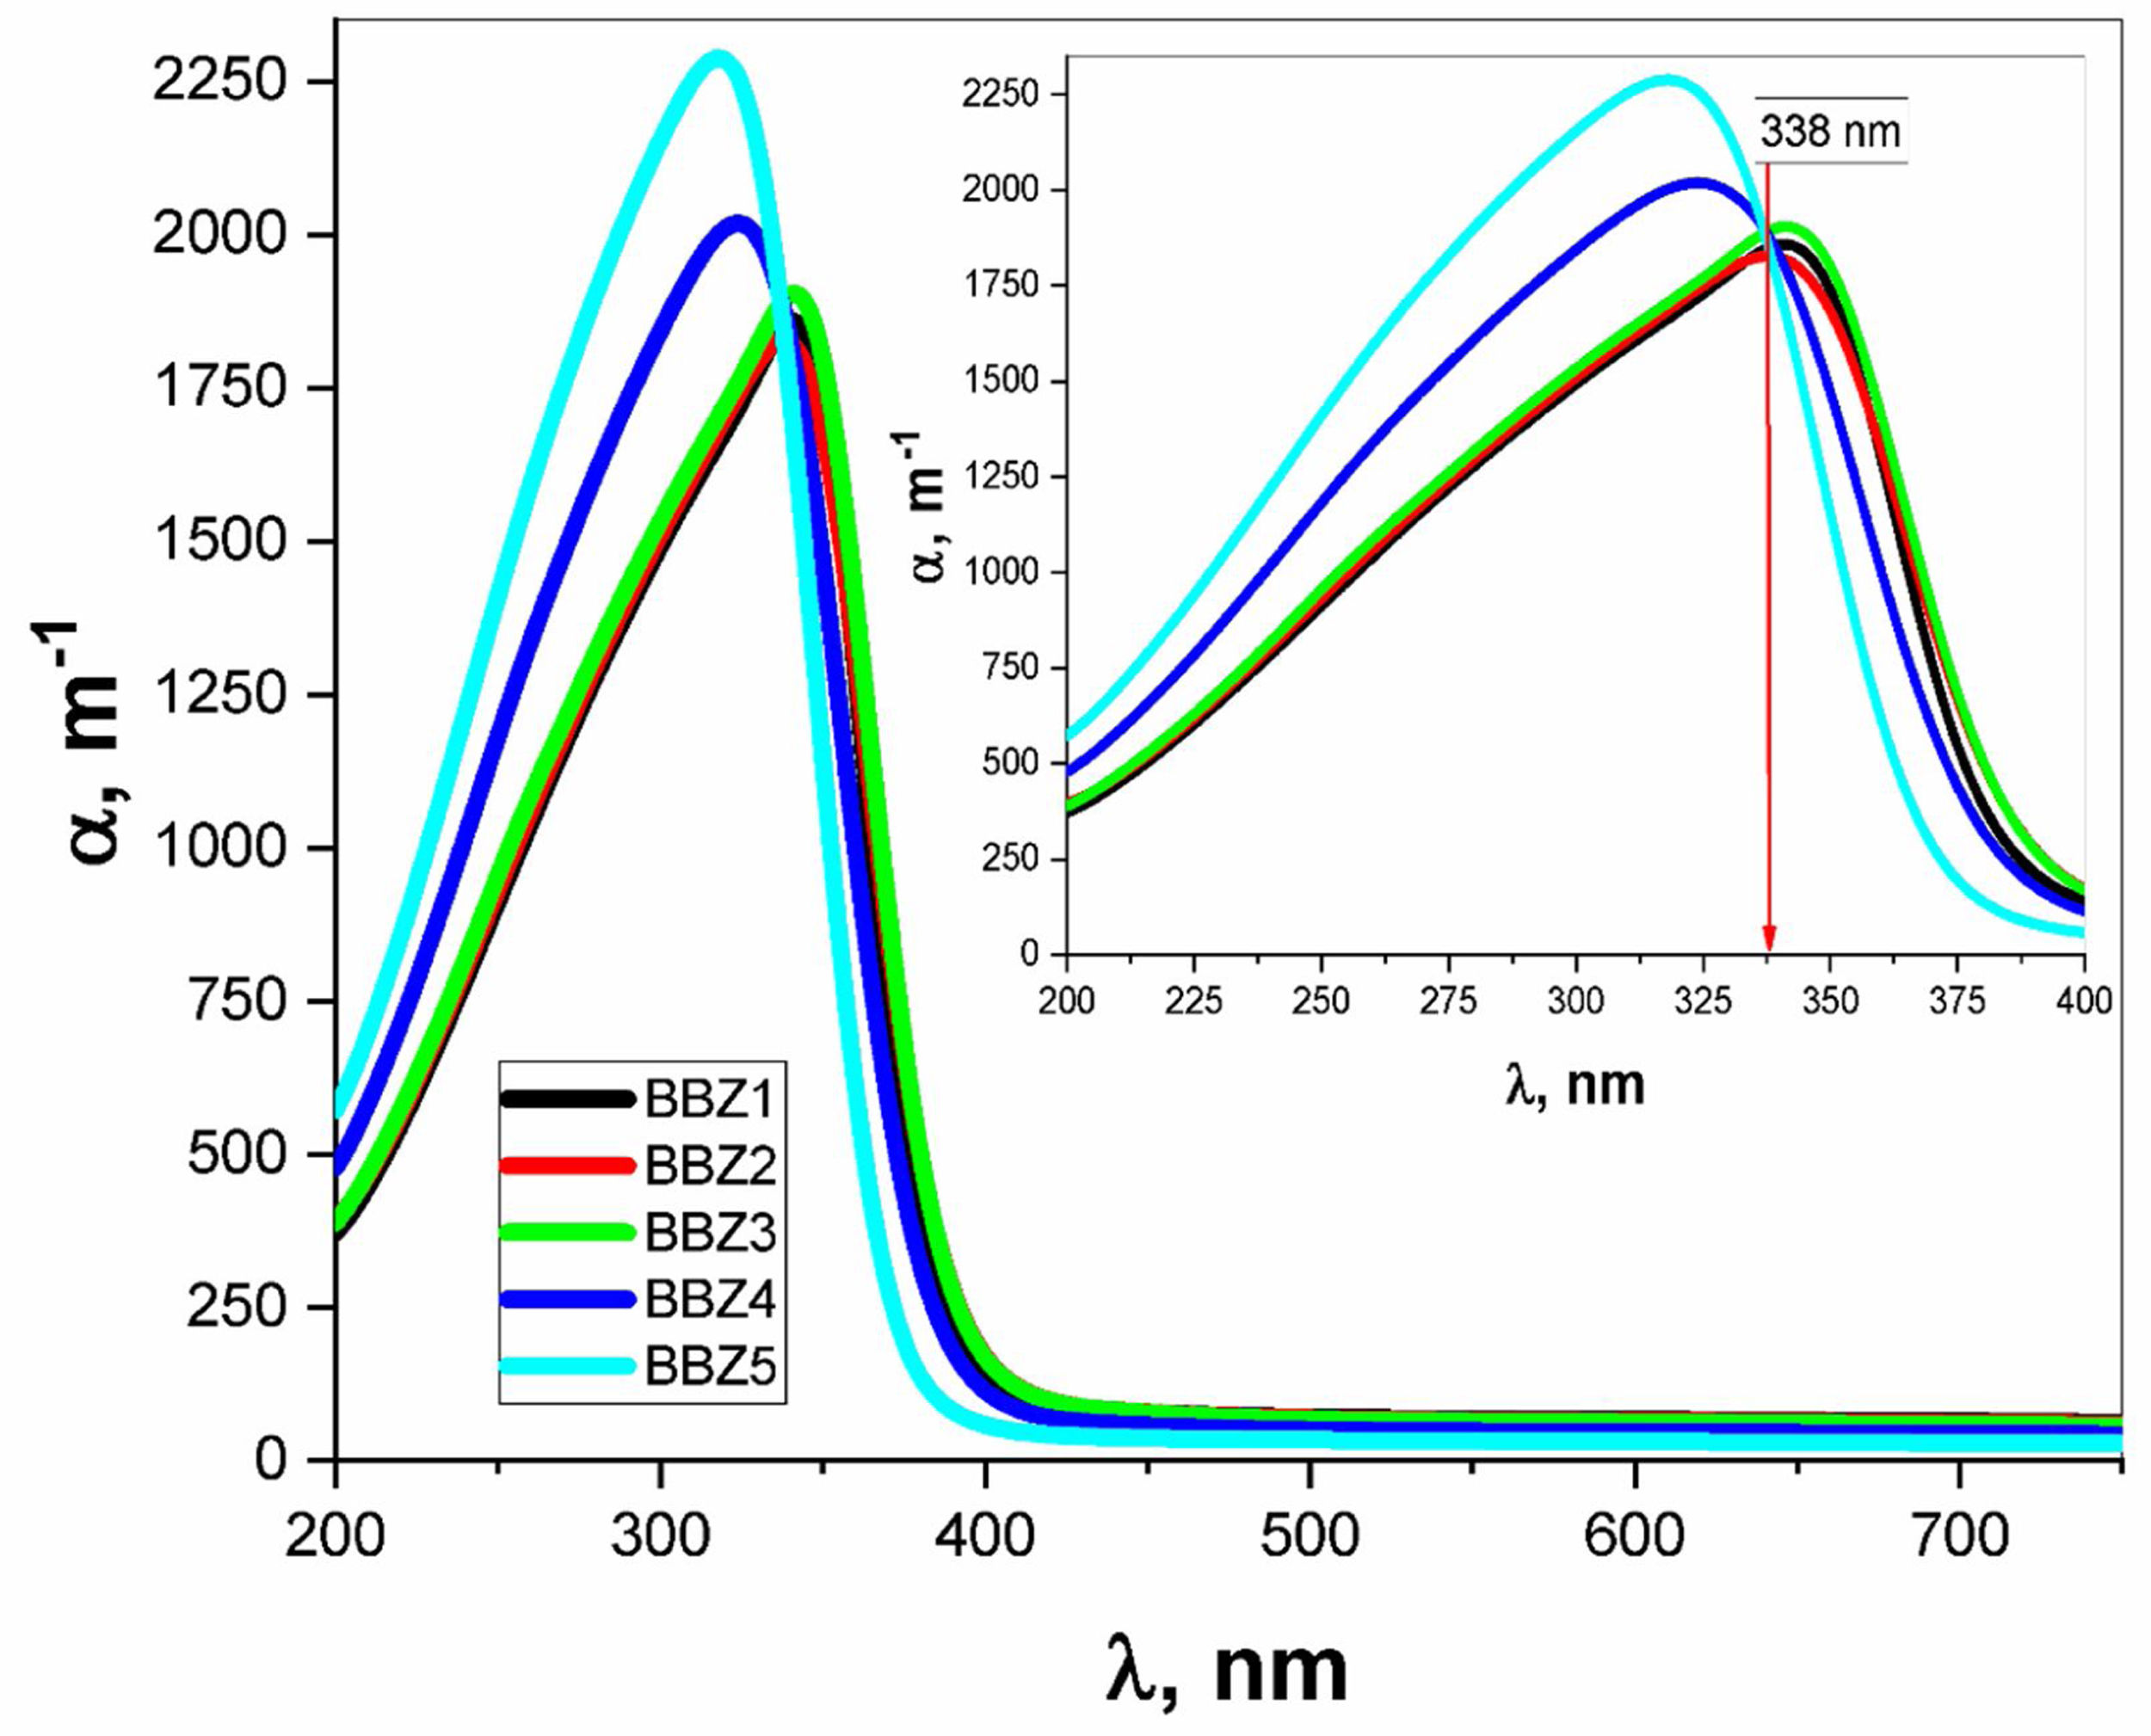
Using the relevant relations mentioned elsewhere [28,29], both the absorption coefficient α and the linear refractive index n were calculated for all samples as shown in Figs. 4 and 5, respectively. These figures showed that, as the ZnO content increases, the absorption coefficient increases in the high energy region until the wavelength reaches the value of 338nm, then the behavior is reversed. The refractive index also shows an incremental behavior with the increment of the ZnO content. In the high-energy region, until the wavelength reaches the value of 348nm, then the behavior is also reversed. This coincides with the results of optical absorption and has the same explanation. These results indicate a direct proportional between the ZnO, the glass density, and the value of the frequency. However, for the low energy refractive index, after wavelength values of 348nm, the glass system becomes more transparent with increasing ZnO content, as explained previously. Then the refractive index shows a decremental behavior in the low energy region. This was predicted in the previous section using the measured density values and employing the empirical formula (3). Such behavior can be assigned to the occurred competence in the glass matrix due to the decrease in the molar volume and the relative number of oxygen atoms.
 over the wavelength range from 200 to 750nm. Inset: α over the significant range of 200–400nm.")

The absorption coefficient was used in the calculations of the optical bandgaps for both the direct and indirect electronic transition in addition to Urbach energy, as tabulated in Table 2. The method of calculation is shown elsewhere [30]. Values for the indirect transition bandgap and the direct transition bandgap showed a slight increase, 0.14eV and 0.11eV, respectively, between BBZ5 (Zinc-rich sample) and BBZ1 (Zinc-free sample). This indicates the incorporation of ZnO in the system developed a wider bandgap. Additionally, Urbach energy values showed a very slight decrease by 0.017eV from the BBZ1 TO BBZ5. This may indicate a very slight decrease in the randomness peculiarities and a very slight increase in the system order due to the accommodation of Zn atom in the interstitial sites. This interpretation agrees with calculations of the molar volume and observations by transmission electron microscopy studies, as discussed previously.
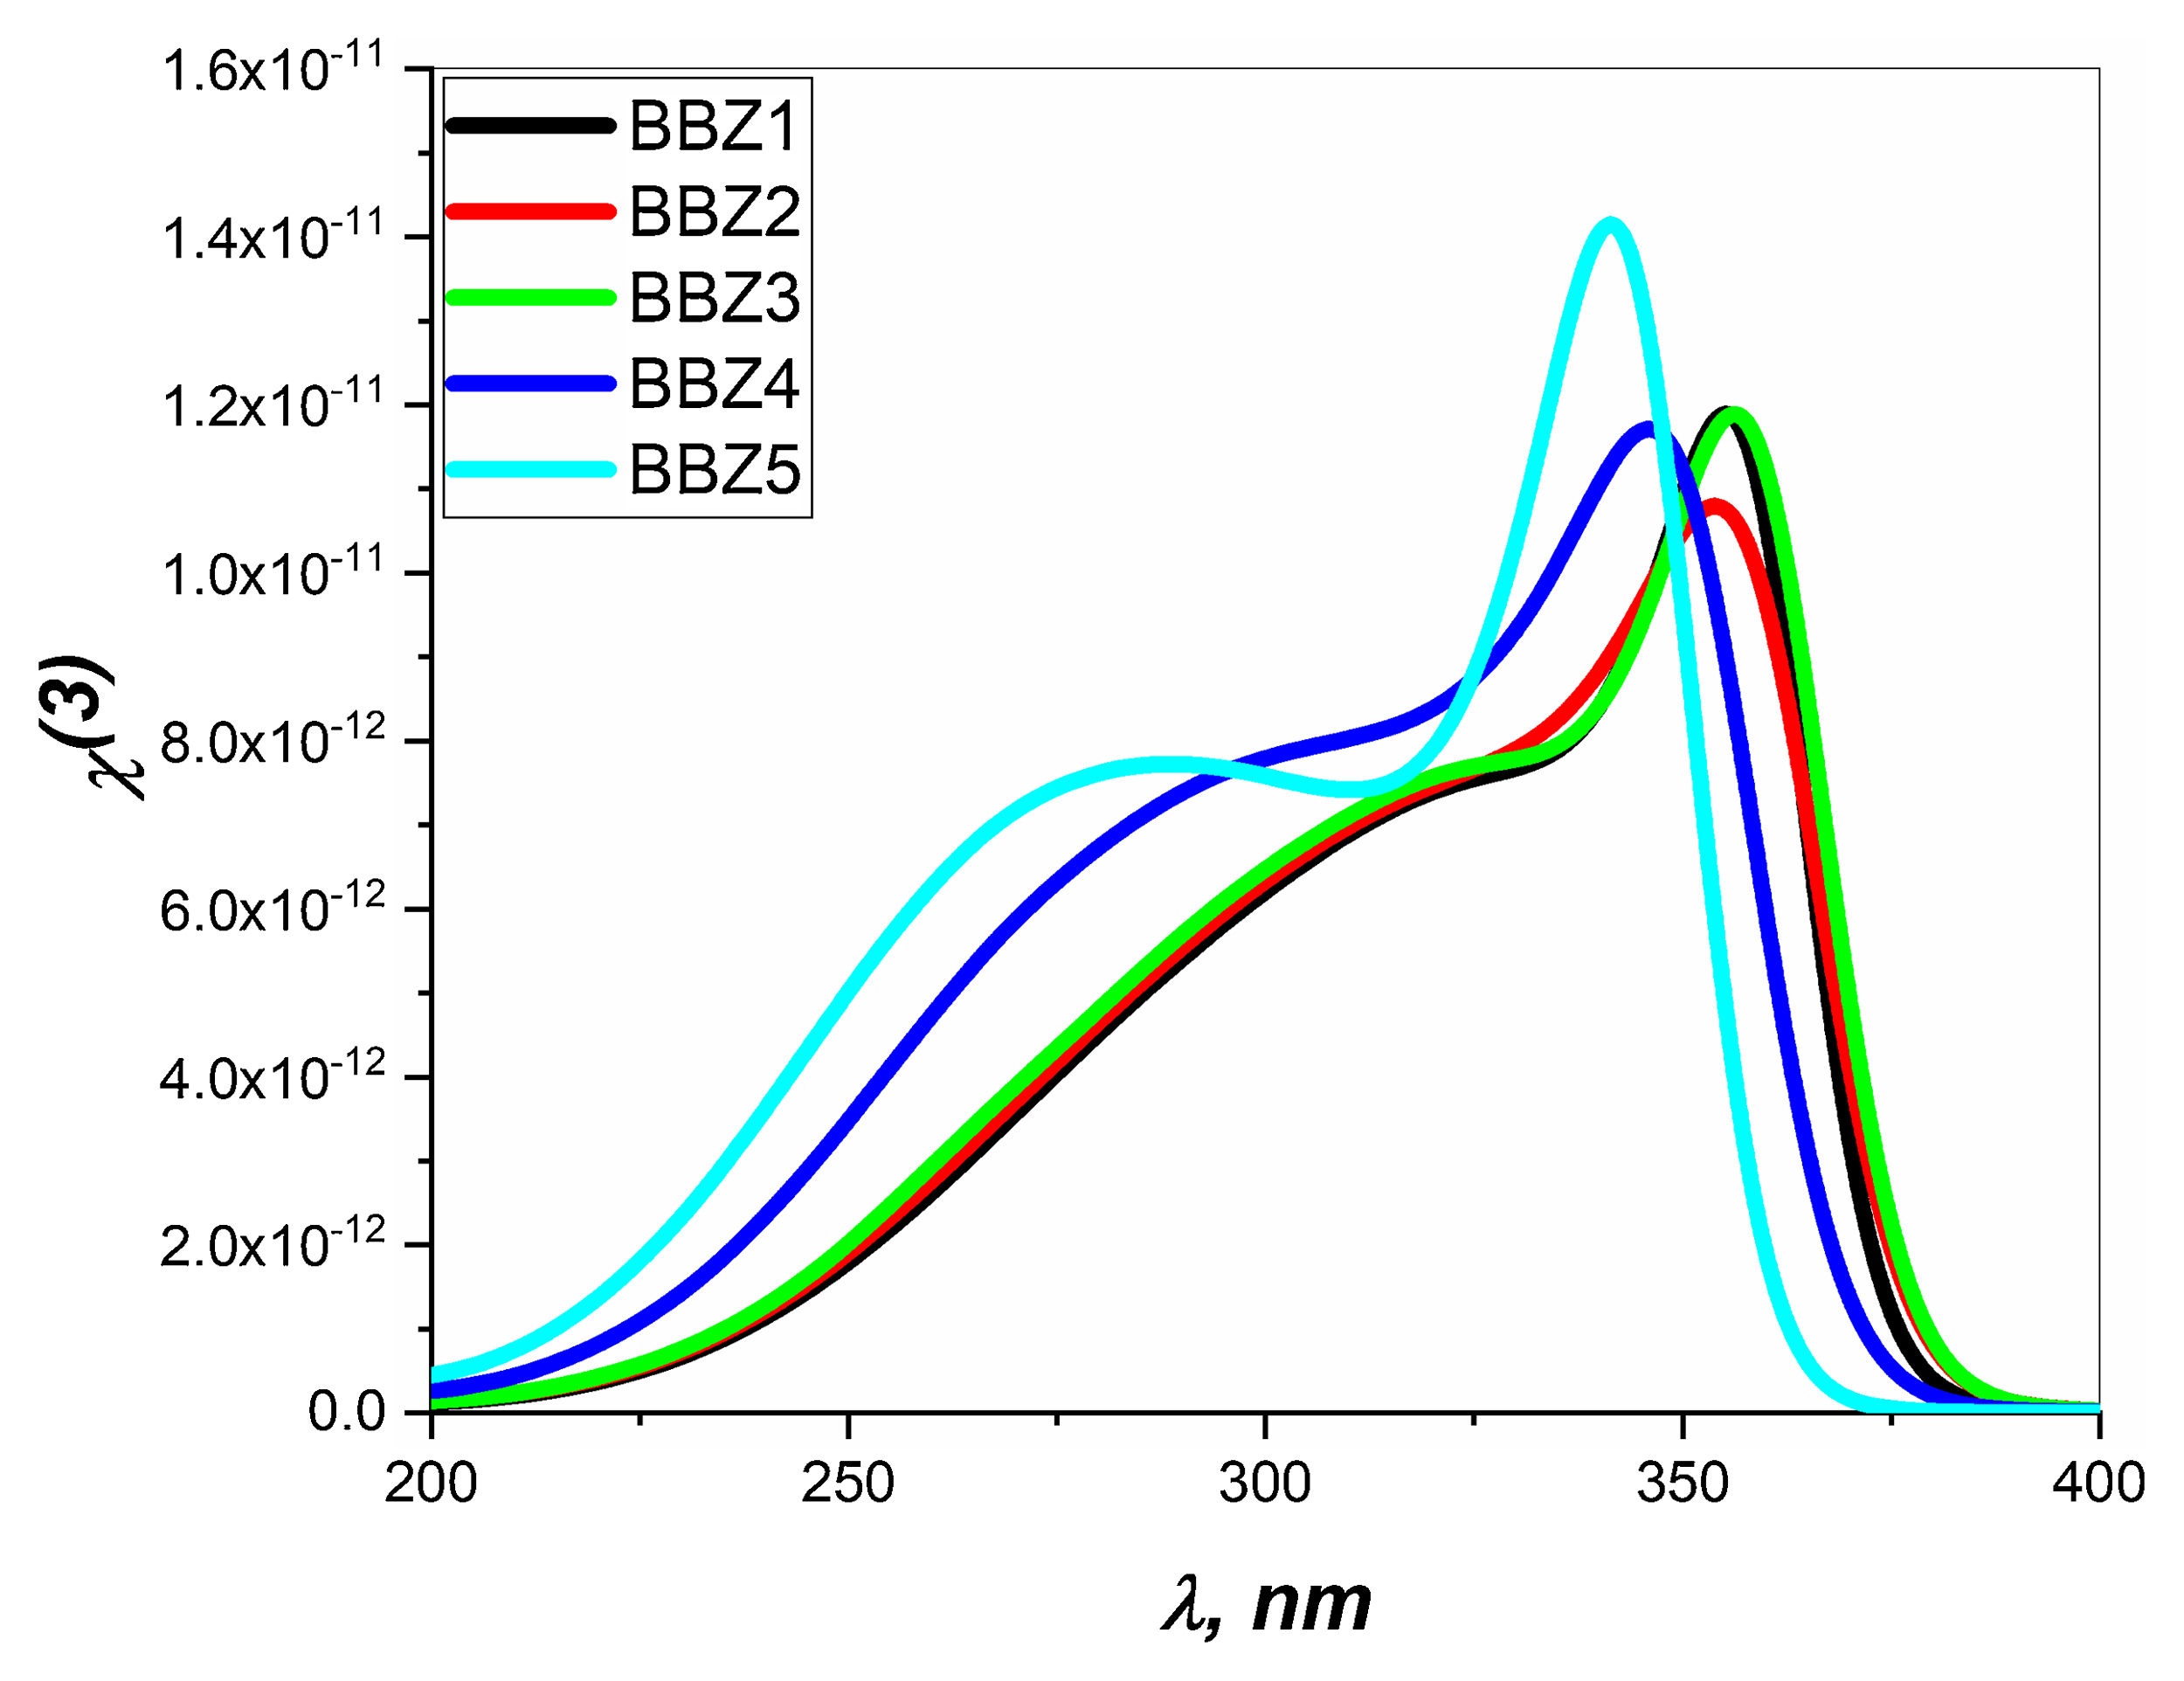
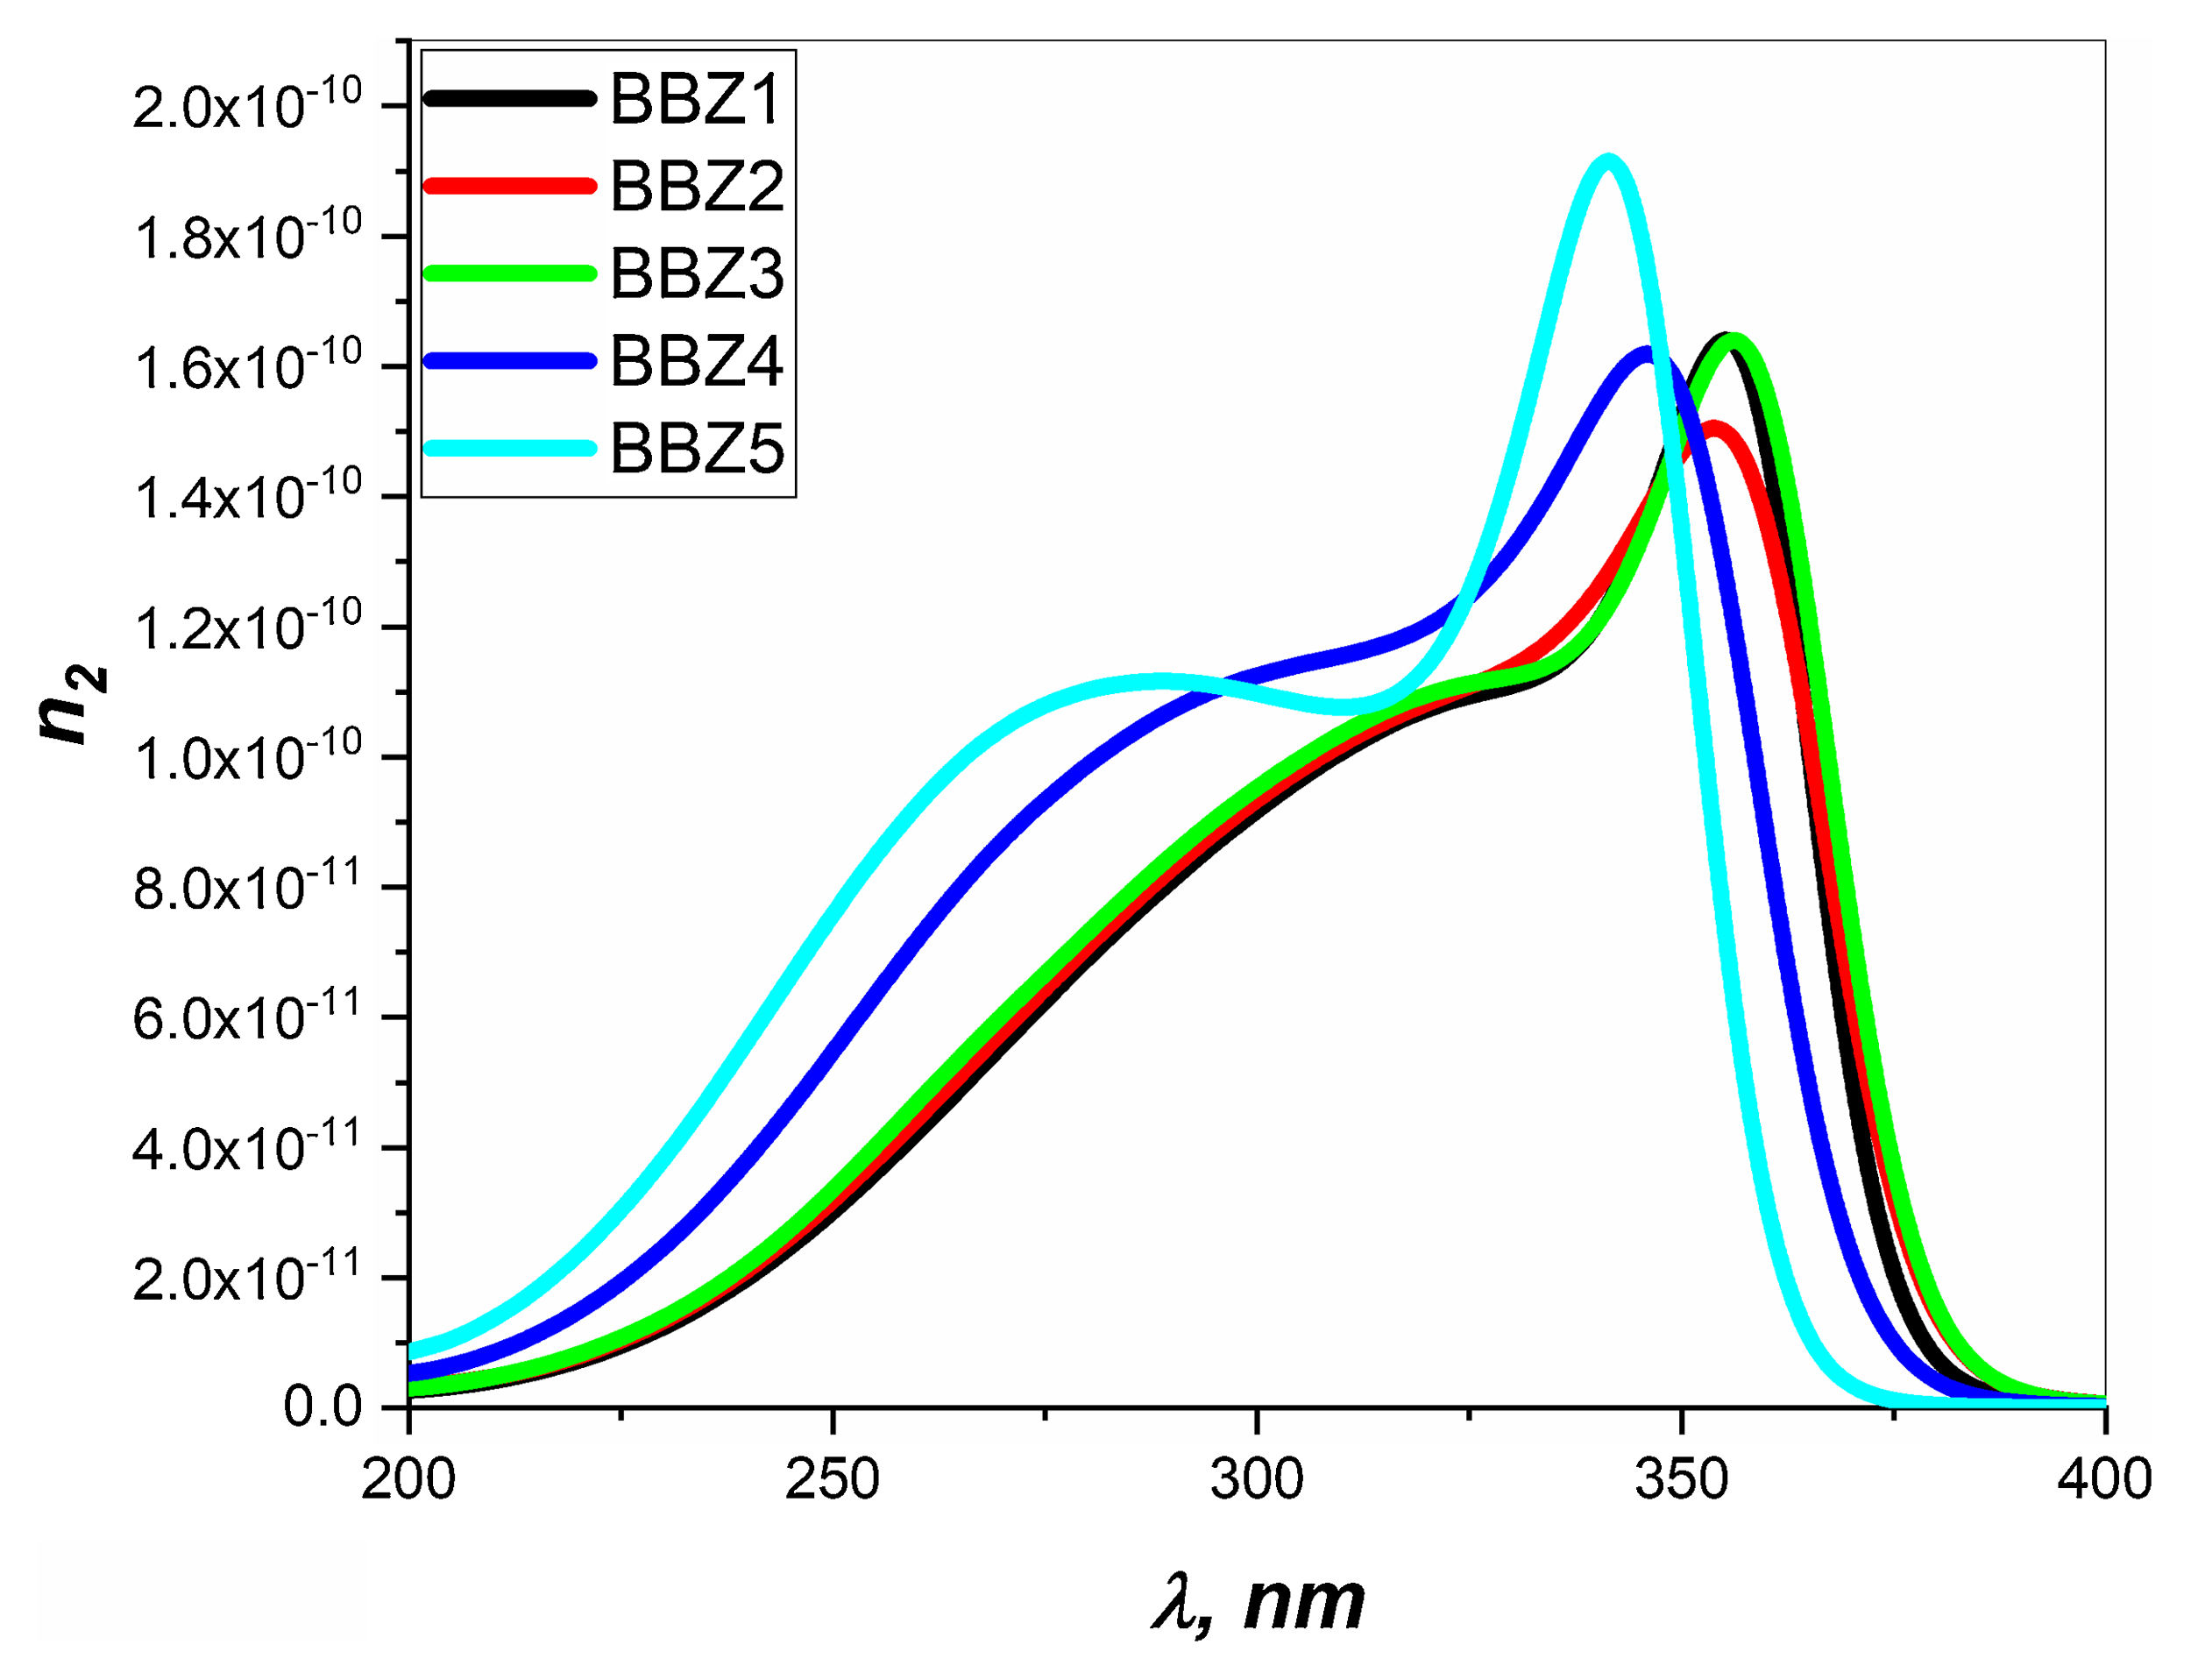
Nonlinear optical parametersNonlinear optical parameters are very important to be considered when studying materials for potential optical and photonic device applications such as optical waveguides and optical fibers [31]. Following equations were used for calculating the nonlinear optical parameters, namely, third-order nonlinear susceptibility χ(3) (Eq. (8)) and nonlinear refractive index n2 (λ) (Eq. (9)) [28].

Figs. 6 and 7 depict the third-order nonlinear optical susceptibility and the nonlinear refractive index for all samples. As manifested in the data graphs, both parameters’ highest peak intensity is shown for the sample BBZ5, the ZnO-rich sample. Additionally, the said peak is centered around 340nm for both parameters, close to the reversion point – absorption peak – as discussed earlier. These results suggest this sample for potential applications in photo-electron devices such as frequency converters [32].


In other words, the increase of ZnO improves the nonlinear optical properties of the studied glasses, where the higher values of both the nonlinear refractive index and the third-order susceptibility suggest the rich ZnO-glasses for nonlinear optical applications [33].
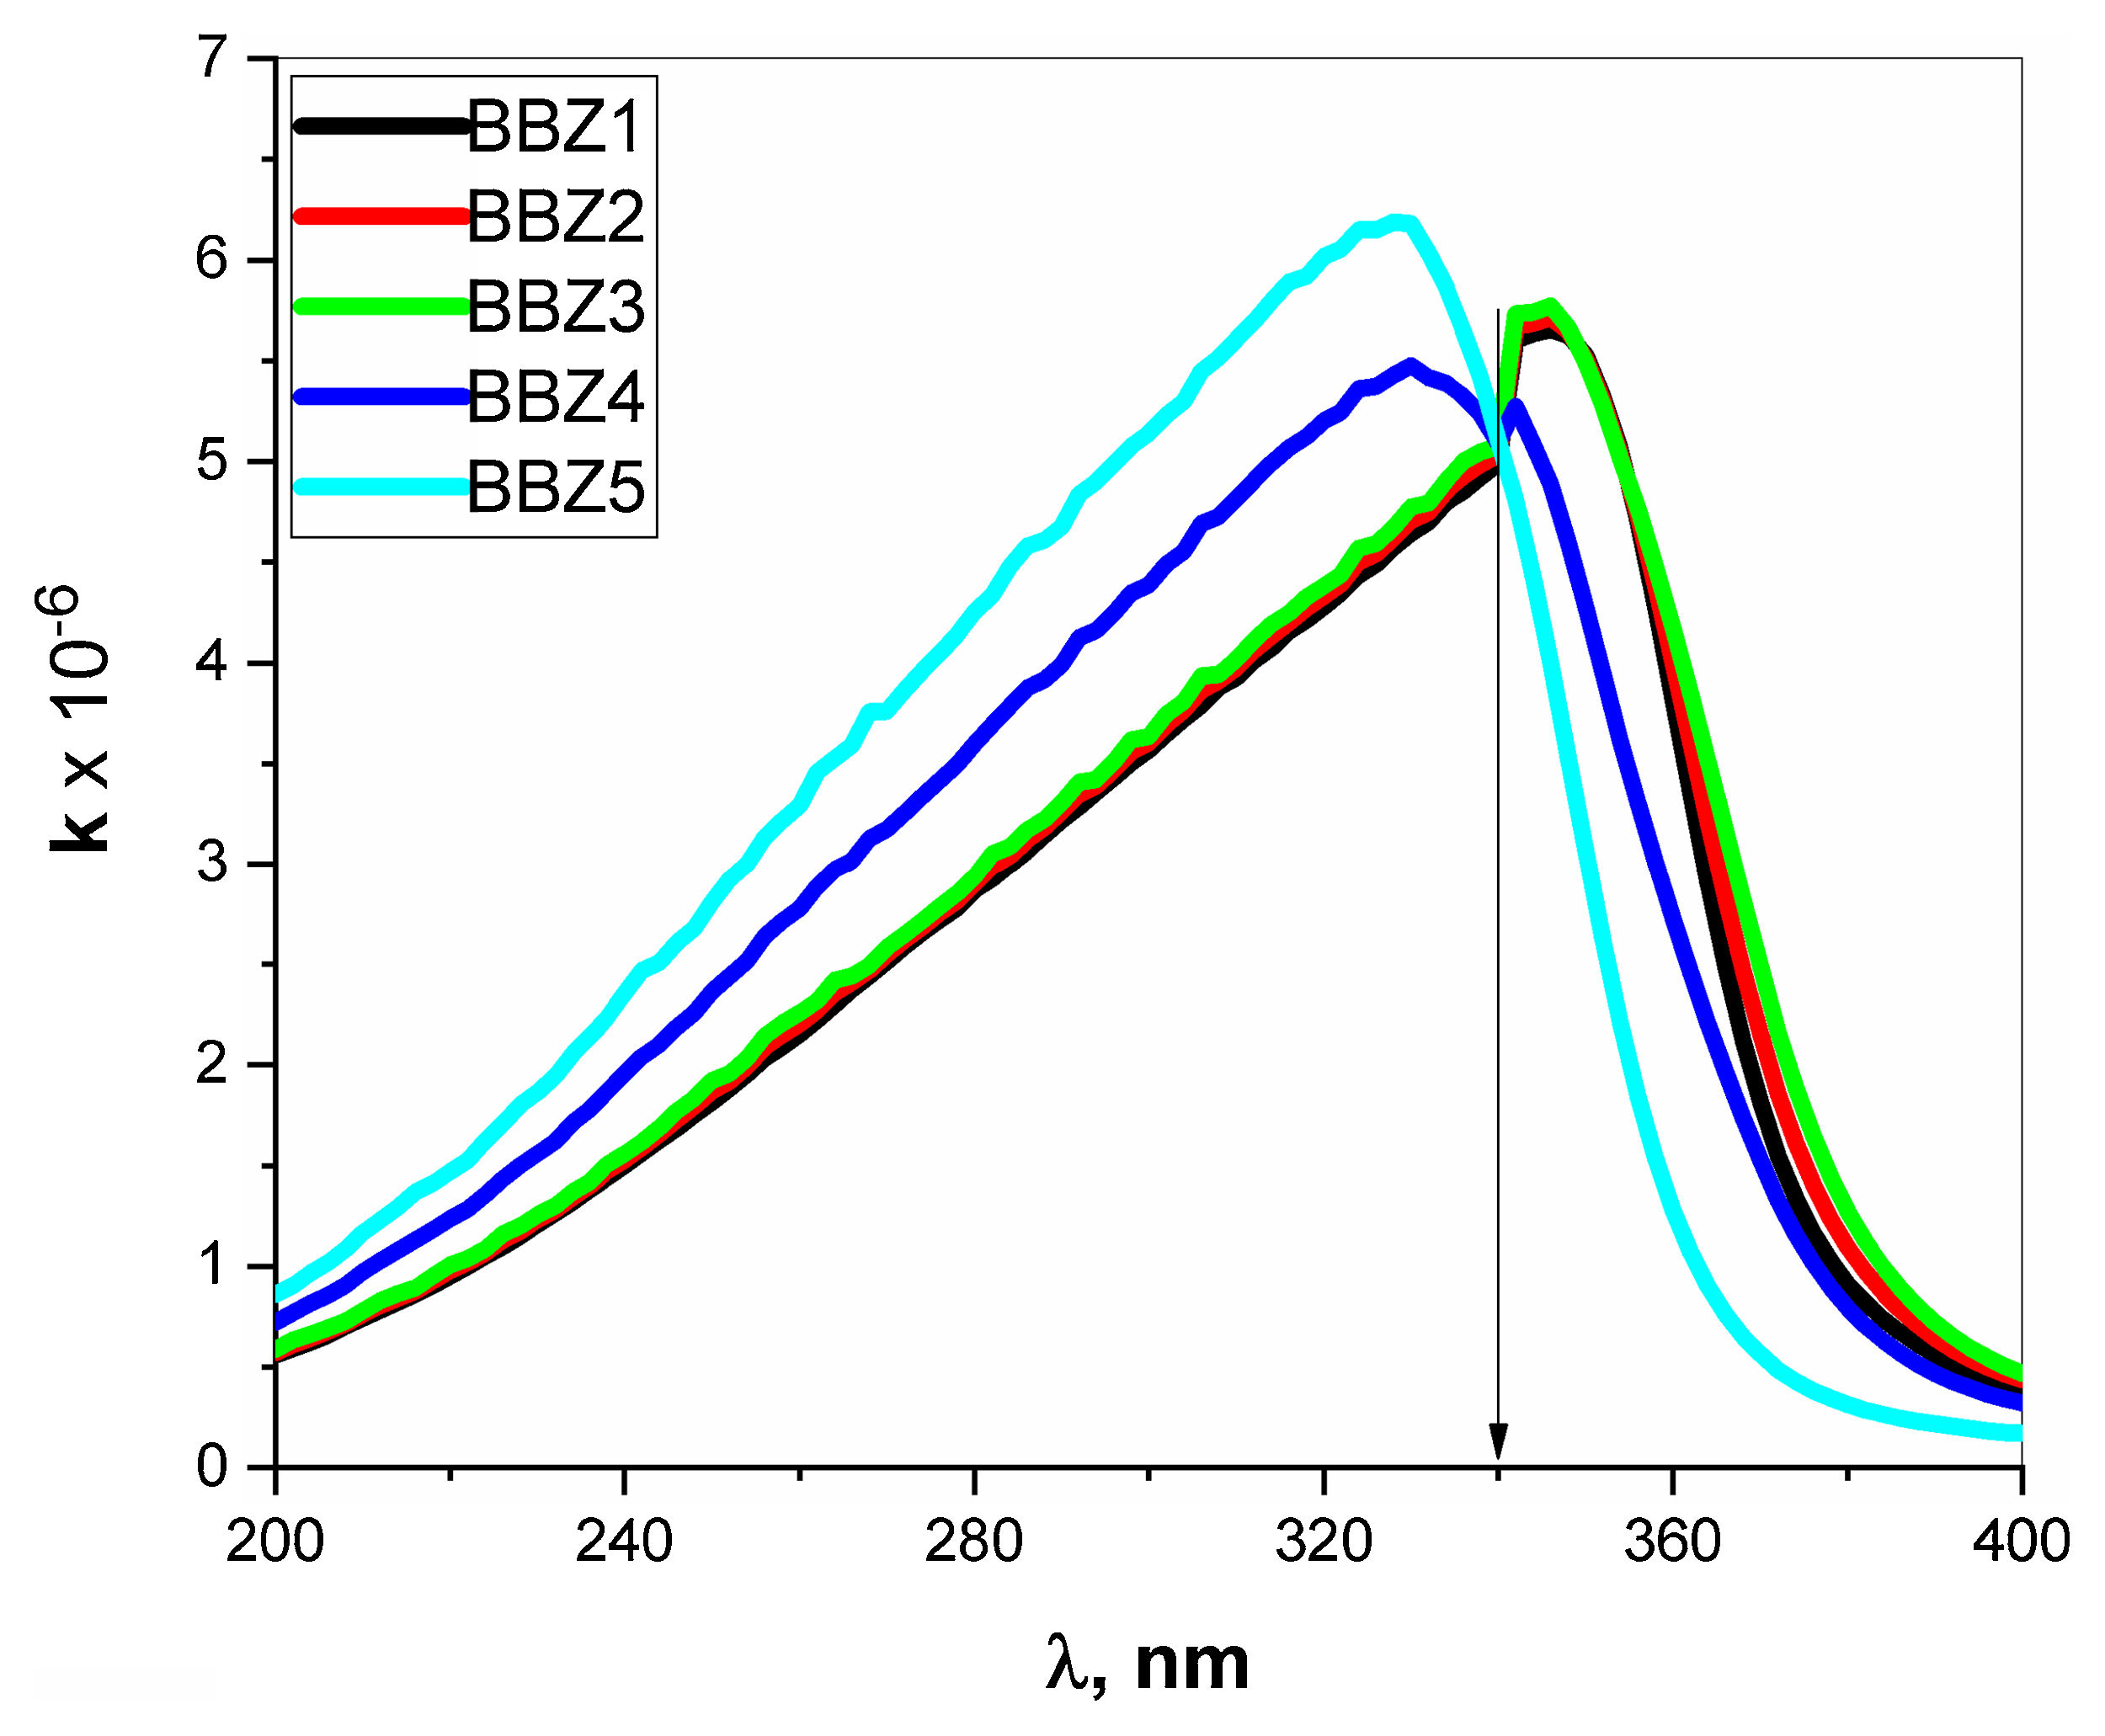
Extinction coefficient k represent the imaginary part of the refractive index and is a function of the absorption coefficient and wavelength, where k=0.08αλ. The k-value represents the amplitude of the damping vibration of the electric field of light [34,35]. Fig. 8 depicts the variation of k-value with the wavelength of the incident photons. As seen in the figure, the k-Value increase when ZnO increase for all wavelengths shorter than 340nm, then shows opposite behavior for the wavelengths longer than 340nm. In other words, the point 340nm is an inversion point at which the k-value reaches its maximum limit. Such behavior means that the optical resistance, of the studied material, shows a breakdown at this point, where the light passes without any decay. This means that the increment of ZnO increases the optical energy loss in wavelength ranged from 200 to 340nm, then reverses its effect for wavelengths above 340nm. Such behavior may suggest the studied glasses to be uses as optical switchers [36,37].
Optical dielectric parameters
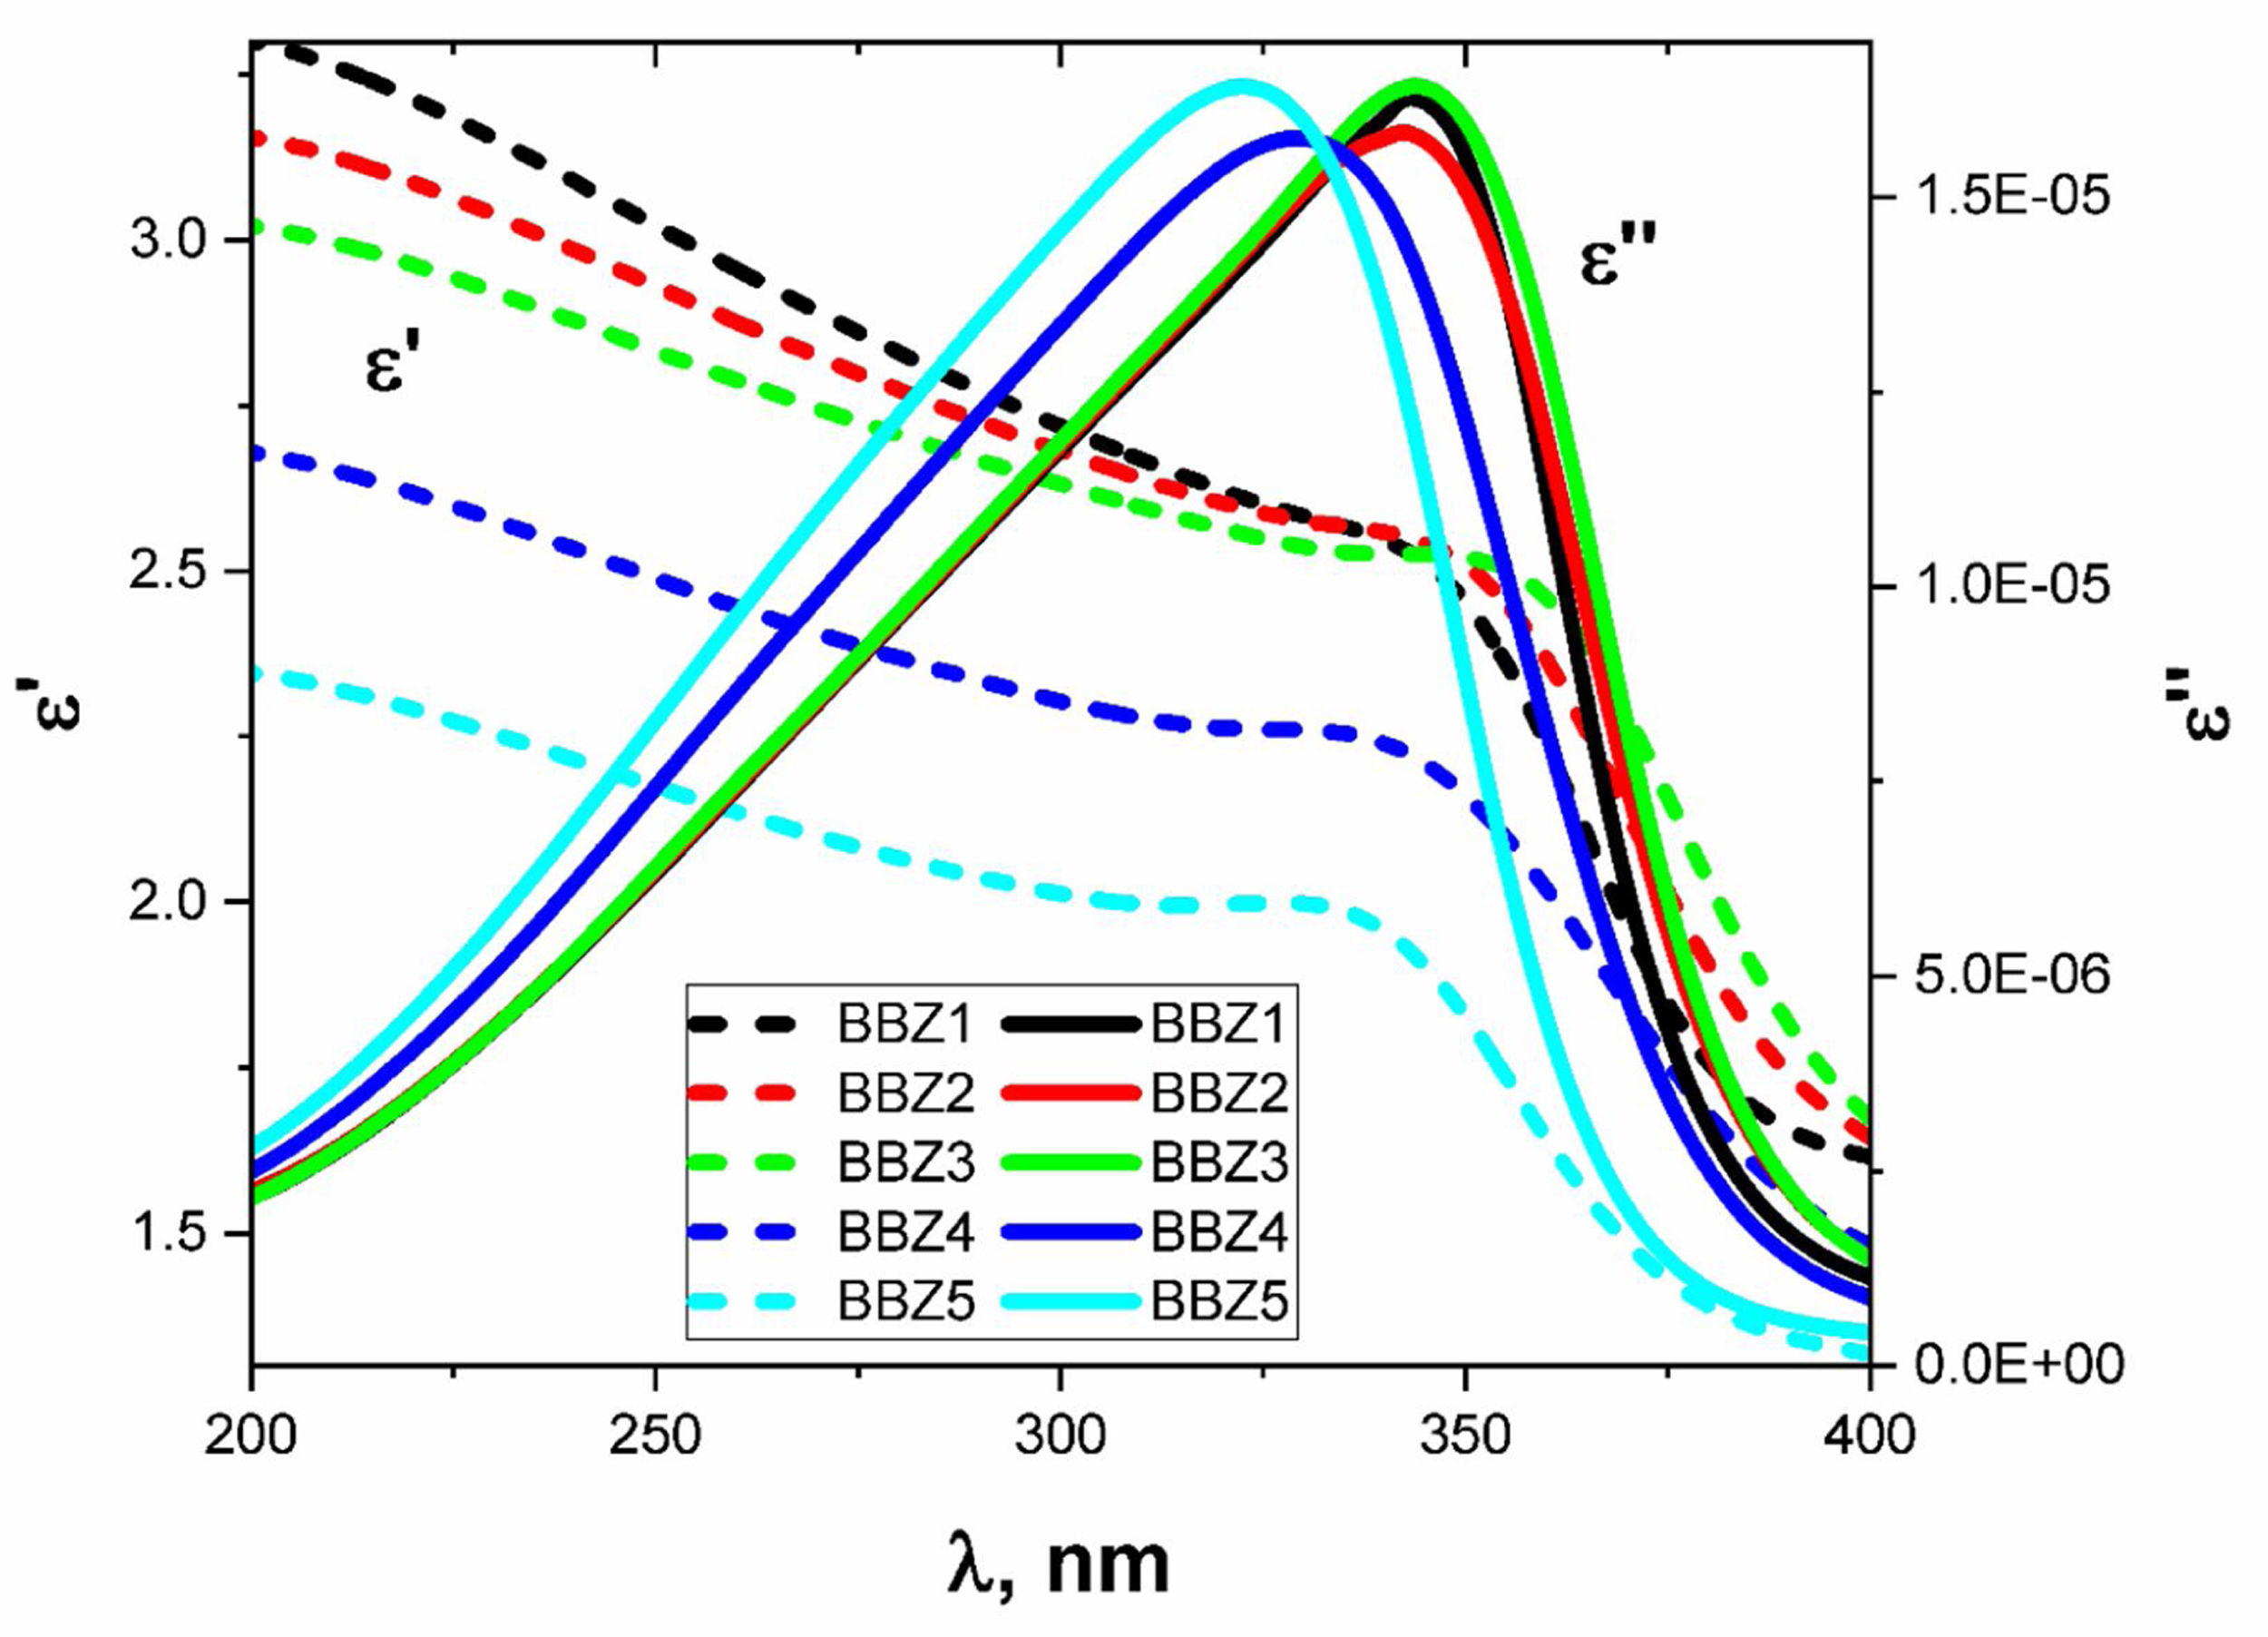
Dielectric parameters such as the dielectric constant ɛ′, the dielectric loss ɛ″, and the loss tangent or dissipation factor (tanδ) are very important to be considered when implementing studied glasses optoelectronic applications. They give information about the amount of energy lost in the system and electromagnetic wave dissipation within the material. These parameters were calculated using the optical parameters α and n, using the following relations [16,29,38].
(10)ε′=n2−αλ4π2


The behaviors of ɛ′ and ɛ″ with the increasing wavelength of the incident light are shown in Fig. 9 for all samples. As shown, there is an observable relaxation process where ɛ″ reached a maximum at which the relaxation time pass between two successive transitions τ=λcritical/2πc sec, where c is the speed of light in vacuum while the critical wavelength λcritical is the value of the wavelength at which ɛ″ reaches its maximum value [39].

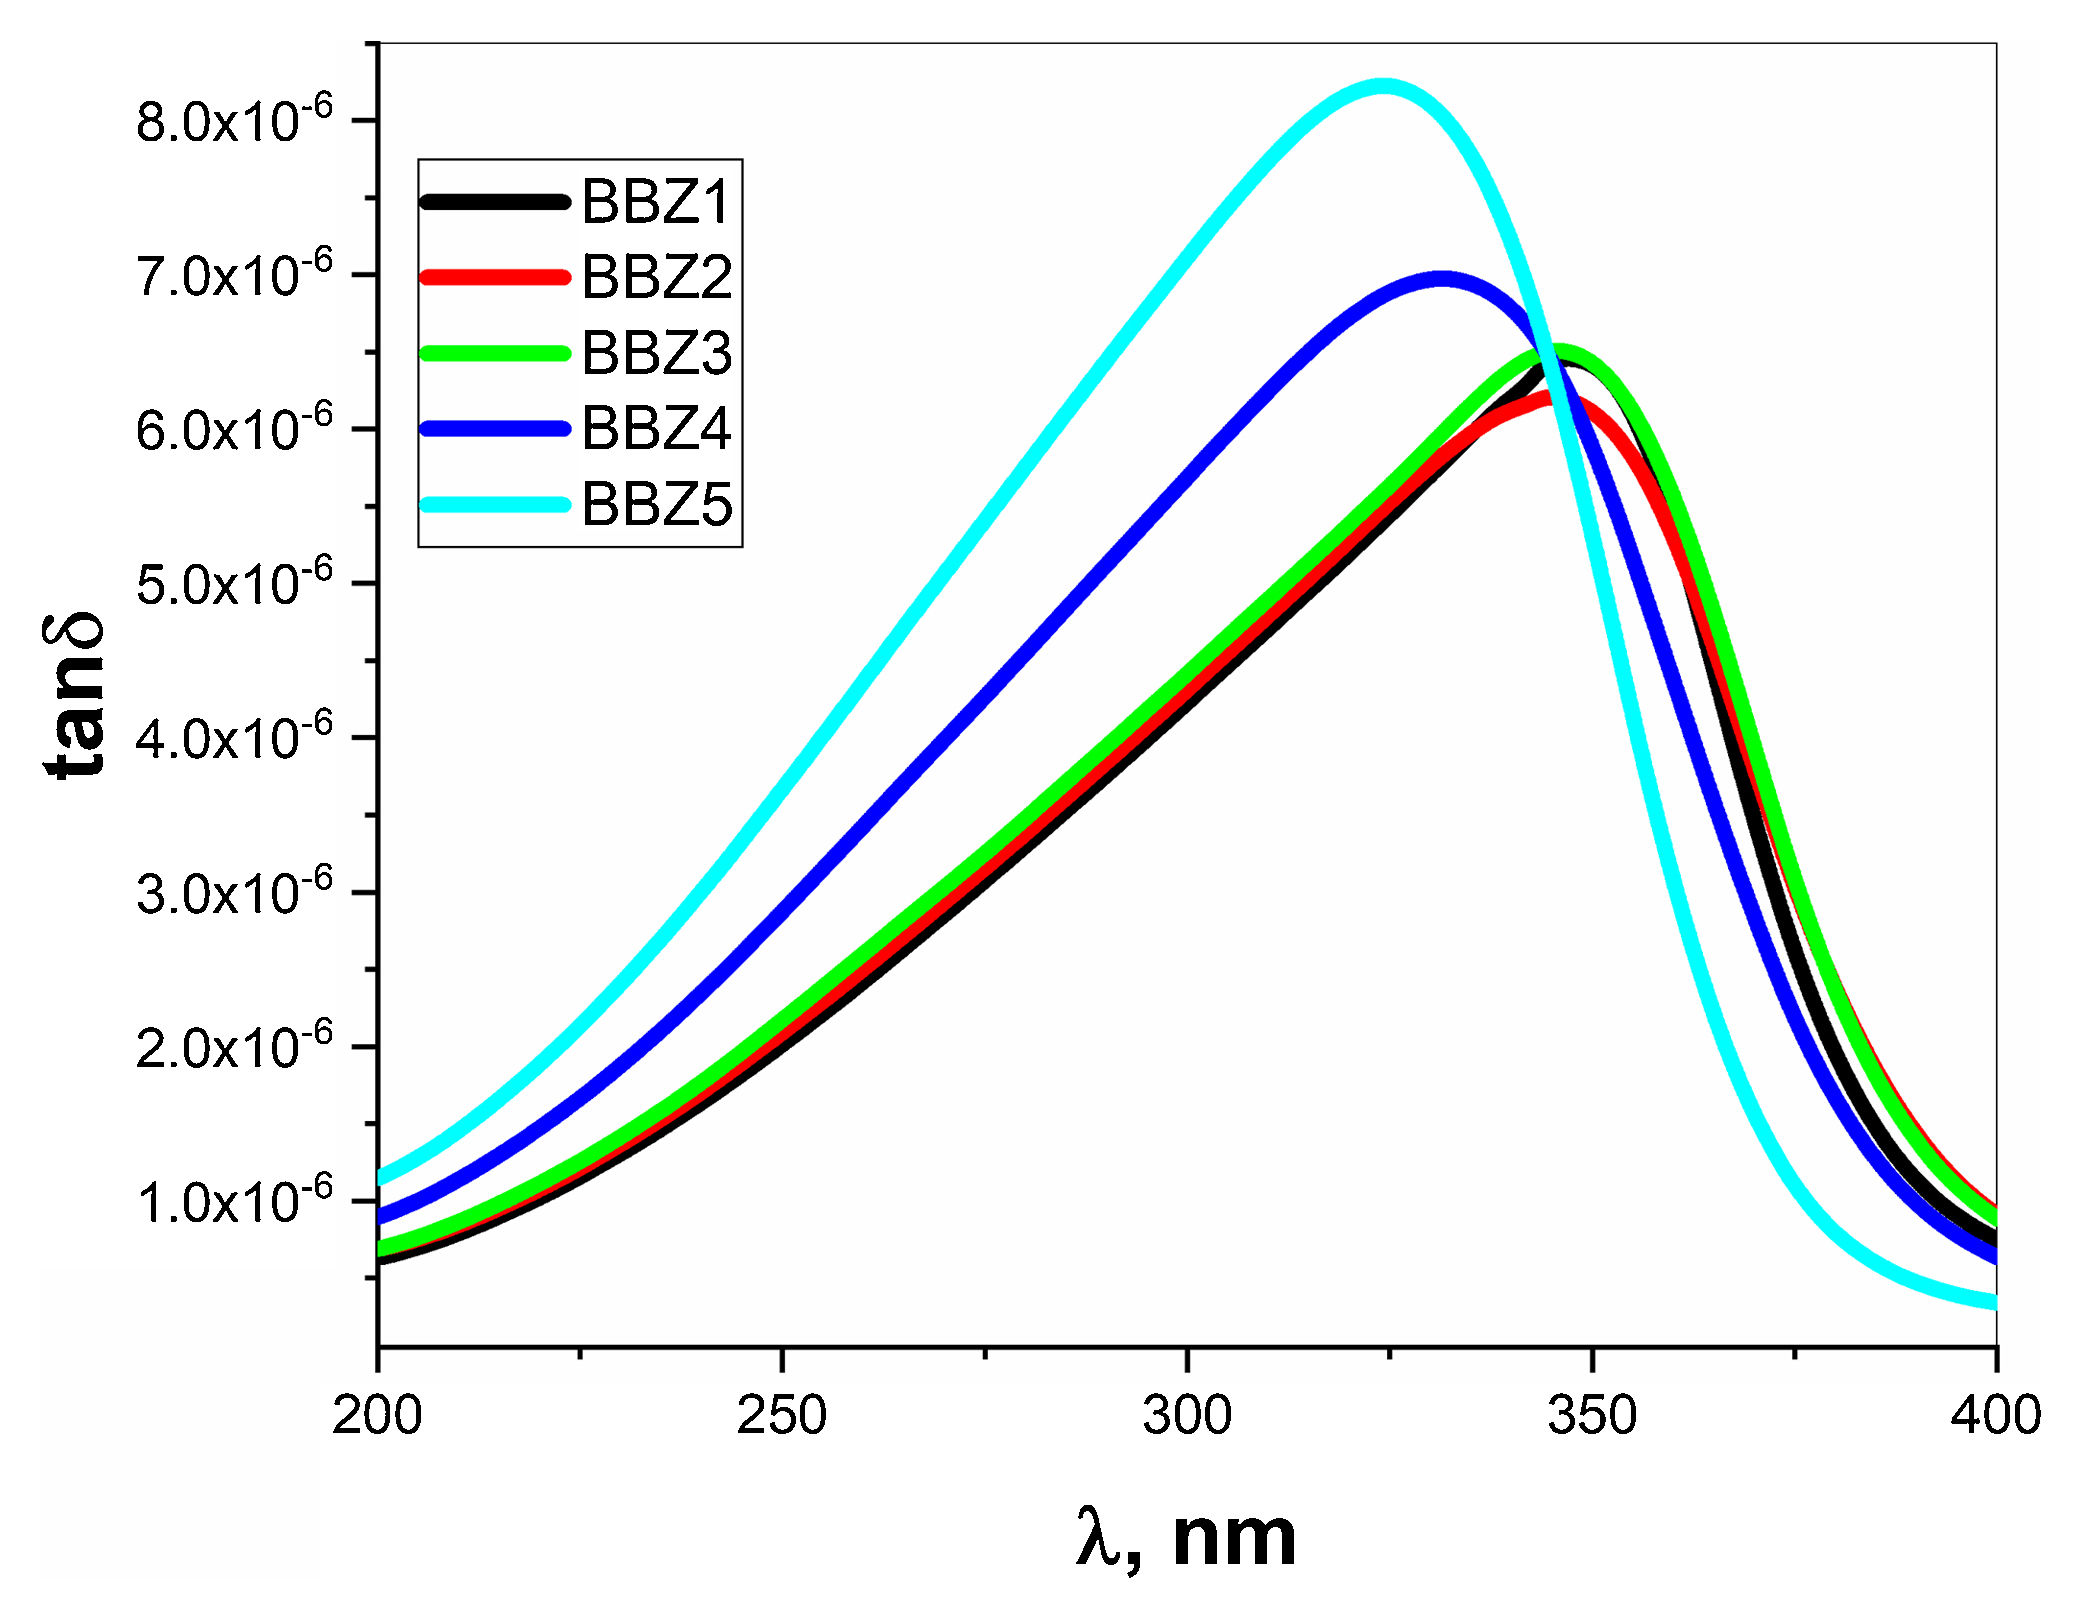
Table 3 shows the λcritical and the corresponding relaxation time τ, for all samples. Notably, the relaxation time value decreases with increasing the amount of ZnO in the glass system. In this regard, as the amount of ZnO increases and as the ZnO resides in the interstitial states of the glass, the system becomes more compact, increasing the overall volume charge density. This leads to a faster charge carrier hopping and subsequent shorter relaxation time. This short relaxation time may indicate that the dominant conduction mechanics is due to electronic hopping. Additionally, the shape of the relaxation peak for the dielectric loss component ɛ″ indicates that this process is a Debye-type relaxation. Electrical dipoles are giving rise to polarization [39,40]. This is also confirmed by the peaks of the loss tangent behavior shown in Fig. 10 and by the shifts in the peak position, generally. These results agree with the Wemple-DiDomenico single oscillator model [41]. Our results, collectively, suggest the studied materials for several optoelectronic device applications such as high-energy optical filters, optical switches, and optical filtering. Additionally, the optical-dielectric behavior and the blue shift in the optical absorbance can suggest the studied materials as dielectric supercapacitors for advanced energy storage applications, but this needs more extensive studies.

In the present work, samples of barium borate glasses containing different molar ratios of ZnO were prepared using a traditional melt-quenching technique. XRD studies confirmed the amorphous nature of the studied glasses. Structural analysis using FTIR confirmed the incorporation of the Zn atom in the glass matrix partially as a ZnO4 building unit and the existence of ZnO in the tetrahedral interstitial sites. TEM images show that the average particle size is about 20nm and the ZnO4 structural units reside in the glass matrix with high homogeneity. Density and molar volume studies manifested an increase in the density as the amount of ZnO increases and the subsequent decrease in the molar volume. This result confirmed the compactness of the glass system rich in ZnO. UV absorption studies showed a blue shift of about 28nm in the absorption peak. Additionally, an observed reversible behavior around 338nm divides the absorption into high energy and low energy regions. In the high energy region, both absorbance, absorption coefficient, and linear refractive increased with ZnO content increment. In the low energy region, this behavior was reversed, and the calculated values of the refractive index agreed with the measured ones in this region. This reverse effect is attributed to ZnO role before and after the resonance frequency, which is close to the value that corresponds to ZnO bandgap in the glass matrix. Studies of dielectric parameters showed a Debye-type relaxation process in agreement with the Wemple-DiDomenico single oscillator model. Our results, collectively, suggest the studied materials for several optoelectronic device applications such as high-energy optical filters, optical switches, and frequency converters.
Conflict of interestAuthors declare that there is no conflict of interest.
I.S. Yahia acknowledges the Deanship of Scientific Research at King Khalid University for funding this work through research groups program under grant number R.G.P. 2/39/40.

