


In this study, the relationship between morphology, porosity, and the photocatalytic activity of the anatase phase of TiO2 was investigated. The synthesis of anatase samples was carried out by a modified sol–gel method, using two ionic surfactants (sodium dodecyl sulfate (SDS) and cetyltrimethylammonium bromide (CTAB)), and polyethylene glycol (PEG) as a nonionic surfactant, or no surfactant (NS). In addition, the photocatalytic activities of the anatase samples were investigated through adsorption experiments and photodegradation using methylene blue. The experimental results showed that the specific surface area of anatase samples increased as the pore size increased, following the order SDS>NS>CTAB>PEG, and the adsorption and photodegradation of methylene blue by the anatase samples increases in the same order. The spherical morphology and porosity of the mesoporous nanoparticles of the SDS sample improved the absorption of light in the visible region. The anatase sample SDS had a low band gap value (2.97eV), the highest specific surface area (138.72m2/g), and showed the highest photocatalytic activity.
En este estudio se investiga sobre la relación entre la morfología, la porosidad y la actividad fotocatalítica de muestras de TiO2 fase anatasa sintetizadas por el método sol-gel modificado, usando dos surfactantes iónicos como el dodecilsulfato sódico (SDS, por sus siglas en inglés) y el bromuro de cetiltrimetilamonio (CTAB, por sus siglas en inglés), y un surfactante no iónico (polietilenglicol [PEG]); con fines de comparación, también se sintetizó una muestra de TiO2 fase anatasa sin utilizar surfactantes (muestra NS). Adicionalmente, las actividades fotocatalíticas de las diferentes muestras de anatasa fueron investigadas a través de experimentos de adsorción y fotodegradación de azul de metileno. Los resultados obtenidos indicaron que el área superficial específica de las diferentes muestras de anatasa incrementó con el tamaño de poro, y el orden fue: SDS>NS>CTAB>PEG. La adsorción y fotodegradación de azul de metileno por las diferentes muestras de anatasa incrementaron en este mismo orden. La morfología esférica y la mesoporosidad de las nanopartículas de la muestra SDS permitieron mejorar la absorción de luz en la región visible. La muestra de anatasa SDS presentó un valor bajo de band gap (2,97eV), el área superficial específica más alta (138,72m2/g), y la mayor actividad fotocatalítica.
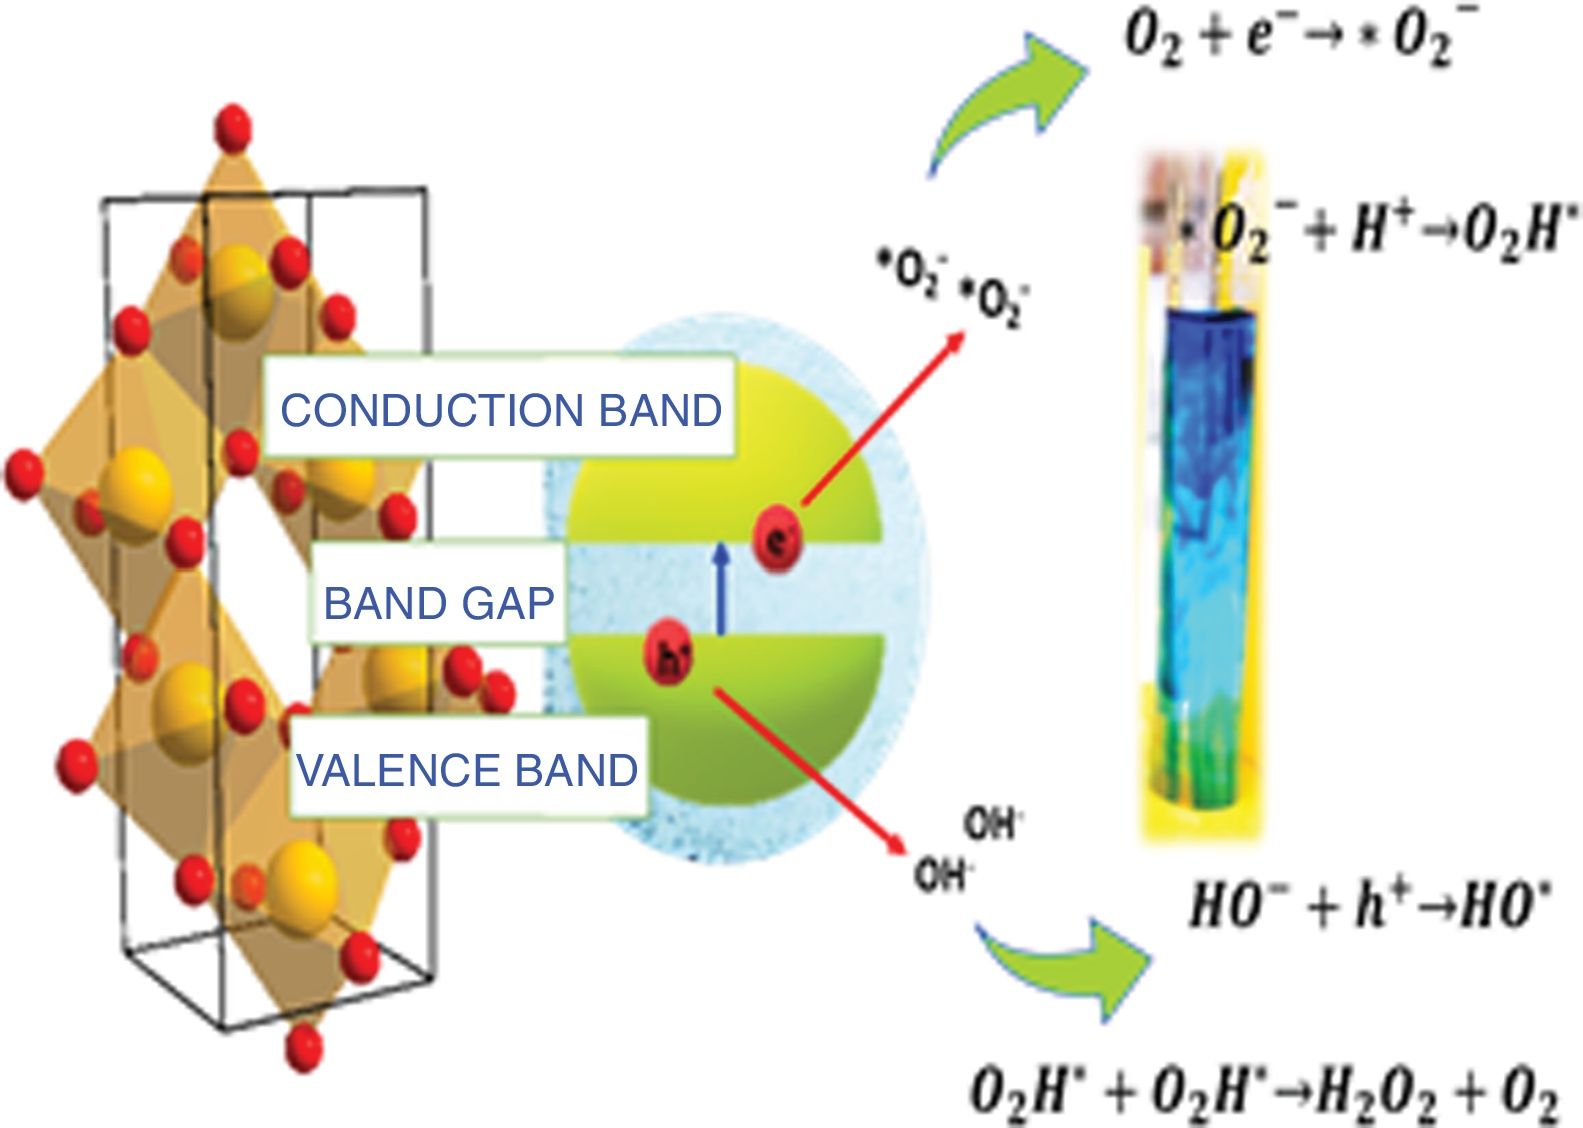
In the last few decades, titanium oxide (TiO2) has received great interest from the scientific community owing to its optical and electrical properties, which make it useful in a high number of applications such as lithium-ion batteries, solar cells and gas biosensors [1–3]. One of the fields in which TiO2 is widely used is photocatalysis. This is a technique used to clean water in a process where a semiconductor material is added to an aqueous medium containing organic pollutants; then, the semiconductor is irradiated with light of a certain wavelength, and if the energy of the light is higher than the band gap (Eg) of the material, then the electrons in the valence band can be excited to the conduction band, leaving behind a hole with a positive charge in the valence band. The electron–hole pairs react with the aqueous medium to form free radicals that can decompose the organic pollutants [4].
As mentioned earlier, photocatalysis is currently applied in wastewater treatment and the most common crystalline phase of TiO2 used in this process is anatase owing to its lower band gap values and higher degree of hydroxylation on the surface compared to those of rutile and brookite [5]. However, anatase can only be activated with ultraviolet (UV) light because of its band gap (3.2eV, approximately). For this reason, many efforts have been made to reduce the band gaps of anatase by synthesizing TiO2 samples with large crystallite sizes and doping them with different cations, or preparing composite materials with other semiconductors [6–8].
It is necessary for a catalyst to have a high specific surface area in order to have a higher number of active sites where pollutants can be adsorbed [9,10]. Investigations on the effects of the pore size distribution, specific surface area and pore structure of mesoporous TiO2 on the photocatalytic activity have been carried out, but the relationships between these characteristics, such as that between the specific surface area and the adsorption of the molecules before the samples are irradiated, and how the profile of the adsorption is related to the photocatalytic activity are not commonly reported.
In addition, it is important to consider that the morphology of a sample affects the optical properties. The importance of morphology control depends not only on modifications of the band gap but also on the efficiency of the photocatalytic process. The crystallinity, porosity, and morphology of a sample are closely related to the synthesis methodology and for this reason, it is necessary to find a method that allows the control of these properties.
The use of surfactants has been reported for the fabrication of porous materials [11–13]; among them, cetyltrimethylammonium bromide (CTAB) has been commonly used in the past to control the sizes of the particles in methods like sol–gel and hydrothermal methods [14–16], and nonionic surfactants like P123 have also been used to obtain nanorod and nanoneedle structures [17]. However, it has to be emphasized that owing to the nature of a surfactant (anionic, cationic or nonionic), its behavior can differ depending on the solvents used for the synthesis and the pH level of the medium, which leads to differences in morphologies and other properties. It has also been reported that the use of ionic and nonionic surfactants can affect whether diverse TiO2 phases are obtained, when the hydrothermal and microemulsion synthesis methods are employed [18,19].
The aim of this work was to investigate the effect of the use of ionic and nonionic surfactants on the morphology, crystallite size and porosity of anatase phase TiO2 synthesized using a sol–gel method, and to study the relationships between these characteristics and the optical properties, adsorption and photocatalytic activity of the anatase samples.
Experimental partMaterialsTitanium isopropoxide (TTIP, 97%), sodium dodecyl sulfate (SDS, 99%), hexadecyltrimethylammonium bromide or cetyltrimethylammonium bromide (CTAB, 99%), glacial acetic acid (CH3COOH), sodium hydroxide (NaOH, 99.99%), potassium bromide (KBr, spectrophotometric grade), anhydrous ethanol (CH3CH2OH), and methylene blue (C16H18ClN3S, 99.99%) were purchased from Sigma-Aldrich; polyethylene glycol (PEG, M.W. 1000g/mol) was obtained from Alfa Aesar.
Synthesis of TiO2 using sol–gel method assisted with ionic and nonionic surfactantsA mixture of 50ml of deionized water and ethanol in a 1:1 volume ratio was prepared, and a concentrated solution of acetic acid was used to adjust the pH to 3. The surfactant (PEG, SDS or CTAB) was added to the mixture in a concentration equal to its critical micelle concentration and the resulting mixture was stirred for 30min. An experiment with no surfactant was also conducted. Afterwards, 3.28mmol of TTIP was slowly dropped into the solution, and the new mixture was stirred for 24h at 25°C. At the end of this time, the temperature was raised to 60°C and the mixture was stirred for another 24h, after which the product was collected through centrifugation and washed three times with a previously prepared mixture of water and ethanol in a 1:1 volume ratio. Finally, it was dried in a vacuum oven for 24h. To obtain the desired crystalline phase (anatase), the white product was calcined at 450°C for 4h with a heating rate of 1°C/min.
Evaluation of photocatalytic activityThe photocatalytic activities of the samples were evaluated using methylene blue as a model molecule. Before the photocatalytic experiments were conducted, adsorption experiments as a function of contact time were performed for 4h in the dark, in order to establish the equilibrium time of methylene blue adsorption on the anatase samples.
Adsorption experimentsThe powders of each anatase sample (2g/L) were mixed with a methylene blue solution with a concentration of 20ppm. pH value of methylene blue solution was previously adjusted at 8 by using a sodium hydroxide solution (10−1M). Adsorption experiments as a function of contact time were performed for 4h in the dark at 25±1°C, and an aliquot of 1mL of the solution was taken to measure the absorbance at a previously established time.
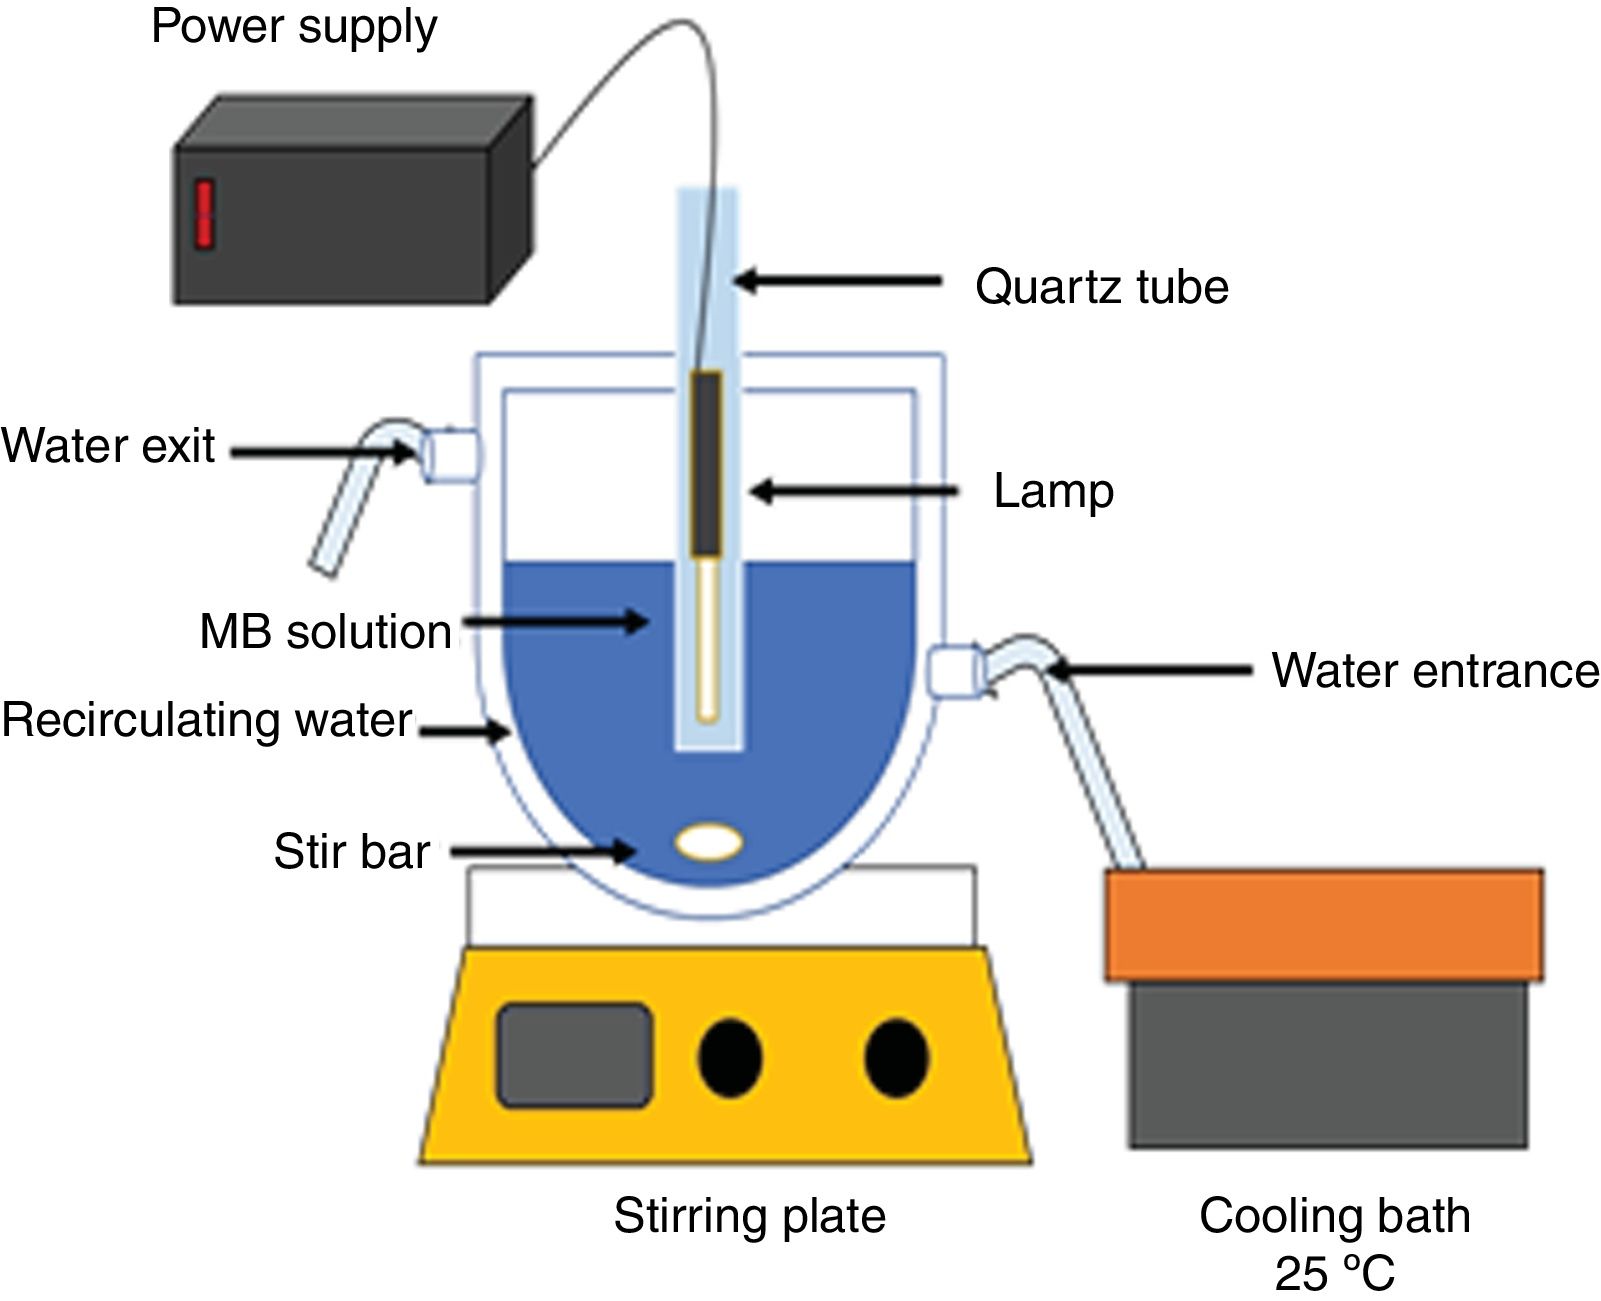
Photocatalysis experimentsAn aqueous solution of methylene blue (100mL, 20ppm, pH of 8) was put in contact with the catalyst powders. The mixture was stirred for 4h in the dark. Next, the solution with the catalyst was irradiated with UV light using a Pen-Ray® Mercury Lamp (λ=254nm, I=4400μW/cm2, 300V), or with visible light using a Pen-Ray® Xenon Lamp (λ=467nm, 300V). The photolysis of the methylene blue solution was performed with UV irradiation for 2h. The amount of adsorbed colorant as a function of the contact time and the methylene blue concentration at different irradiation times were determined by measuring the absorbance with a Jenway UV-Vis spectrometer (λ=664nm) and using a calibration curve that was obtained previously using standard solutions with different concentrations of methylene blue. A double jacketed glass reactor and a water-cooling bath were used to keep the temperature at 25±1°C. All adsorption, photocatalysis and photolysis experiments were performed in triplicate. Fig. 1 shows the experimental scheme used for the photodegradation of methylene blue at pH=8.
Characterization
The infrared spectra of the samples were collected with a Thermo Scientific Nicolet iS10 spectrometer by transmission and by using the attenuated total reflectance accessory (ATR). To acquire the FTIR spectra of the samples by transmission it was necessary to prepare transparent tablets with KBr as follows: each anatase sample was mixed with KBr in a mass ratio of 20:1, the mixture was ground in an agate mortar and a small proportion of the resulting mixture was used to prepare the tablet. To determine the crystal structures of the samples, a Rigaku Ultima IV X-ray diffractometer (Cu Kα, 10°/min, D-Tex, 40kV, 44mA) was used. The specific surface areas were calculated using the Brunauer–Emmett–Teller (BET) theory, and the pore size distributions and pore volumes were calculated with the desorption data from adsorption–desorption isotherms (based on Barrett–Joyner–Halenda (BJH) theory) acquired with a Beckman Coulter SA 3100 apparatus. The morphologies of the samples were investigated with a JEOL JSM-7800F electron microscope. UV–visible (UV–vis) diffuse reflectance spectroscopy (DRS) spectra were obtained with a Perkin-Elmer Lambda 35 spectrometer, equipped with an integrated sphere attachment. Zeta potential (ζ) measurements were made with an Anton Paar Litesizer 500 for point of zero charge (pHPZC) determination.
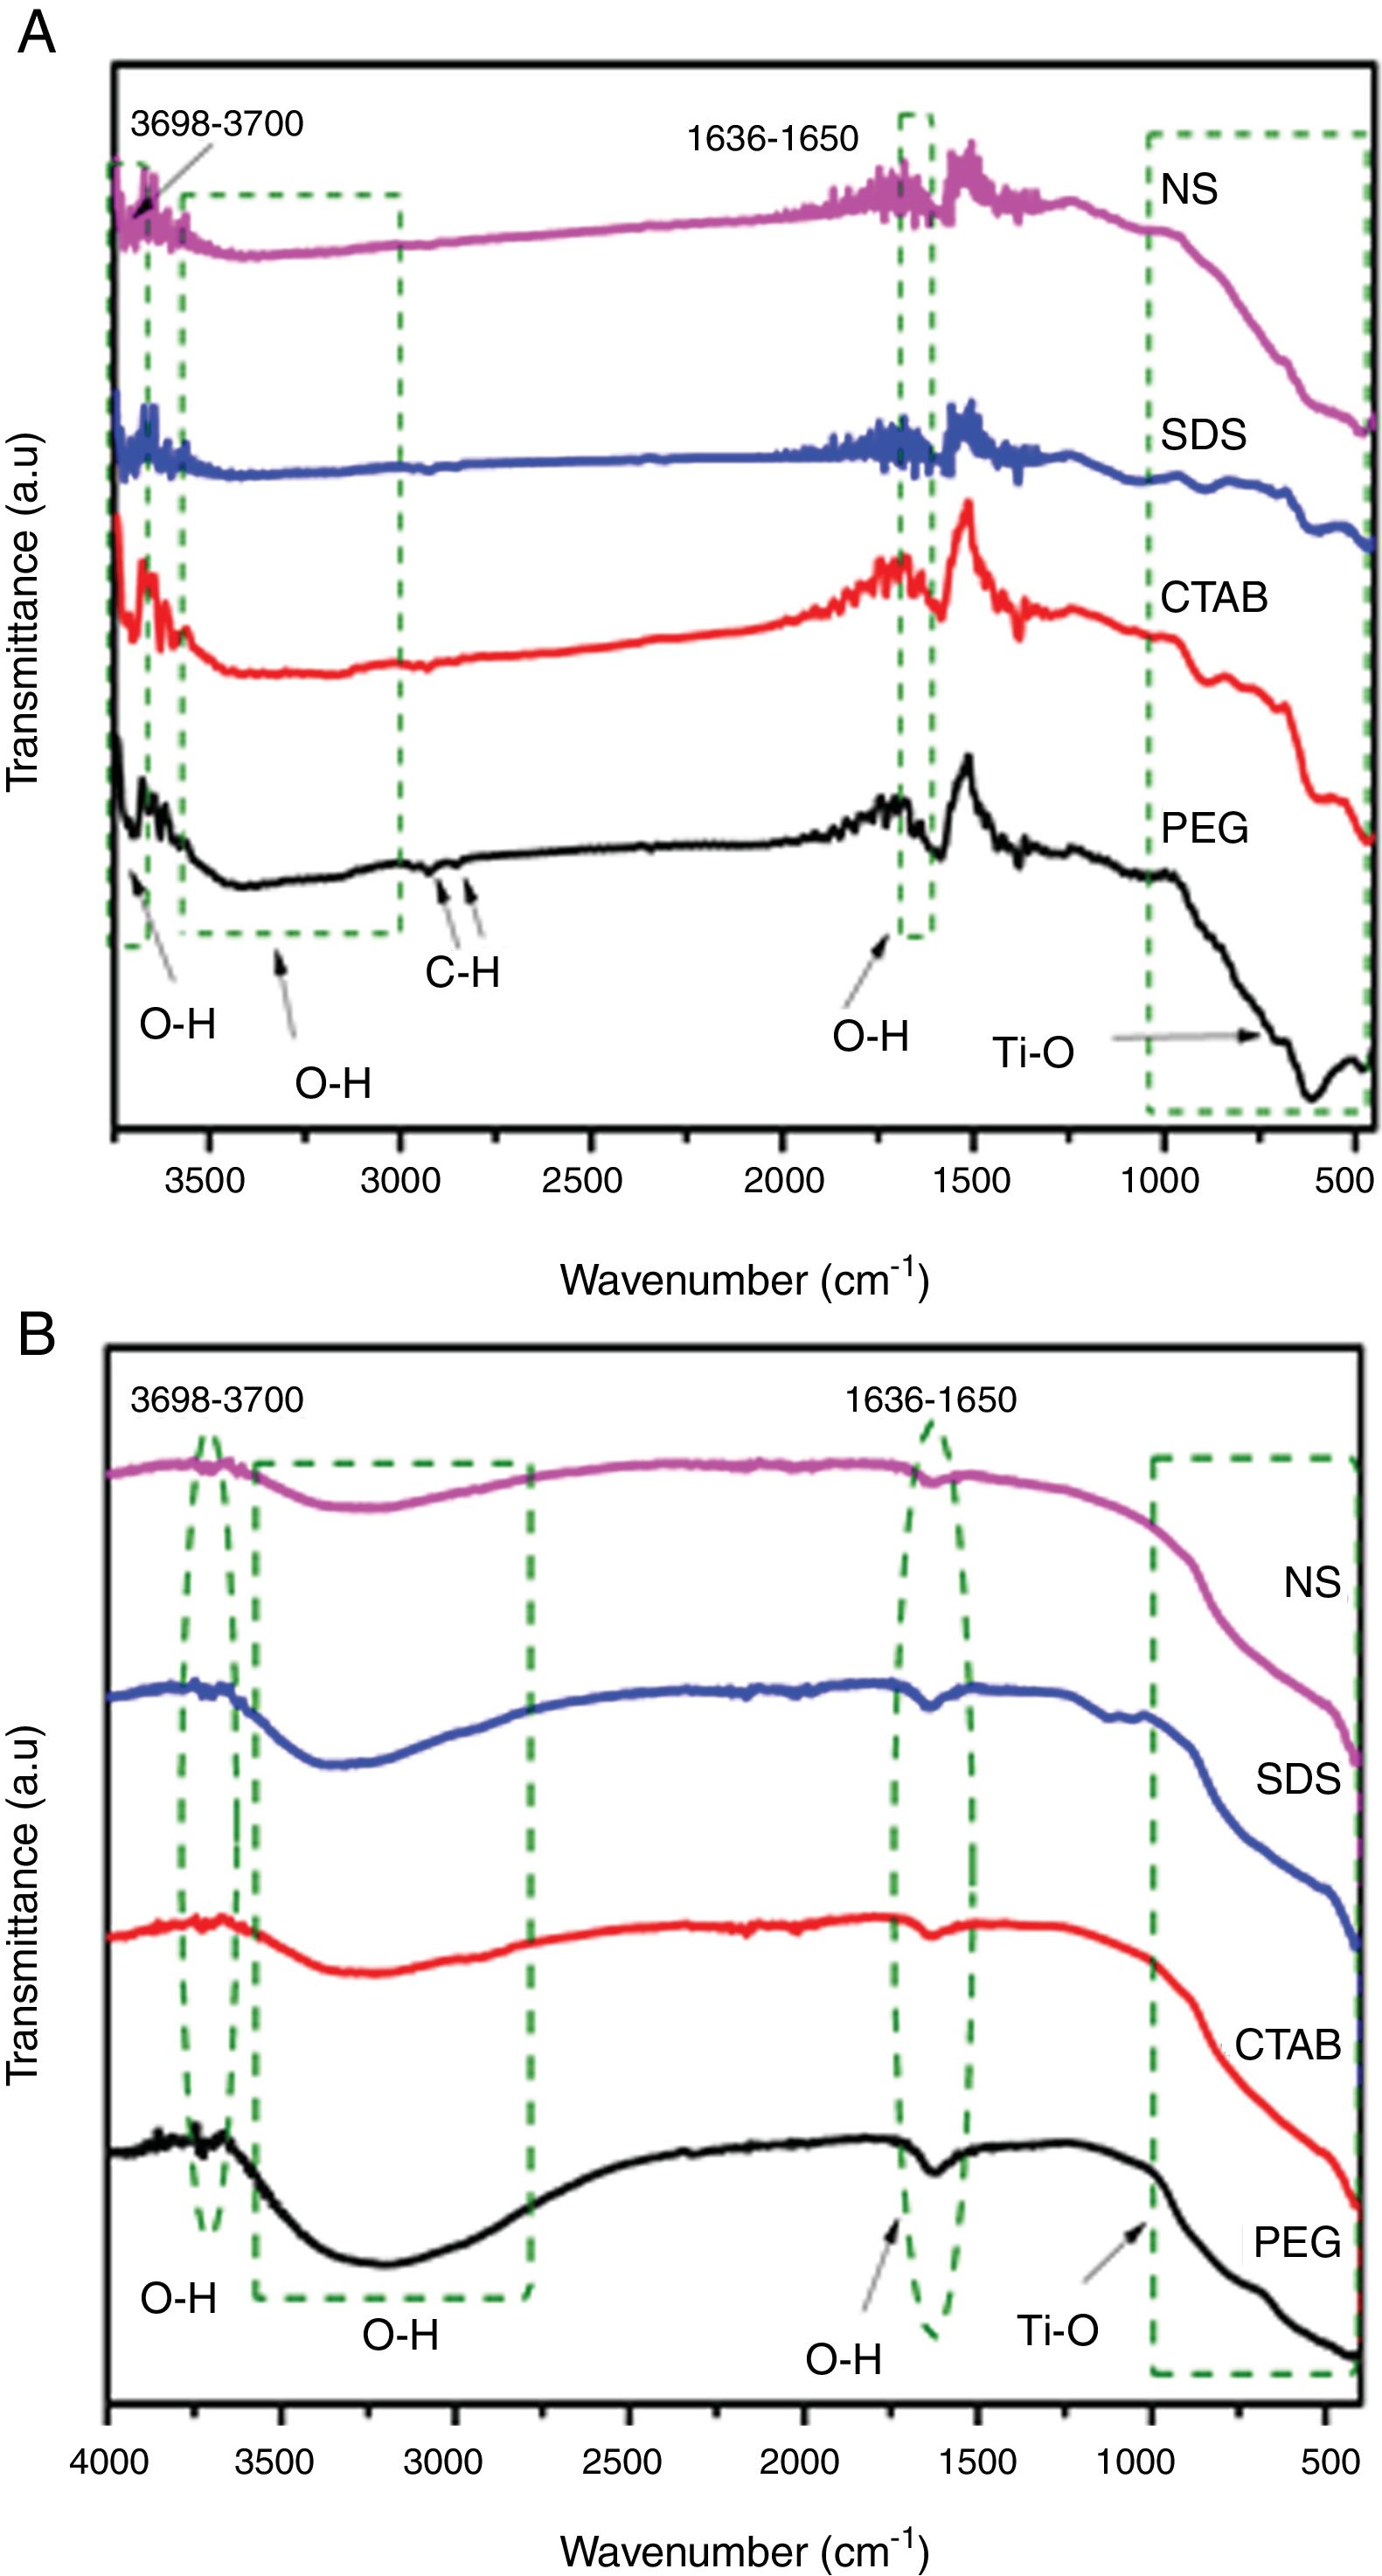
Results and discussionSynthesis of TiO2 using sol–gel method assisted with ionic and nonionic surfactantsFig. 2A and B displays the Fourier transform infrared spectra of the TiO2 samples (transmission and reflectance, respectively). It was observed that the TiO2 samples showed similar spectra. A wide absorption band between 800 and 400cm−1 was observed and it corresponds to Ti–O vibration in the crystal lattice. The broad absorption band between 3600 and 3000cm−1 and the band at 1640cm−1 are due to the deformation and stretching vibration of OH groups, respectively, and these bands indicate the presence of water molecules weakly bonded to TiO2[20–22]. These bands associated with O–H deformation and stretching are more intense in the spectra of the TiO2 samples synthesized with the PEG and SDS surfactants (Fig. 2B), suggesting that they can have higher degrees of hydroxylation. This is a desired characteristic in photocatalysis because the OH groups can react with the holes generated during the process, preventing the recombination of electron–hole pairs [23]. Two very small absorption bands are observed around 2870 and 2950cm−1 in FTIR spectrum of the sample PEG, they can be associated with the bond vibration of C-H of methyl and methylene groups, respectively, from residual surfactant. FTIR spectra of anatase samples shown a small absorption band at 3700cm−1, this band is associated with OH group. The OH groups responsible for the bands at 3715cm−1 are presumed to be isolated (Ti–OH), they are present on surface faces (101) and (001) of anatase and are characteristic of defects or oxygen vacancies on the catalyst surface [24–26].
 and without a surfactant (NS). FTIR spectra acquired by (A) Transmission and (B) ATR modes.")
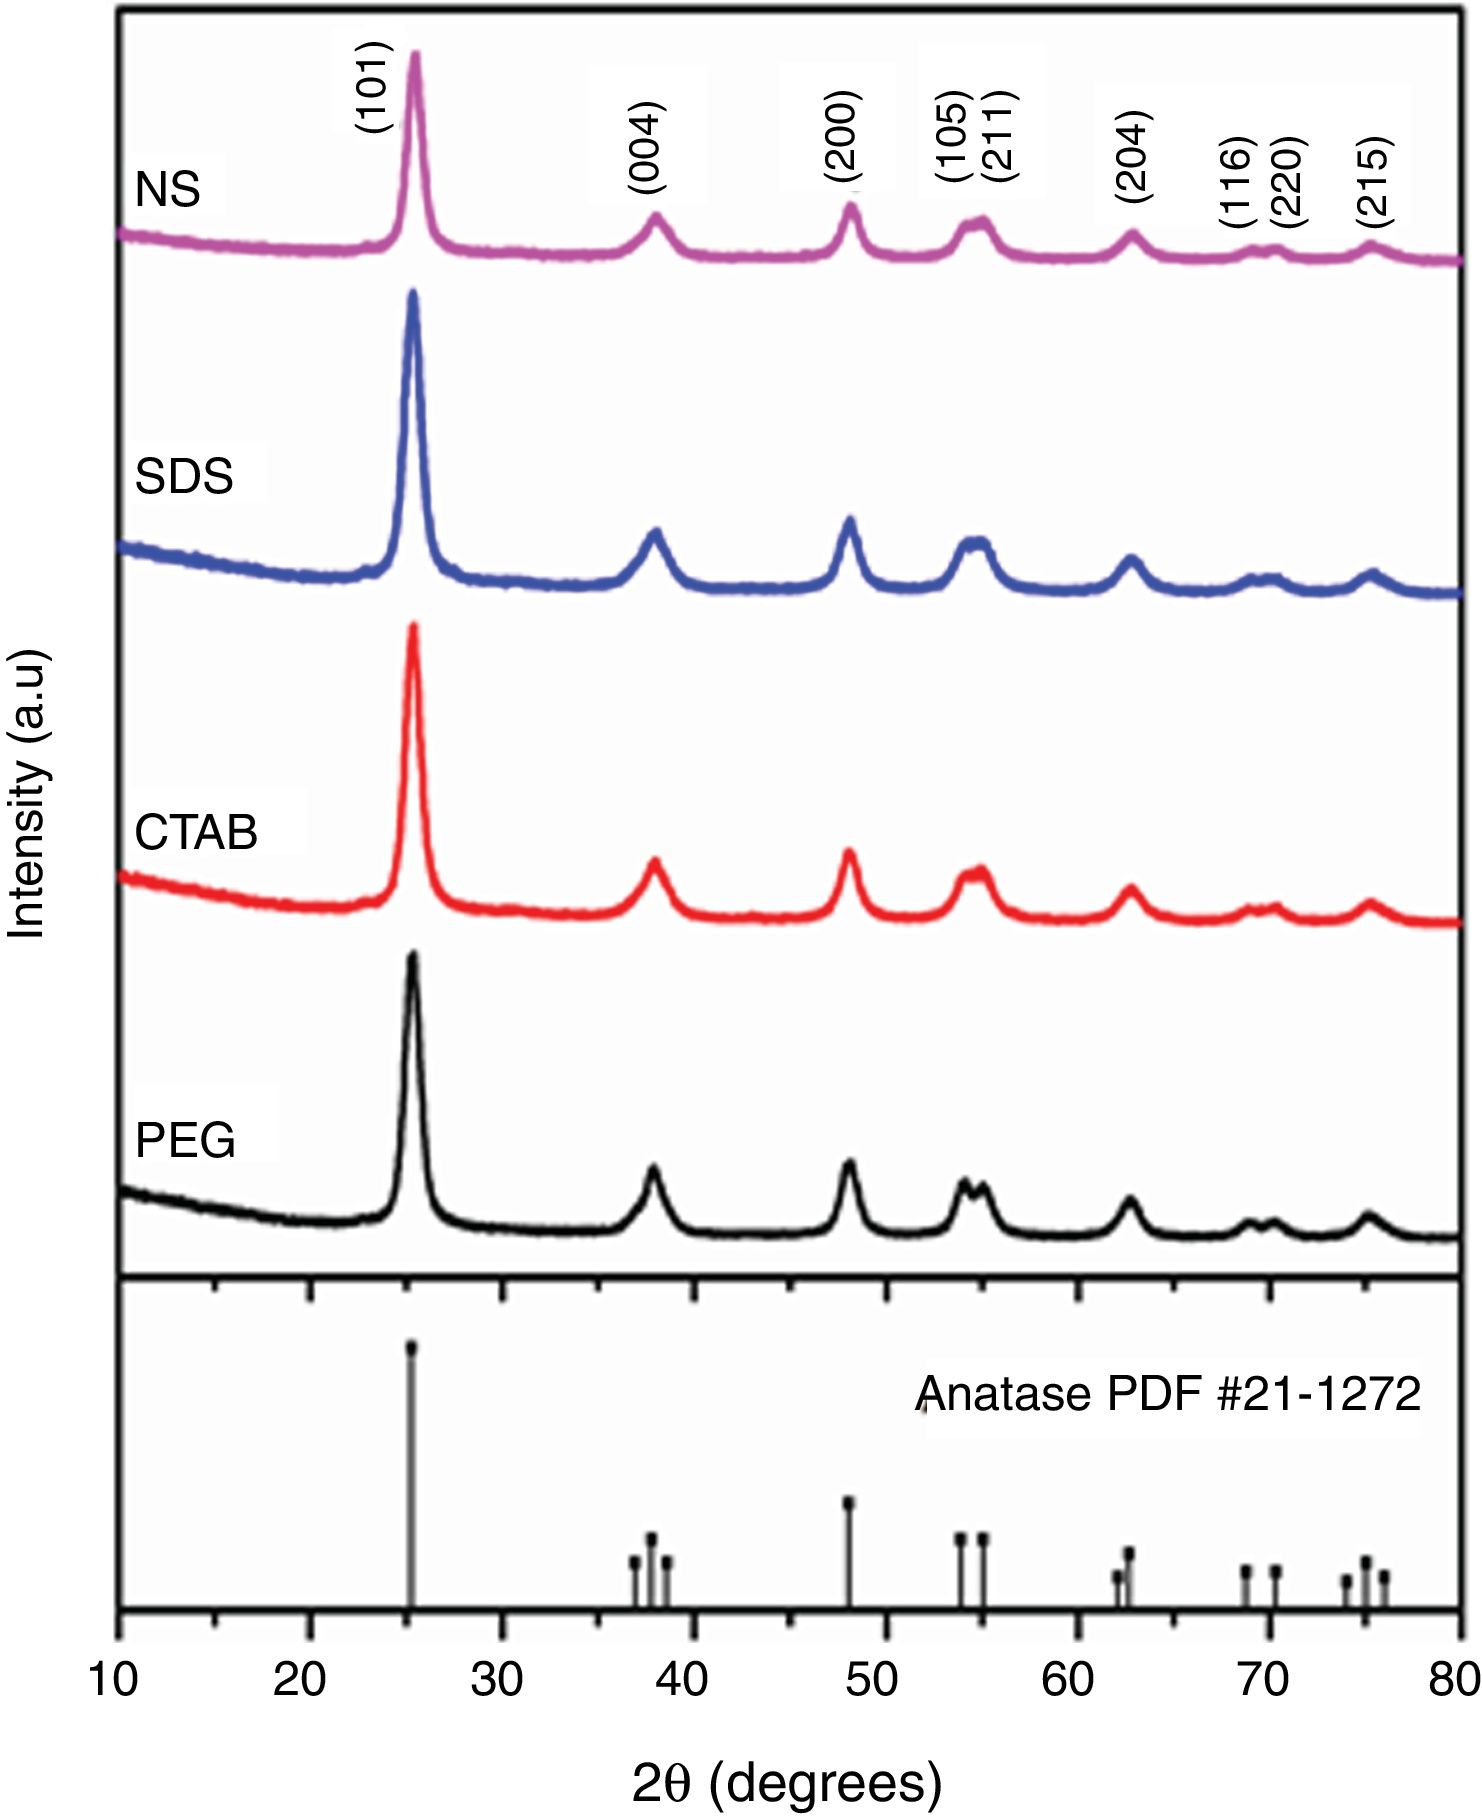
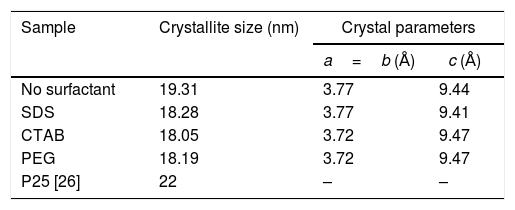
The X-ray diffraction (XRD) patterns of the TiO2 samples are shown in Fig. 3. The patterns of each sample were similar to the standard diffraction pattern of the anatase phase (PDF #21-1271). Table 1 presents the crystallite sizes and the lattice parameters of the anatase tetragonal cells of the anatase samples; crystallite size was calculated with the Scherrer equation (k=0.89, λ=0.154nm) using the peak corresponding to the (101) plane of each anatase sample. It can be observed that the intensities of the peaks in the diffraction patterns change for each sample; however, the crystallite sizes are similar, except for that of the sample synthesized with no surfactant (NS). In general, the use of a surfactant decreased the crystallite size of anatase from 19.31nm for the NS sample to 18.28, 18.19 and 18.05nm for the samples synthesized with SDS, PEG and CTAB, respectively, as can be observed in Table 1. In 2018, Yuenyongsuwan et al. synthesized TiO2 by two different methods, microemulsion and hydrothermal, using SDS and CTAB as surfactants, and they obtained two different phases, anatase and rutile, but the crystallite size was not reported [19]. Payormhorm et al. synthesized TiO2 with CTAB using a sol–gel method, and they obtained anatase with a crystallite size of 26.5nm and rutile with a crystallite size of 81.4nm [14], while only anatase phase was obtained in this work with a crystallite size of 18.05nm. Chen et al. used PEG as the surfactant in a hydrothermal method, and they obtained crystallite sizes between 14.8 and 17.4nm [18]; the crystallite size of the sample synthesized with PEG in this work is larger (18.19nm). A large crystallite size is a desired characteristic in photocatalysts because the band gap can decrease through the size quantization effect as the crystallite size increases [11,27].
 and without a surfactant (NS).")
Crystallite sizes and crystal parameters of the synthesized TiO2 samples.
| Sample | Crystallite size (nm) | Crystal parameters | |
|---|---|---|---|
| a=b (Å) | c (Å) | ||
| No surfactant | 19.31 | 3.77 | 9.44 |
| SDS | 18.28 | 3.77 | 9.41 |
| CTAB | 18.05 | 3.72 | 9.47 |
| PEG | 18.19 | 3.72 | 9.47 |
| P25 [26] | 22 | – | – |
Regarding the tetragonal cell parameters, it was observed that they were equal for the samples of anatase synthesized with nonionic and cationic surfactants (PEG and CTAB, respectively), but parameters a and b (3.72Å) decreased and parameter c increased (9.47Å) with respect to those of the NS sample. Meanwhile, for the sample synthesized with the anionic surfactant (SDS), parameter c (9.41Å) decreased with respect to that of the NS sample and parameters a and b were equal (3.77Å). The NS anatase sample had the largest crystallite size. In general, all anatase samples had crystallite sizes smaller than that of Degussa P25 TiO2 (25nm) [26].
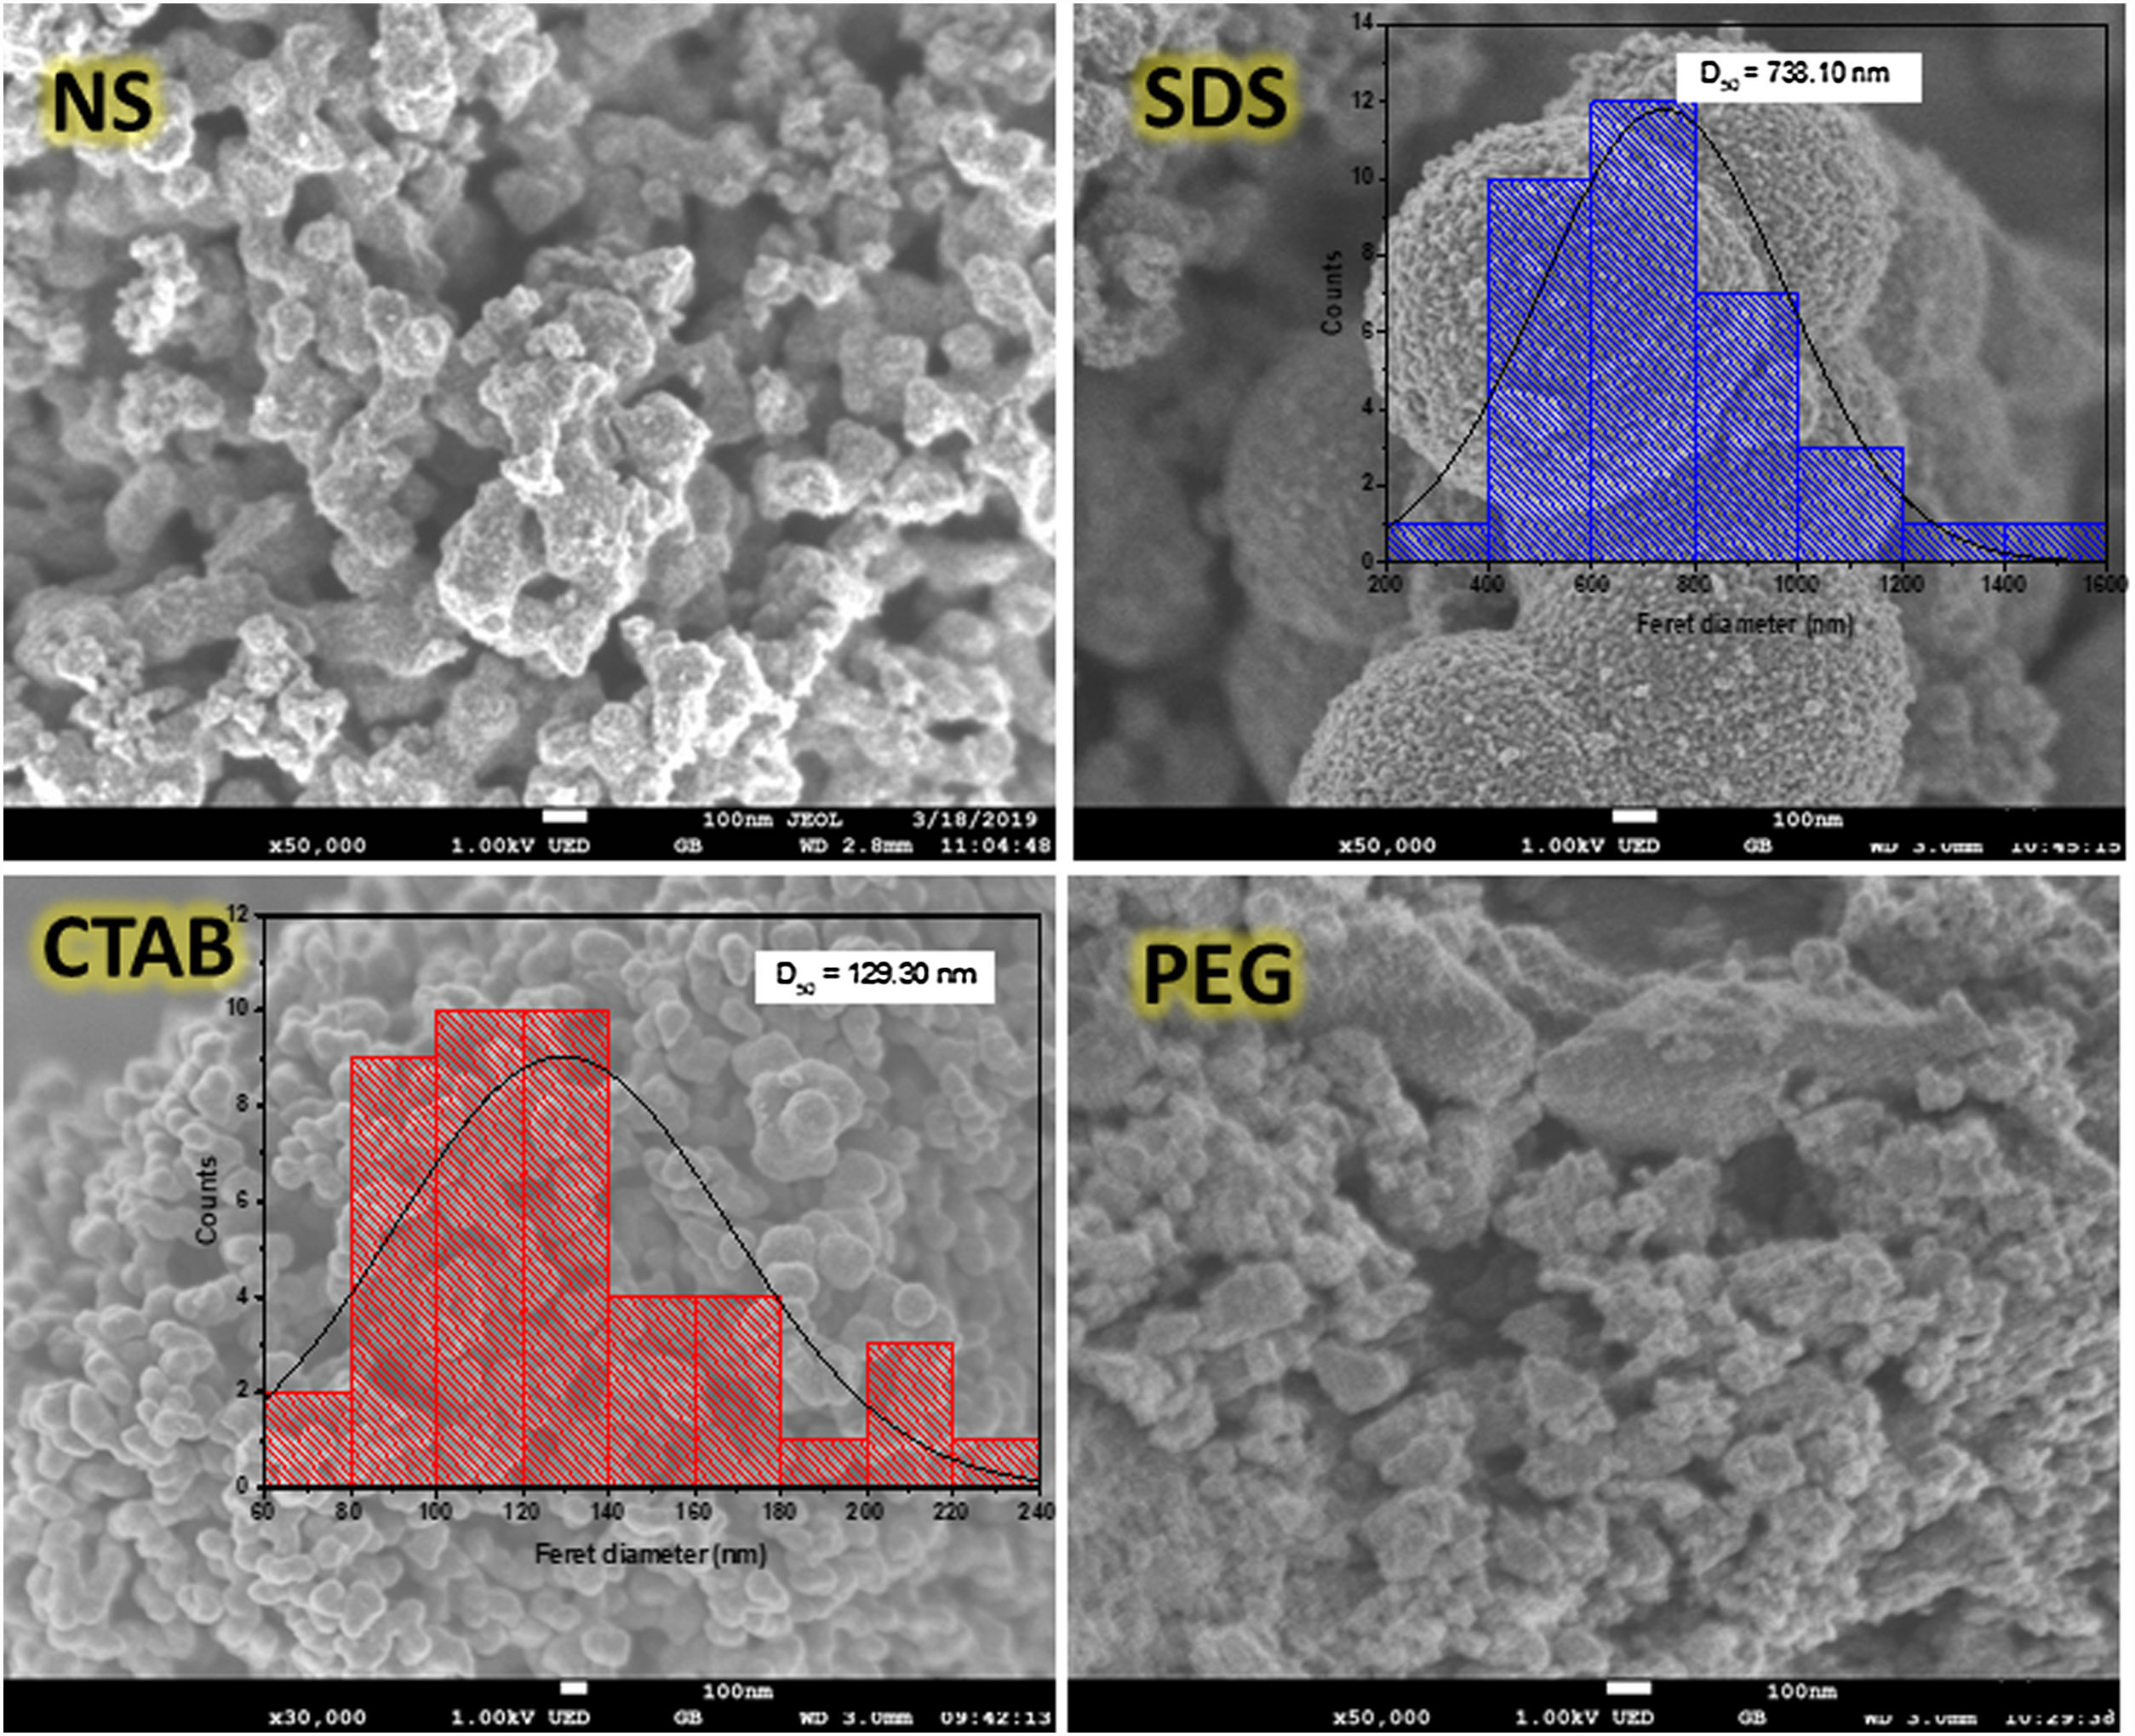
The scanning electron microscopy (SEM) images (Fig. 4) show the morphologies of the anatase samples. It can be seen that the anatase samples have different morphologies, suggesting that using or not using a surfactant as well as the type of surfactant used in the sol–gel process affect the morphology of anatase. For the sample synthesized with no surfactant (NS), the morphology consisted of agglomerates of semi-spherical particles, and the same morphology was found in the sample synthesized with nonionic surfactant PEG. For the sample synthesized with CTAB, the particles displayed a “worm-like” shape with a Feret diameter of 129.30nm. The “worm-like” morphology was the result of the coalescence of two or more spherical particles, and this phenomenon can negatively affect the formation of pores in the sample. With the anionic surfactant SDS, it was possible to obtain spherical particles with an average diameter of 738.10nm, and these particles were formed from smaller particles with an average diameter of 15.65nm. It is important to note that the presence of pores in the particles helps to increase the dispersion of light and enhance the photocatalytic activity, improving pollutant degradation [28].
.")
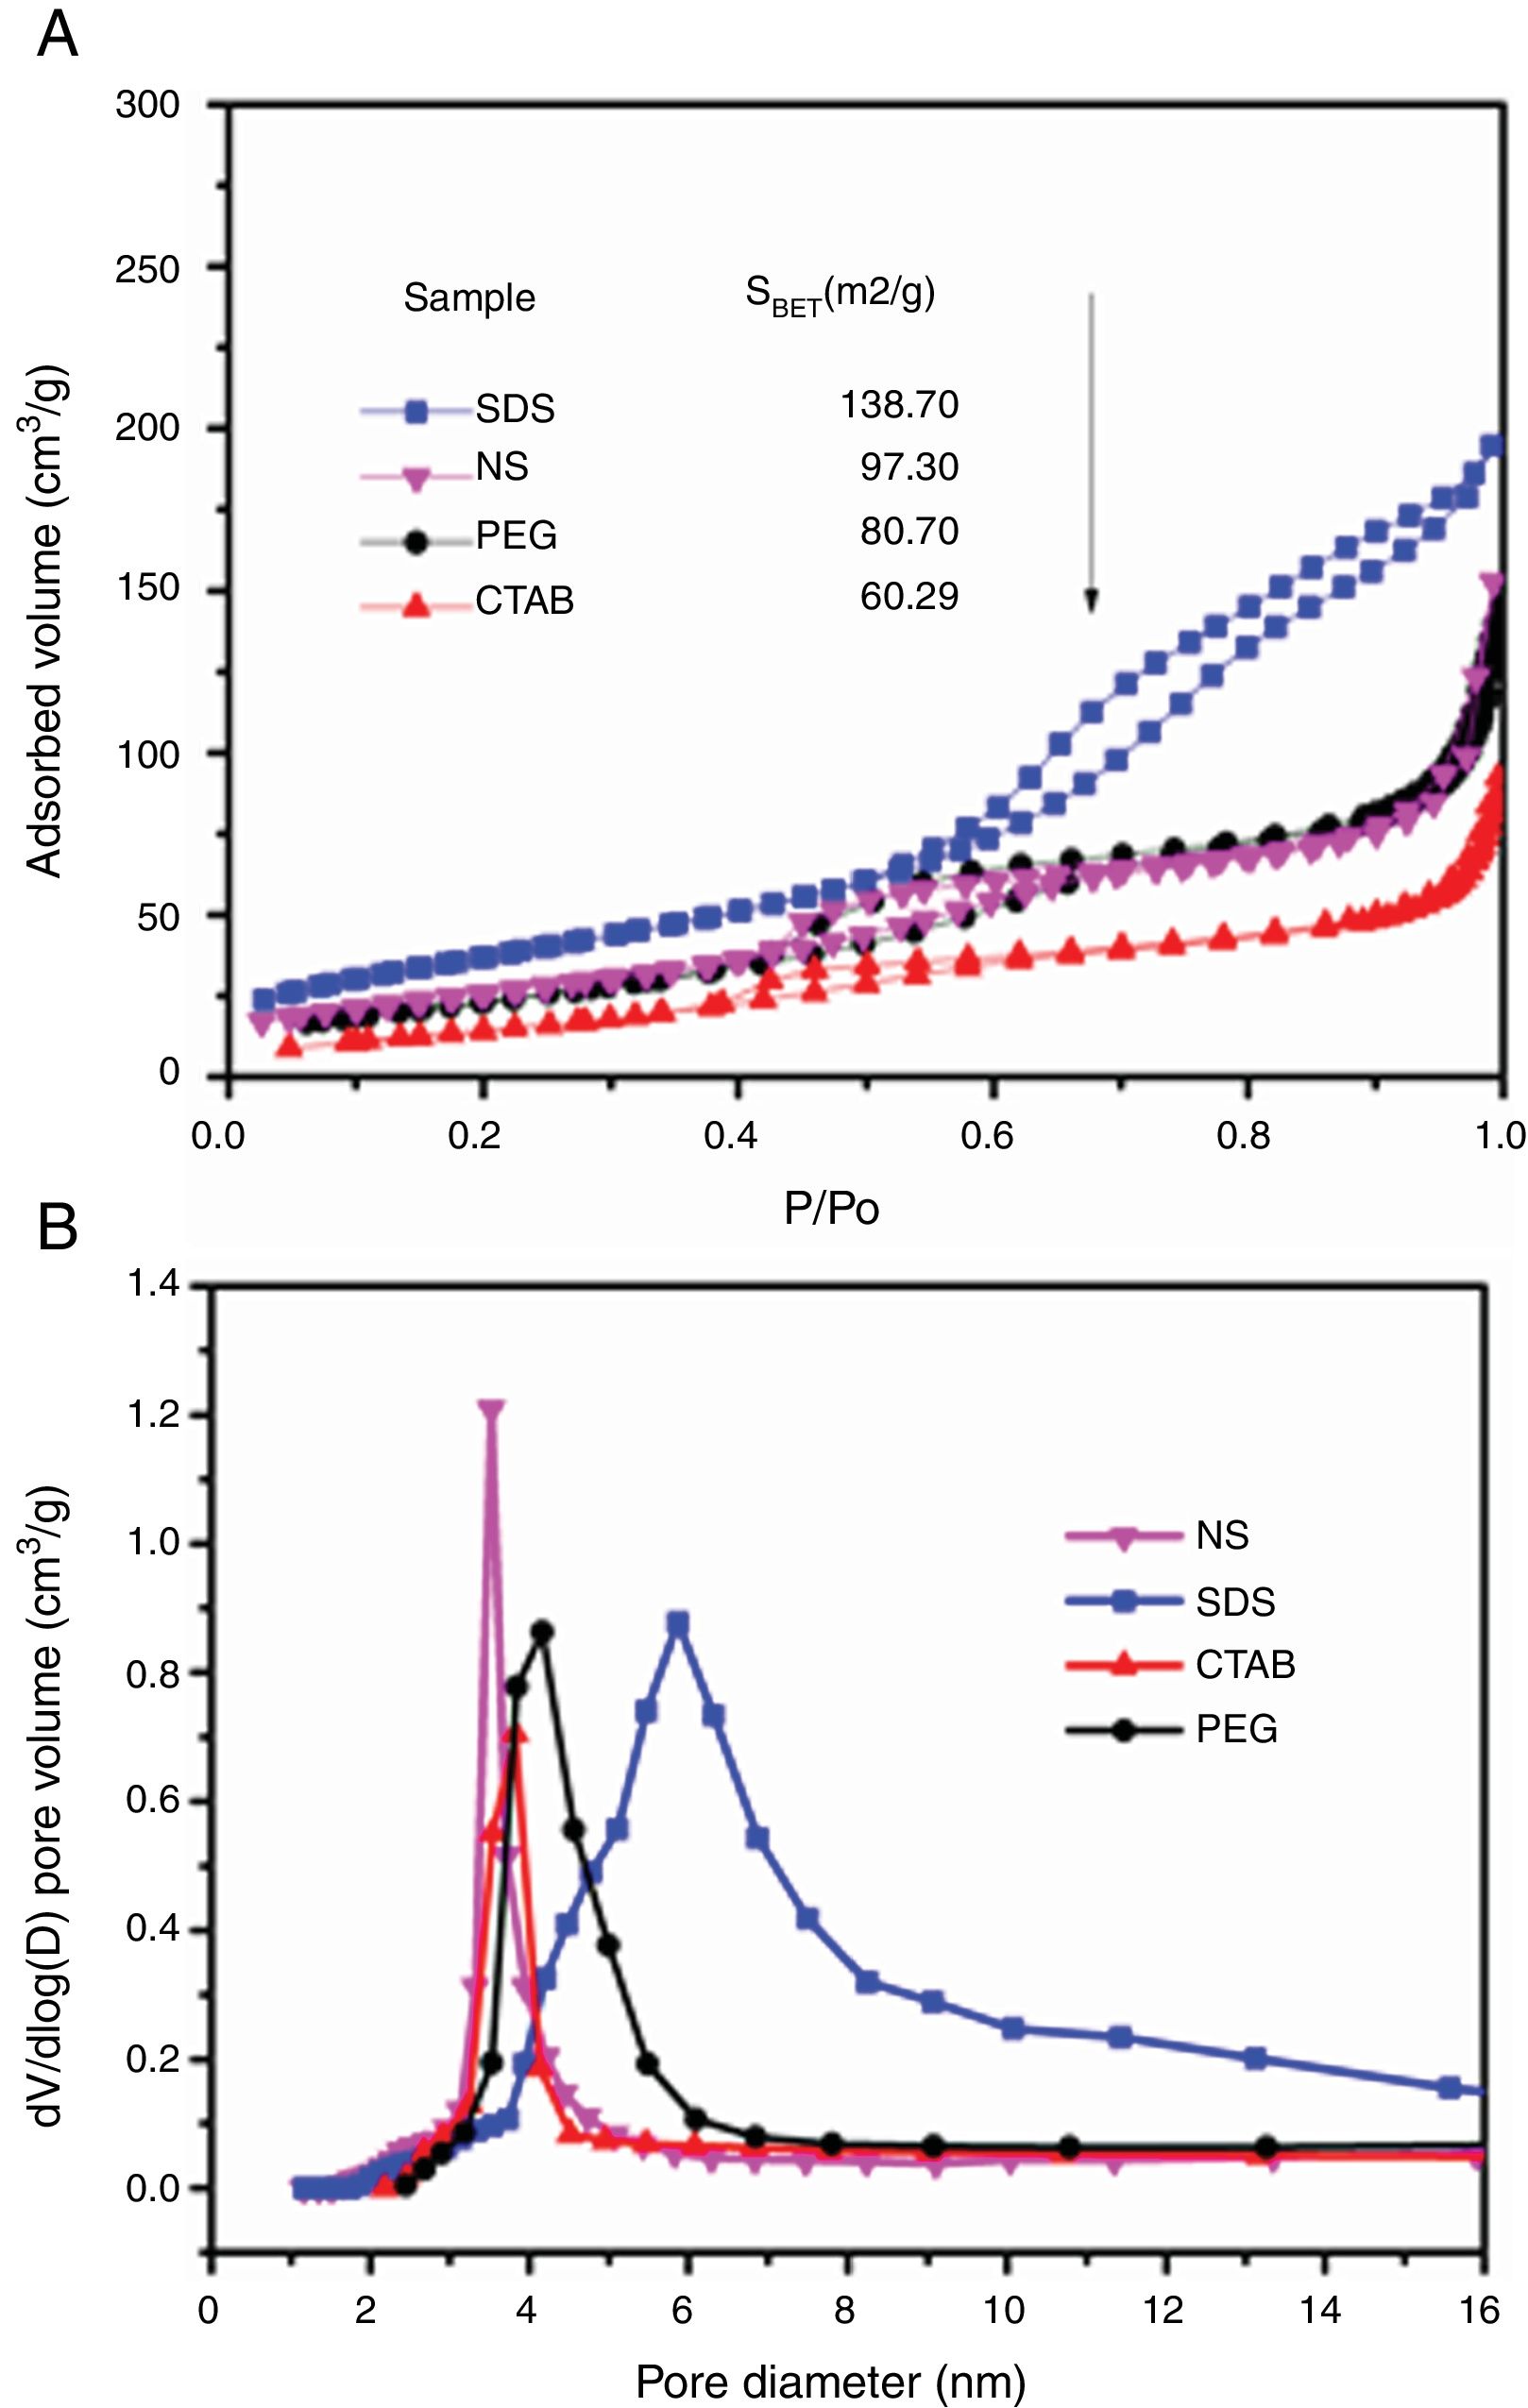
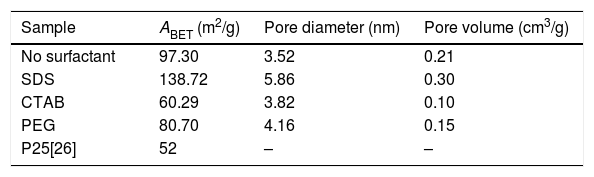
The adsorption–desorption isotherms of the SDS, CTAB, PEG and NS anatase samples are presented in Fig. 5A. The CTAB, PEG and NS samples gave type IV isotherms combined with type II isotherms, indicating the presence of mesopores and macropores, whereas the SDS sample gave a type IV isotherm, indicating the presence of only mesopores. This observation can be corroborated by pore size distribution analysis on the desorption isotherm using the BJH theory; these results are shown in Fig. 5B and Table 2. The isotherms of the samples synthesized with PEG and without any surfactant have similar shapes and gave similar specific surface areas (ABET), and, as can be seen in the SEM images, the morphologies of these samples are also similar. The CTAB sample had the lowest specific surface area and pore volume (60.29m2/g and 0.1cm3/g, respectively) and the SDS sample had the highest specific surface area and pore volume (138.70m2/g and 0.3cm3/g, respectively). Fig. 5B shows that the pore size distribution and pore volume of the SDS sample are greater than those of the other samples; the obtained pore sizes were 3.52, 3.82, 4.16 and 5.86nm for the NP, CTAB, PEG and SDS anatase samples, respectively, as shown in Table 2.
 and pore size distributions (B) of the anatase samples.")
BET and BJH analysis results of the anatase samples.
| Sample | ABET (m2/g) | Pore diameter (nm) | Pore volume (cm3/g) |
|---|---|---|---|
| No surfactant | 97.30 | 3.52 | 0.21 |
| SDS | 138.72 | 5.86 | 0.30 |
| CTAB | 60.29 | 3.82 | 0.10 |
| PEG | 80.70 | 4.16 | 0.15 |
| P25[26] | 52 | – | – |
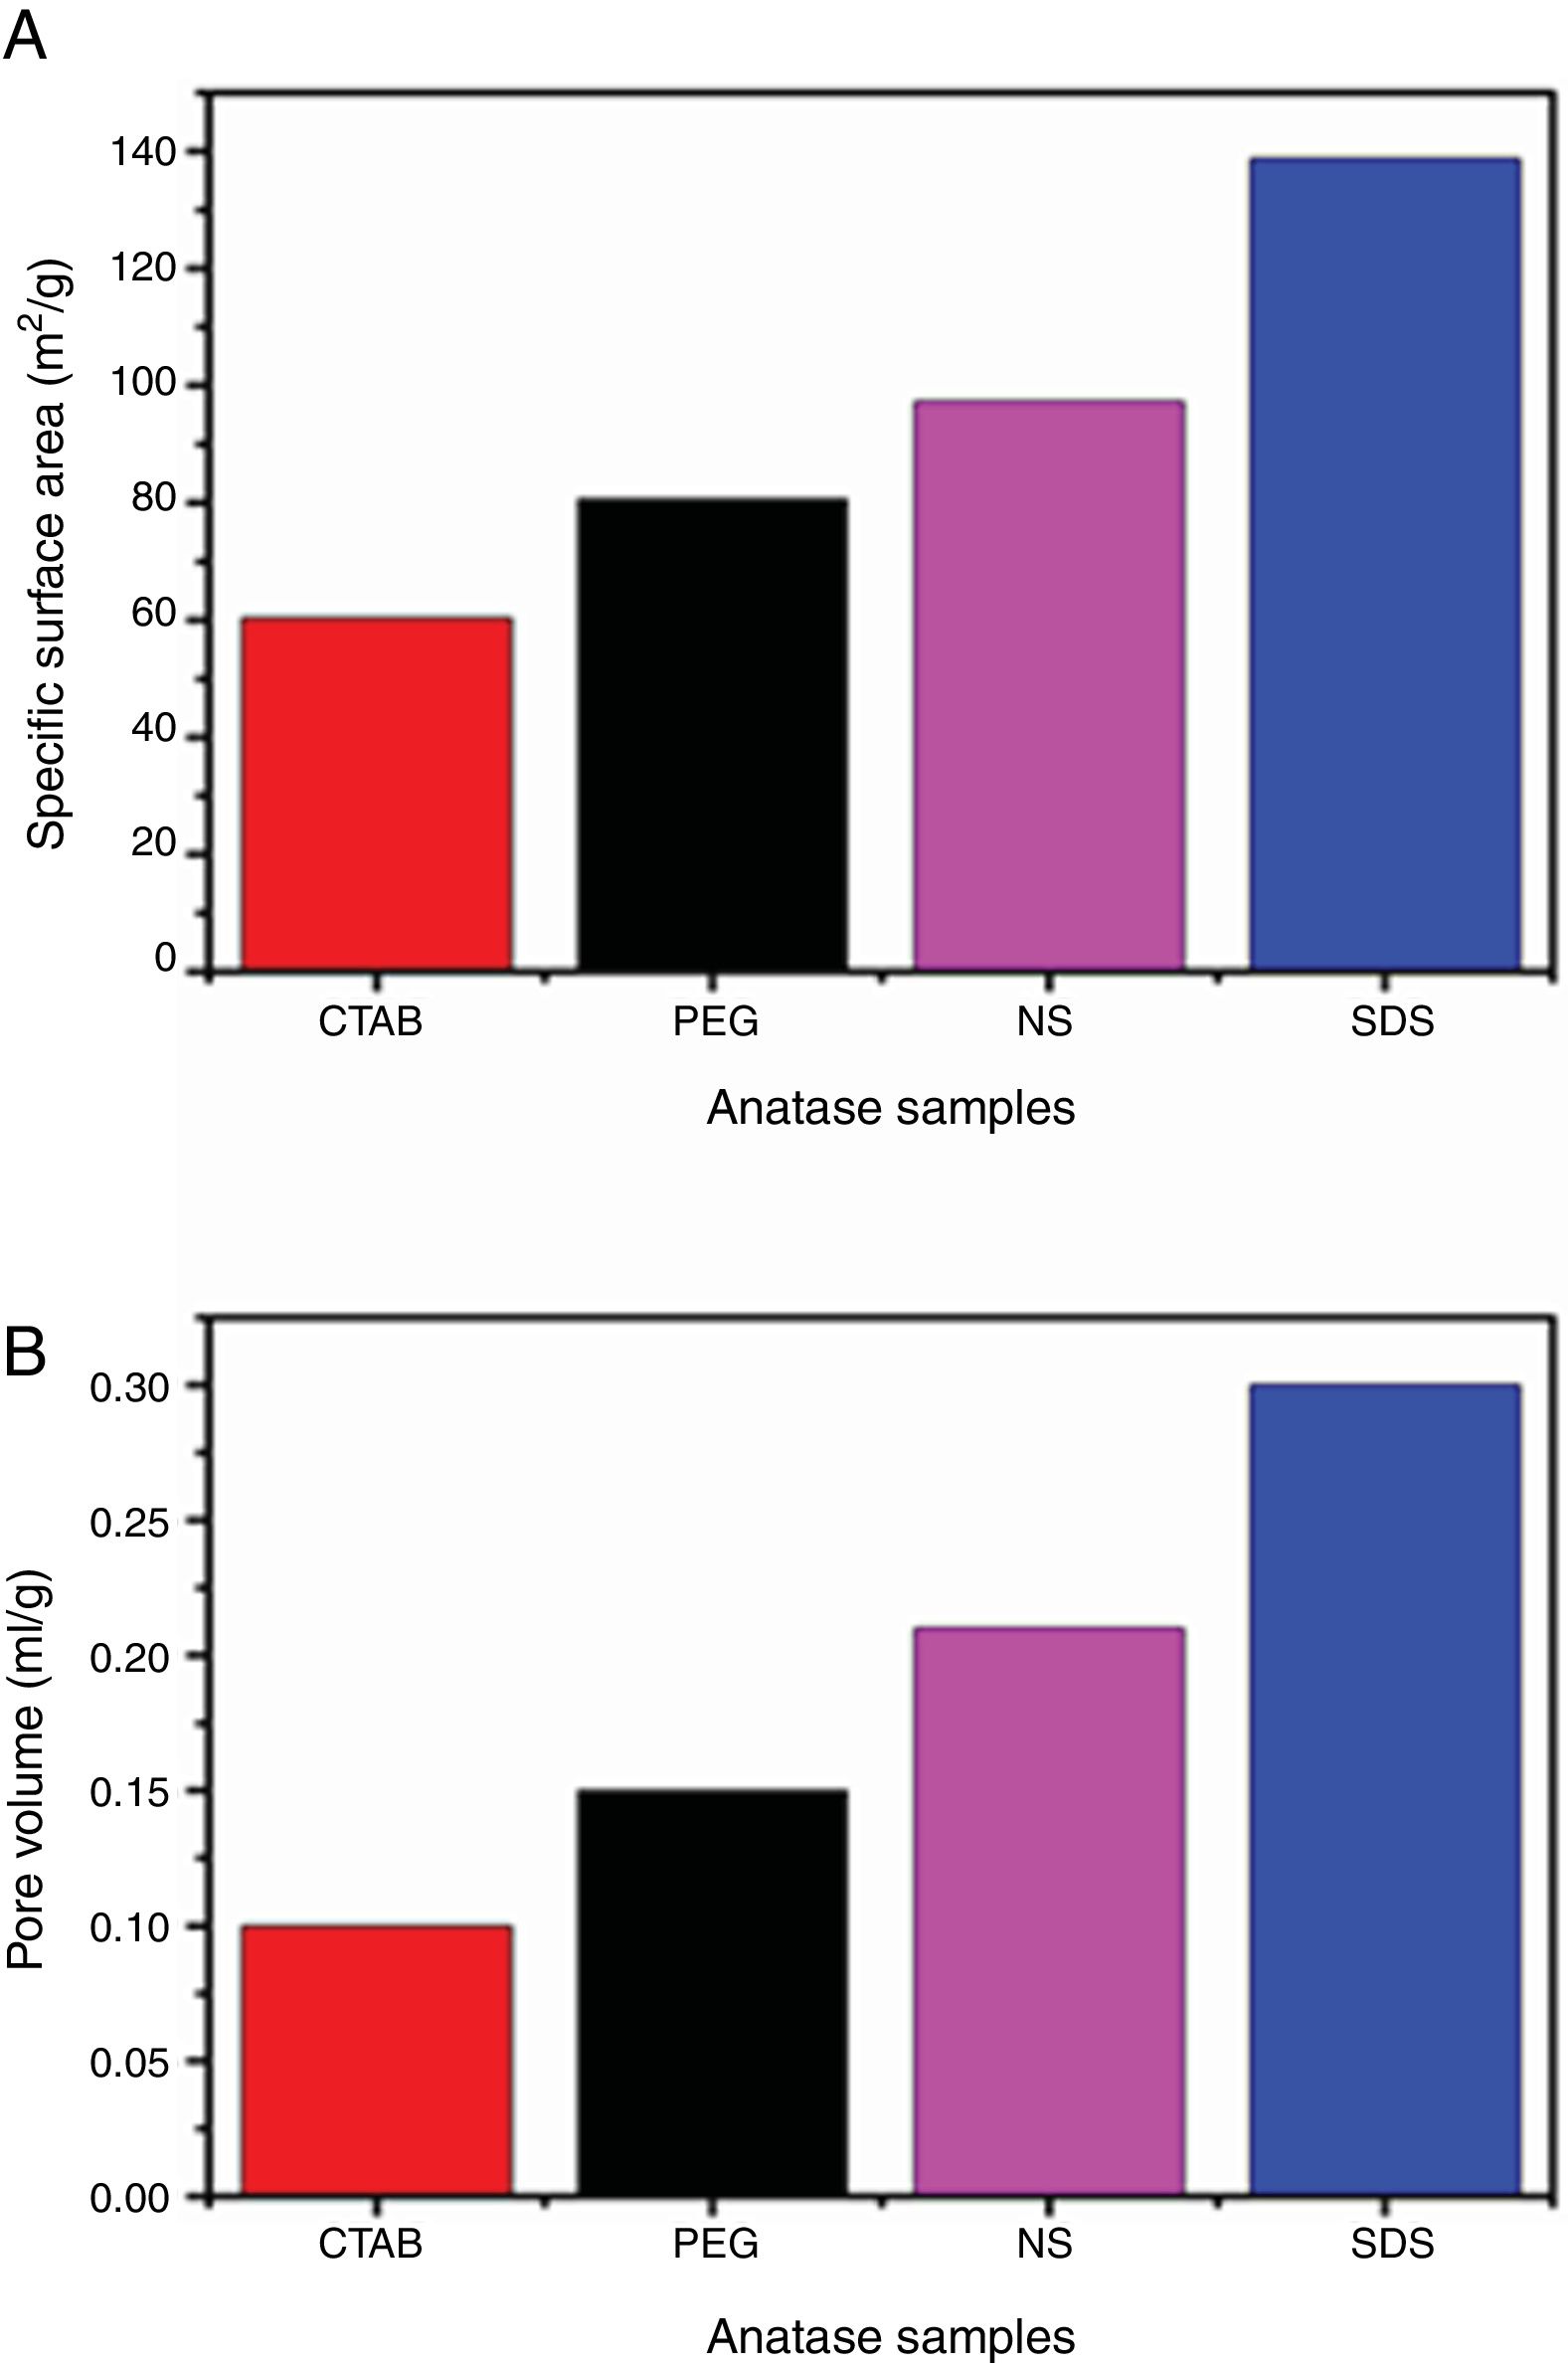
It can also be observed that the specific surface area increases as the pore size and pore volume increase, which could be because of the presence of interconnected pores, following the order SDS>NS>CTAB>PEG (Fig. 6A and B). It is important to mention that all anatase samples had specific surface areas higher than that of Degussa P25 TiO2 (50m2/g) [29].
 and specific surface area (B) of the anatase samples.")
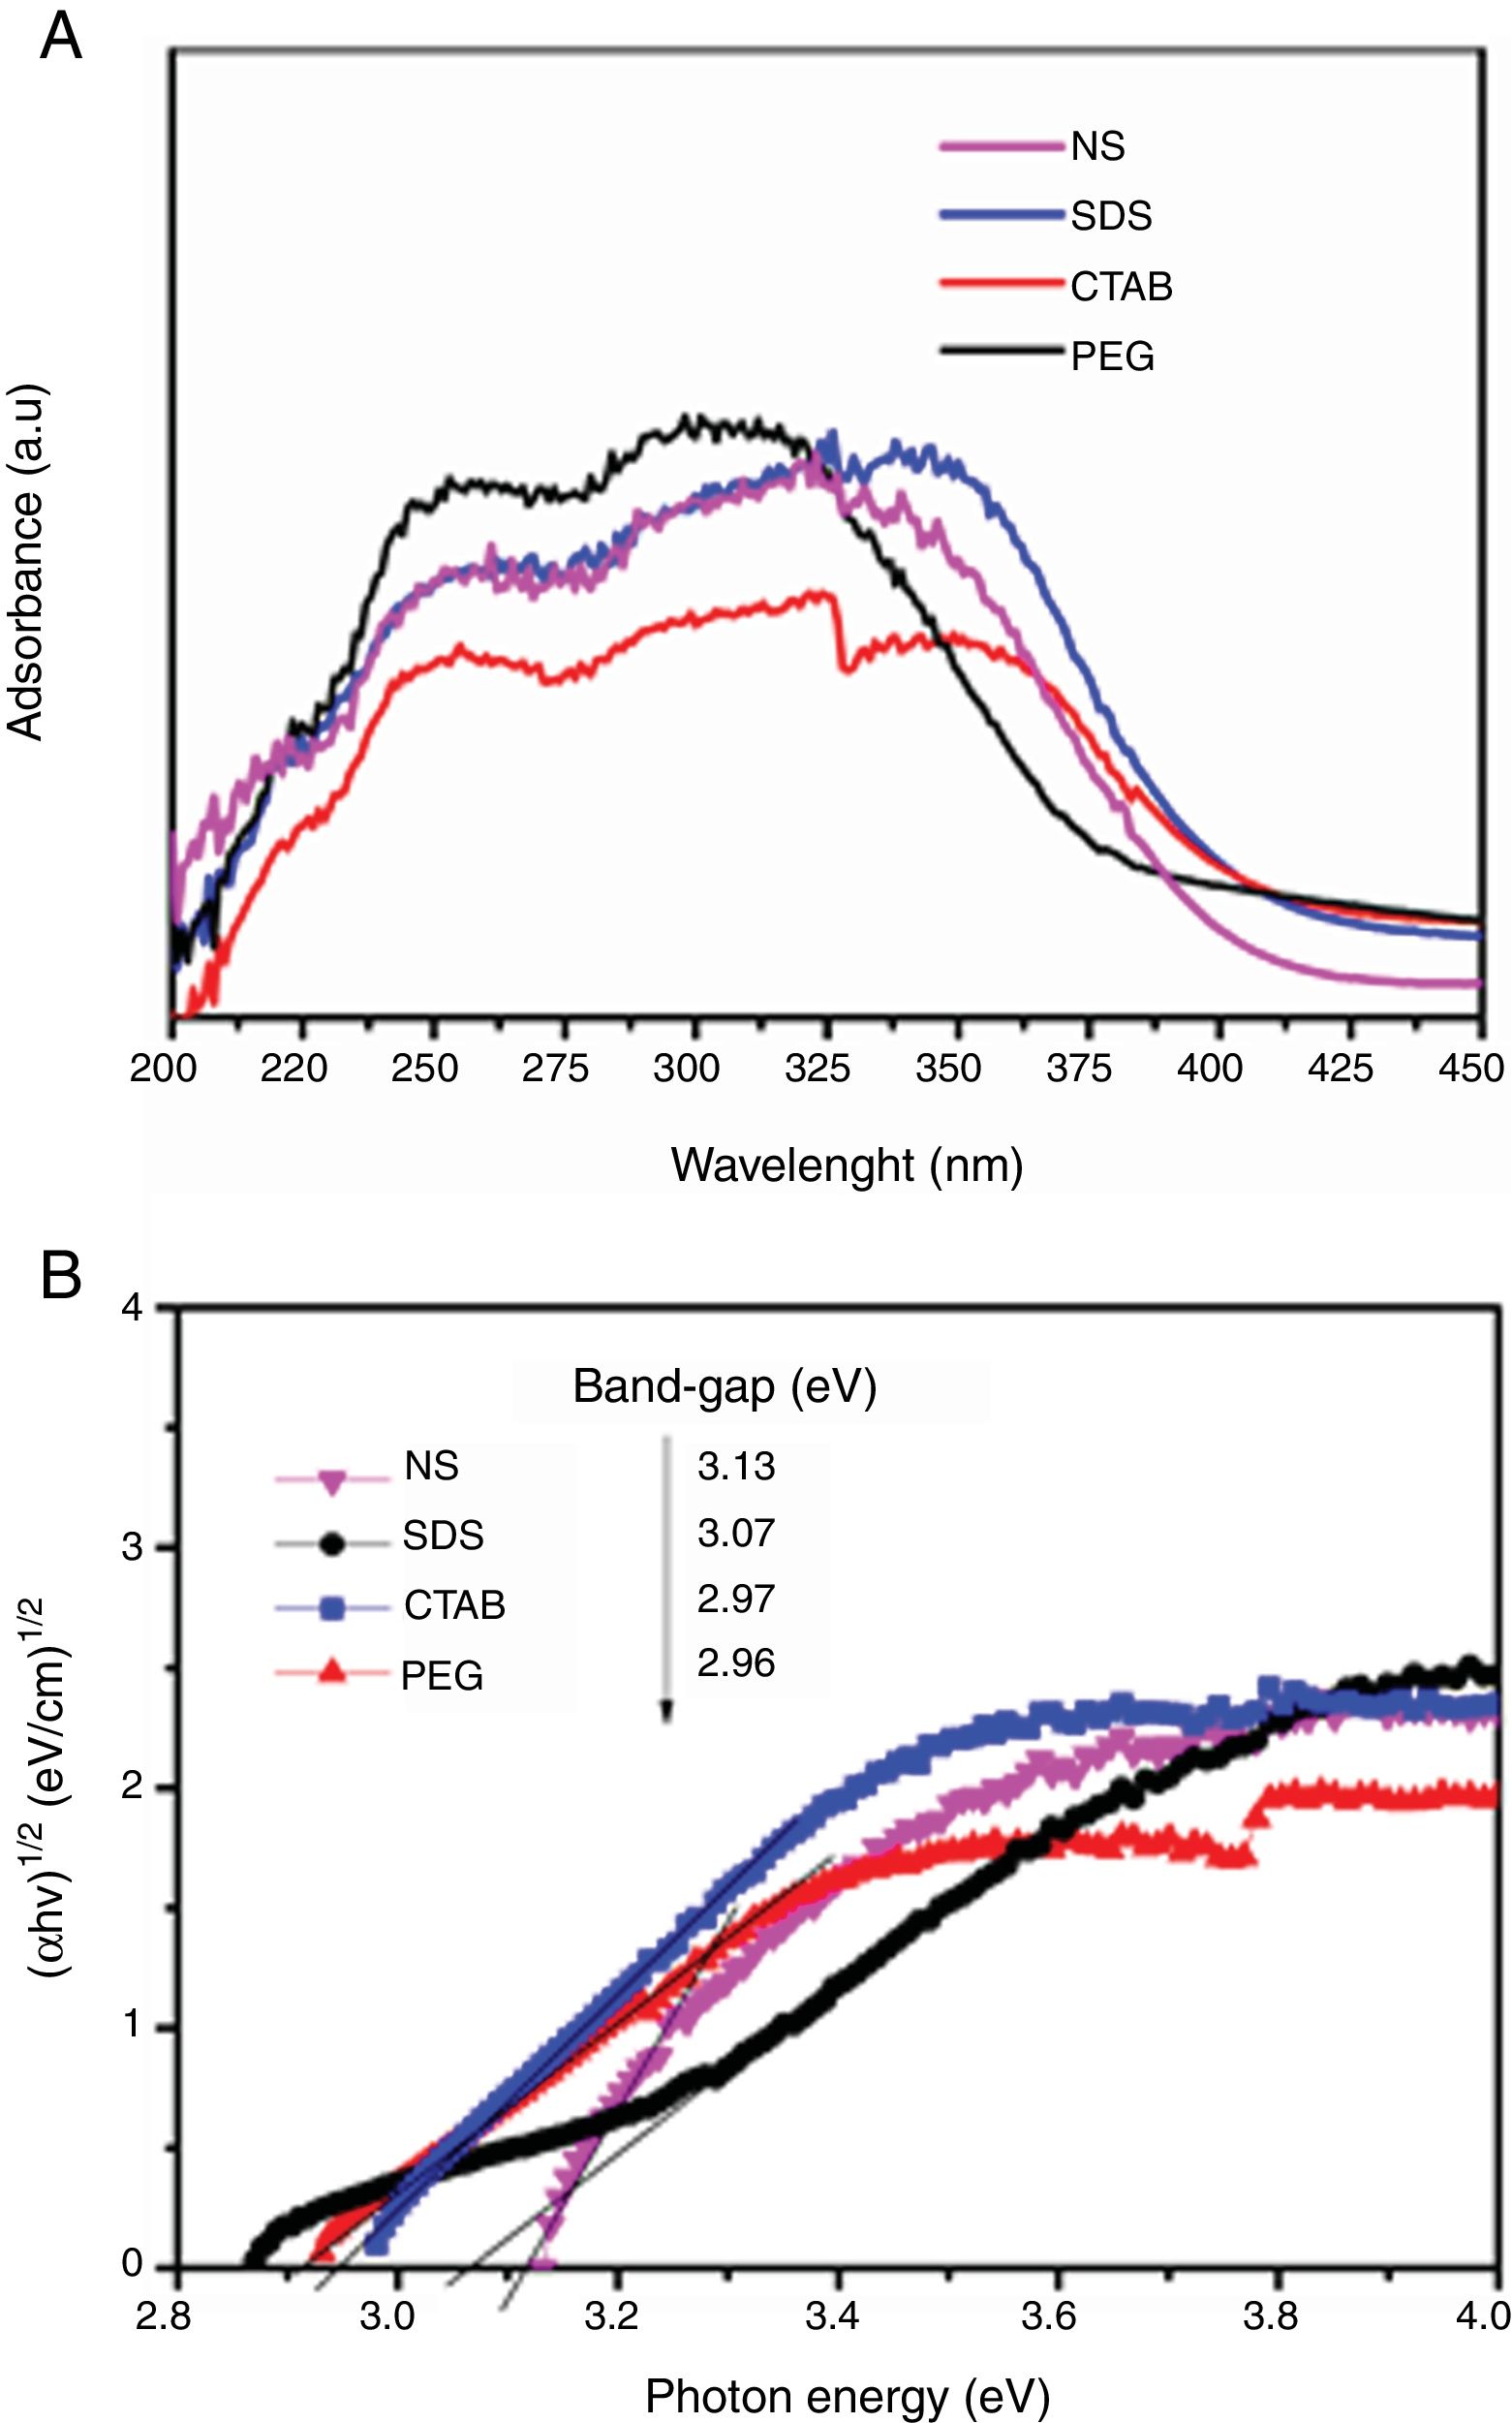
In Fig. 7A, the UV–vis diffuse reflectance absorption spectra of the anatase samples are shown. The sample synthesized with a nonionic surfactant (PEG) showed high absorption in the UV region, indicating that this sample can be activated mostly with UV light to initiate photocatalysis. The band gap of the anatase samples was determined by using the Tauc plot. The Tauc equation is (αhν)=A(hν−Eg)n, where α is the absorption coefficient, h is Planck's constant, ν is the light frequency, and A is a constant. The value of n es determined by the type of optical transition of a semiconductor. For TiO2, the value of n is 2 for indirect allowed transition. The band gap values from the absorption peaks were obtained by extrapolating the linear portion of the (αhν)1/2 curves versus photon energy (hν), to zero (Tauc plot, Fig. 7B). The samples synthesized with the cationic and anionic surfactants (CTAB and SDS) had the lowest band gap values, 2.96 and 2.97eV, respectively. These samples also showed higher absorption of visible light (from 380 to 408nm) compared to the others, which means they can be activated with solar light. All anatase samples had lower band gap values than that of Degussa P25 TiO2 (3.25eV) [30]. It is well known that the band gap decreases as the crystallite size of a sample increases [11]. In this work, it was found that the crystallite size affects the band gap value, but the effect cited in the literature was not observed. For example, the SDS, CTAB and PEG samples had a smaller crystallite size than the NS sample, however, this last sample has a higher band gap (3.13eV).
Evaluation of photocatalytic activity and Tauc-plot (B) of the anatase samples.")
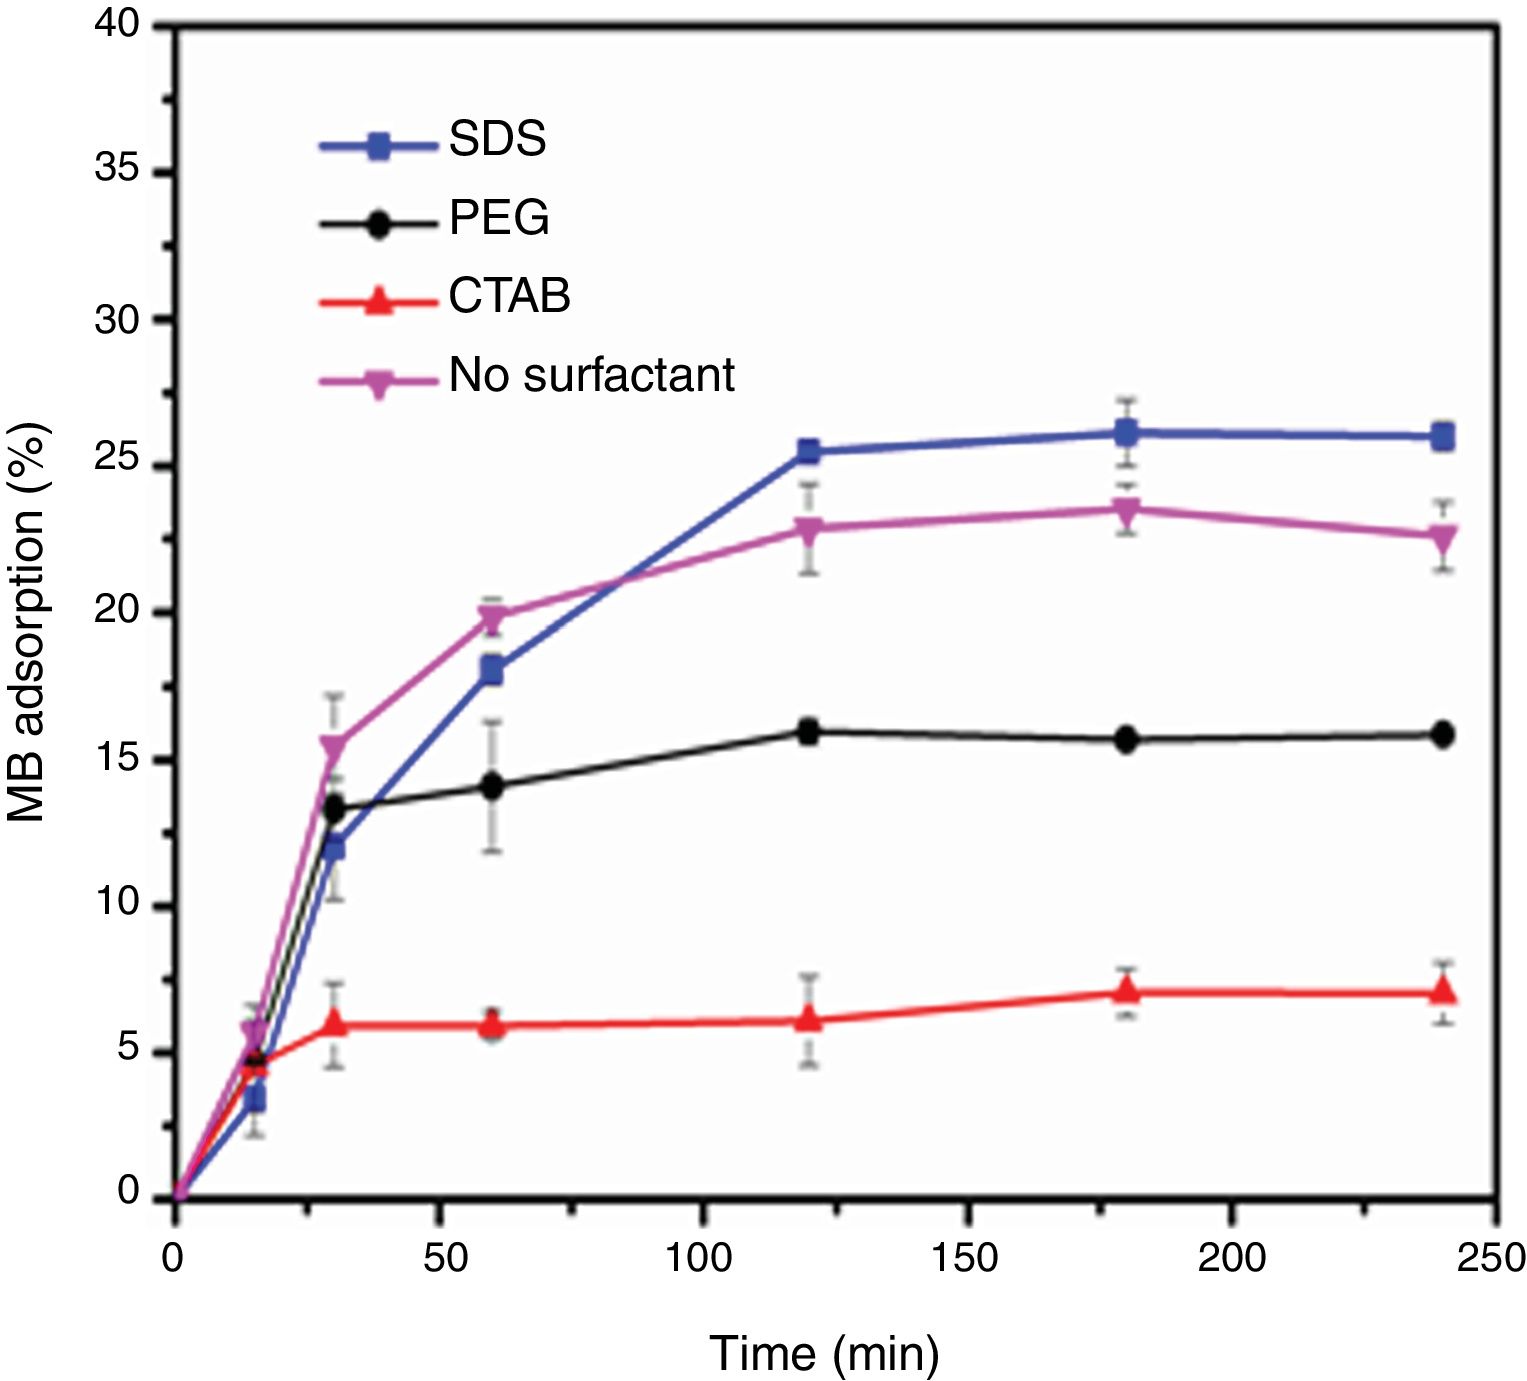
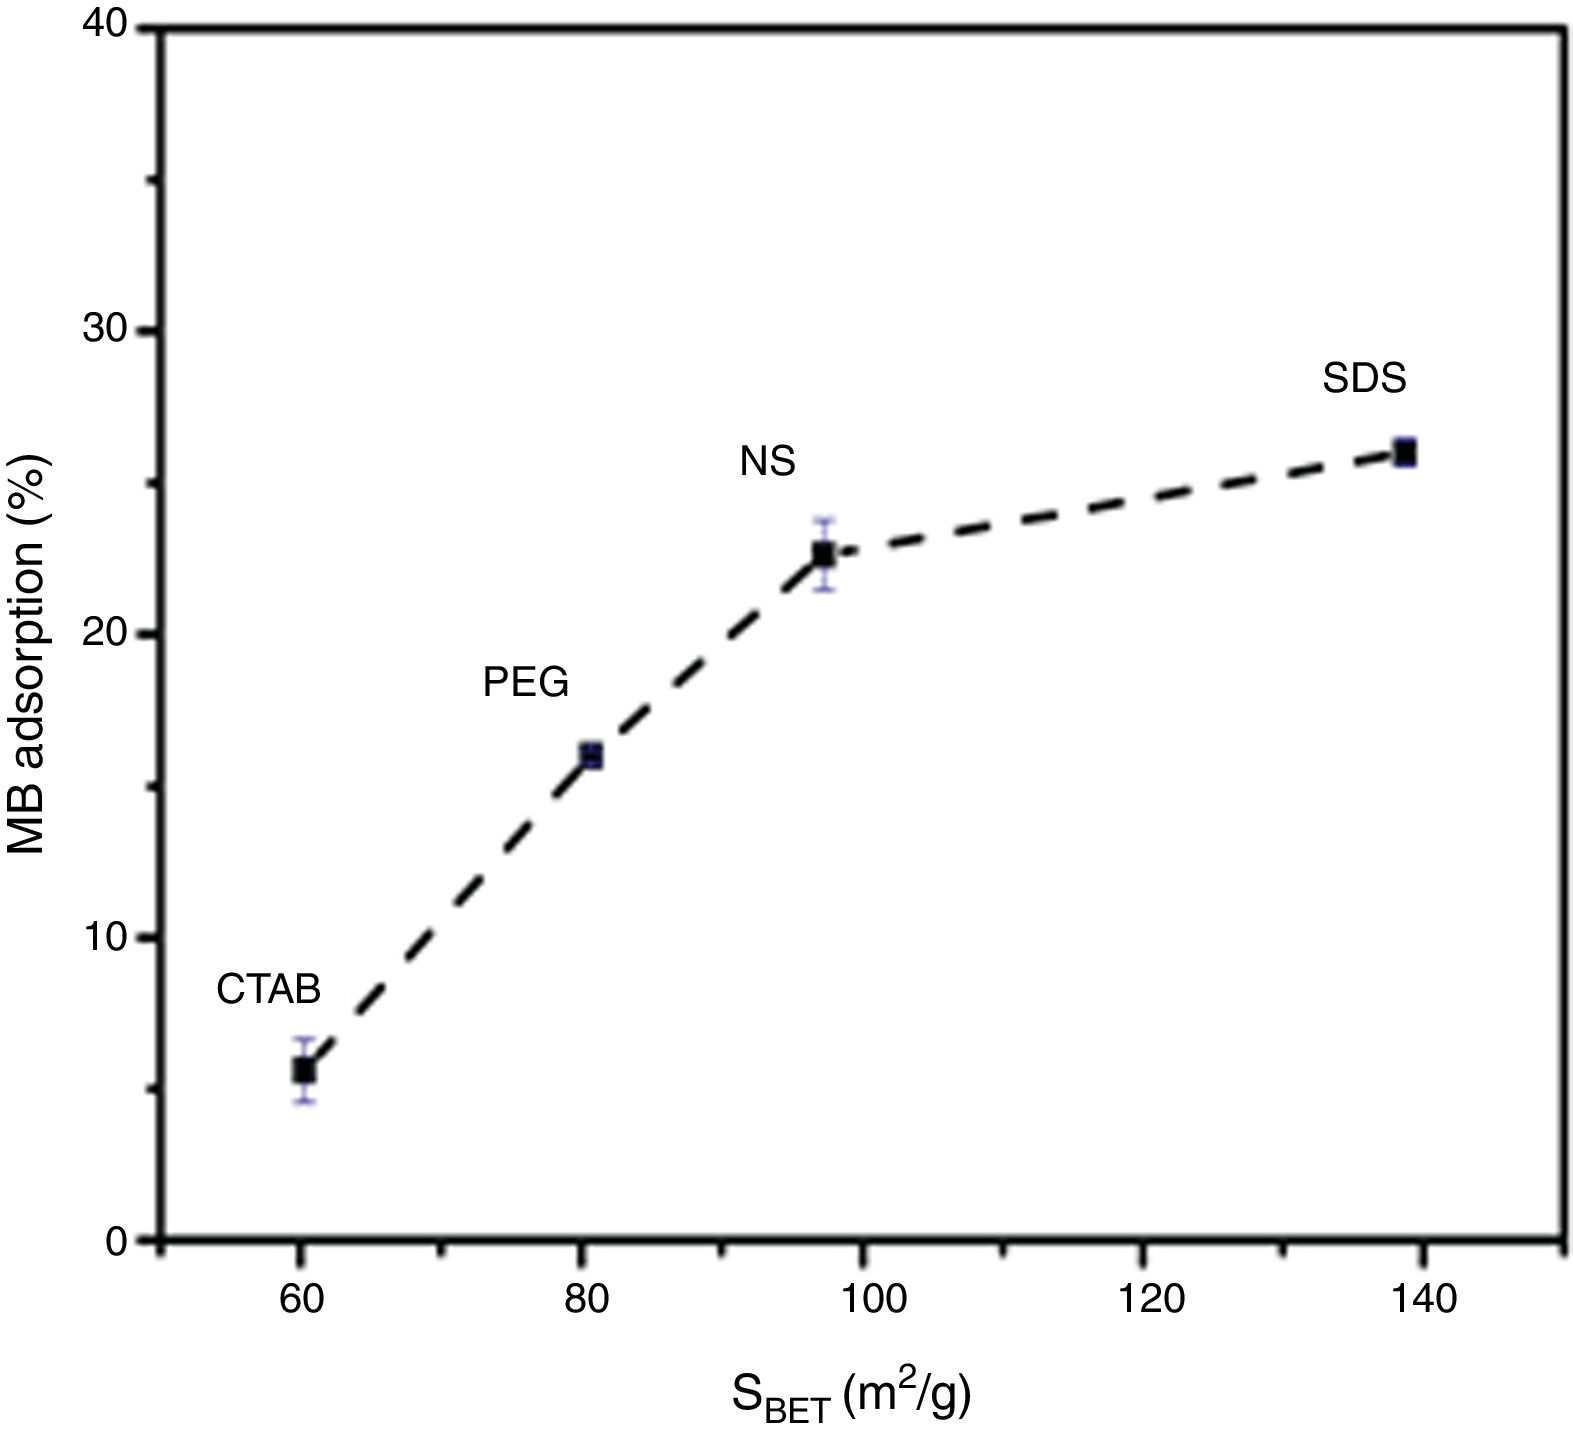
The results of the adsorption of methylene blue on the anatase samples are presented in Fig. 8. The sample synthesized with the anionic surfactant SDS adsorbed the highest amount (25.86%), followed by the NS sample synthesized without a surfactant (22.5%); these samples also had the highest specific surface areas and pore sizes. Fig. 9 shows the effect of the specific surface area on the adsorption of methylene blue; the adsorption data used corresponded to a time of 4h, at which adsorption equilibrium was reached. In this figure, it is shown that, as expected, the adsorption of methylene blue increases with the specific surface area; it is interesting to note that methylene blue adsorption increases linearly with the surface area for the PEG, CTAB and NS samples, which could be associated with the pore size distribution, which is more homogeneous in these three anatase samples.


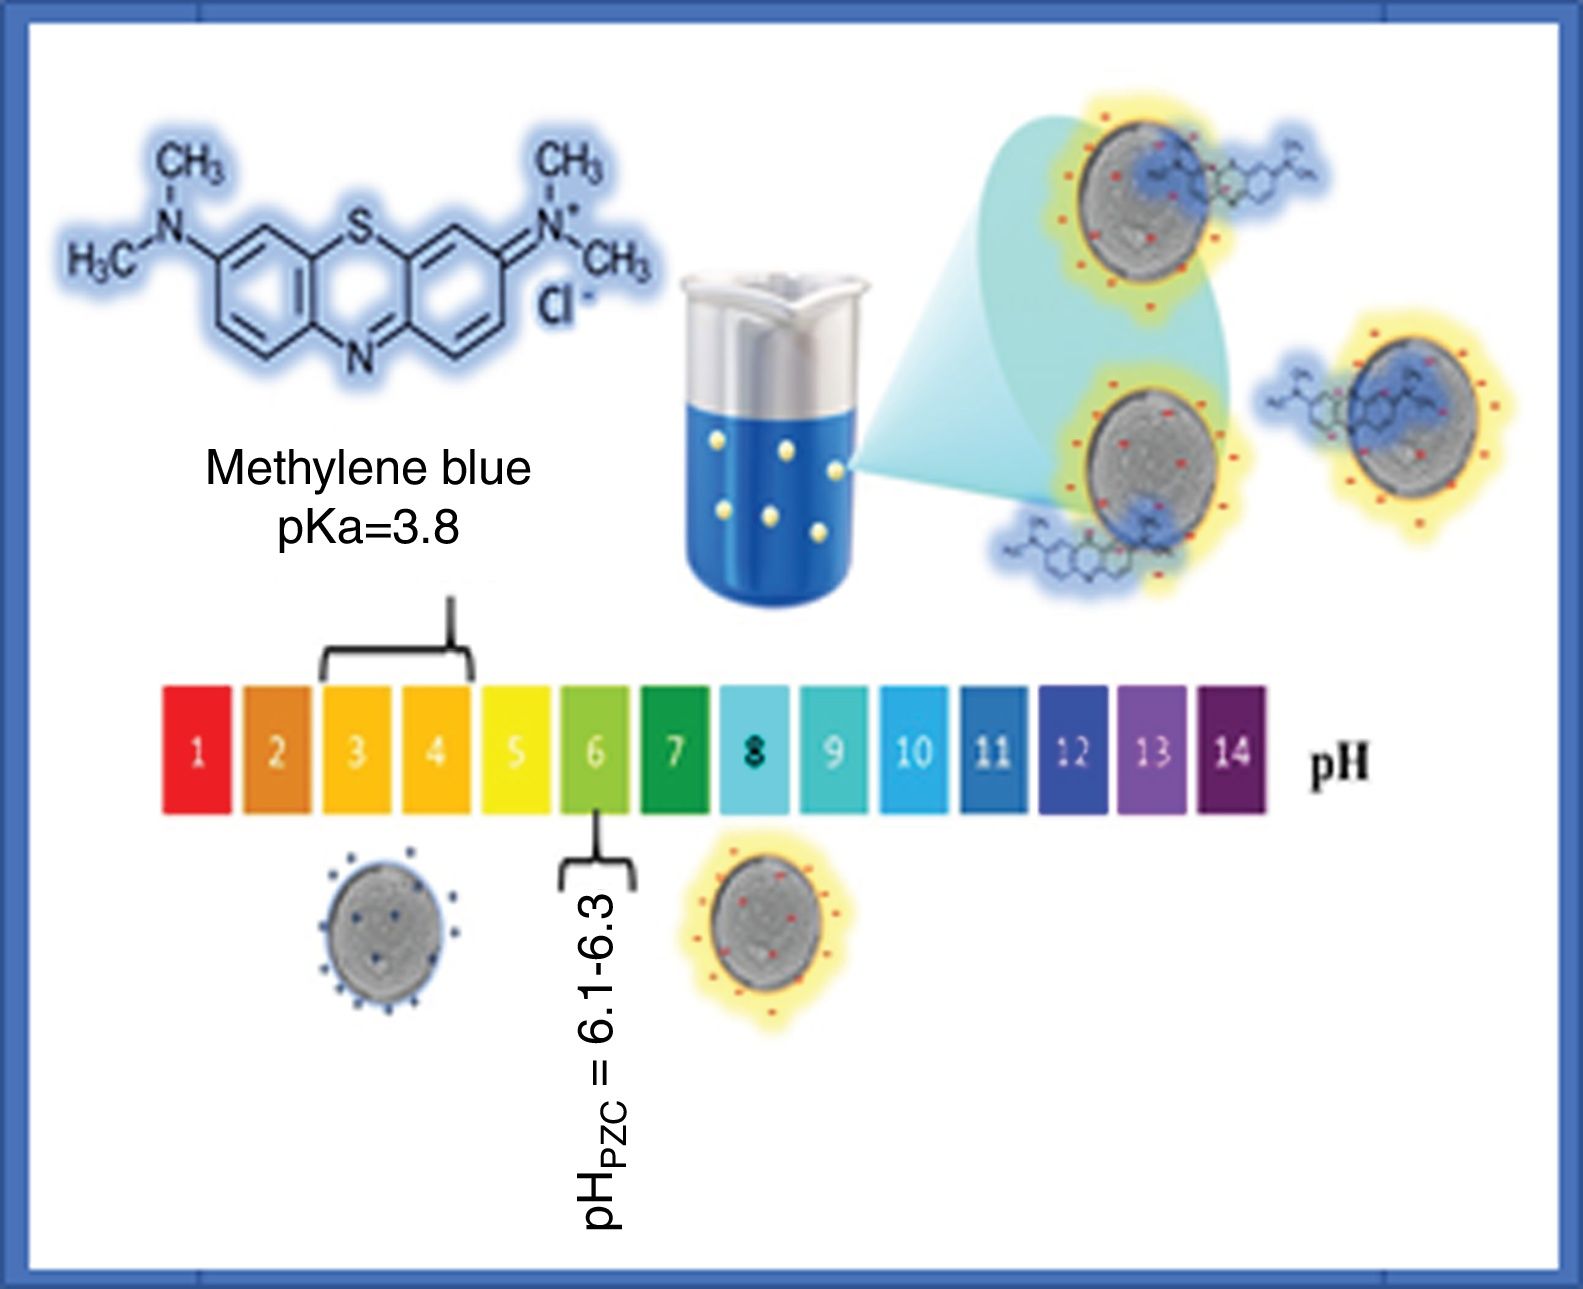
The adsorption of methylene blue molecules is also affected by surface groups in anatase particles, as well as their surface charge, the latter being positive at lower values of the point of zero charge (pHPZC), while at higher pH values it is negative. It is well known that the value of the pHPZC of a colloid is generally similar to the value of the isoelectric point (pHIEP) [31]. The pHIEP of the sample SDS was determined by measuring the zeta potential as a function of pH giving a value of 6.8. It has been reported that the pHPZC values of TiO2 ranges from 6.1 to 6.3, these values were obtained by experiments at ionic strength values from 10−1 to 10−2M using NaCl as electrolyte [31]. Considering that anatase particles have negative charge at pH value at which the adsorption and photocatalysis experiments were performed (pH=8), and that methylene blue molecules have a positive charge (pKa=3.8), it can be said that electrostatic attraction forces contribute to adsorption. A scheme illustrating the interaction of methylene blue with anatase particles is presented in Fig. 10.

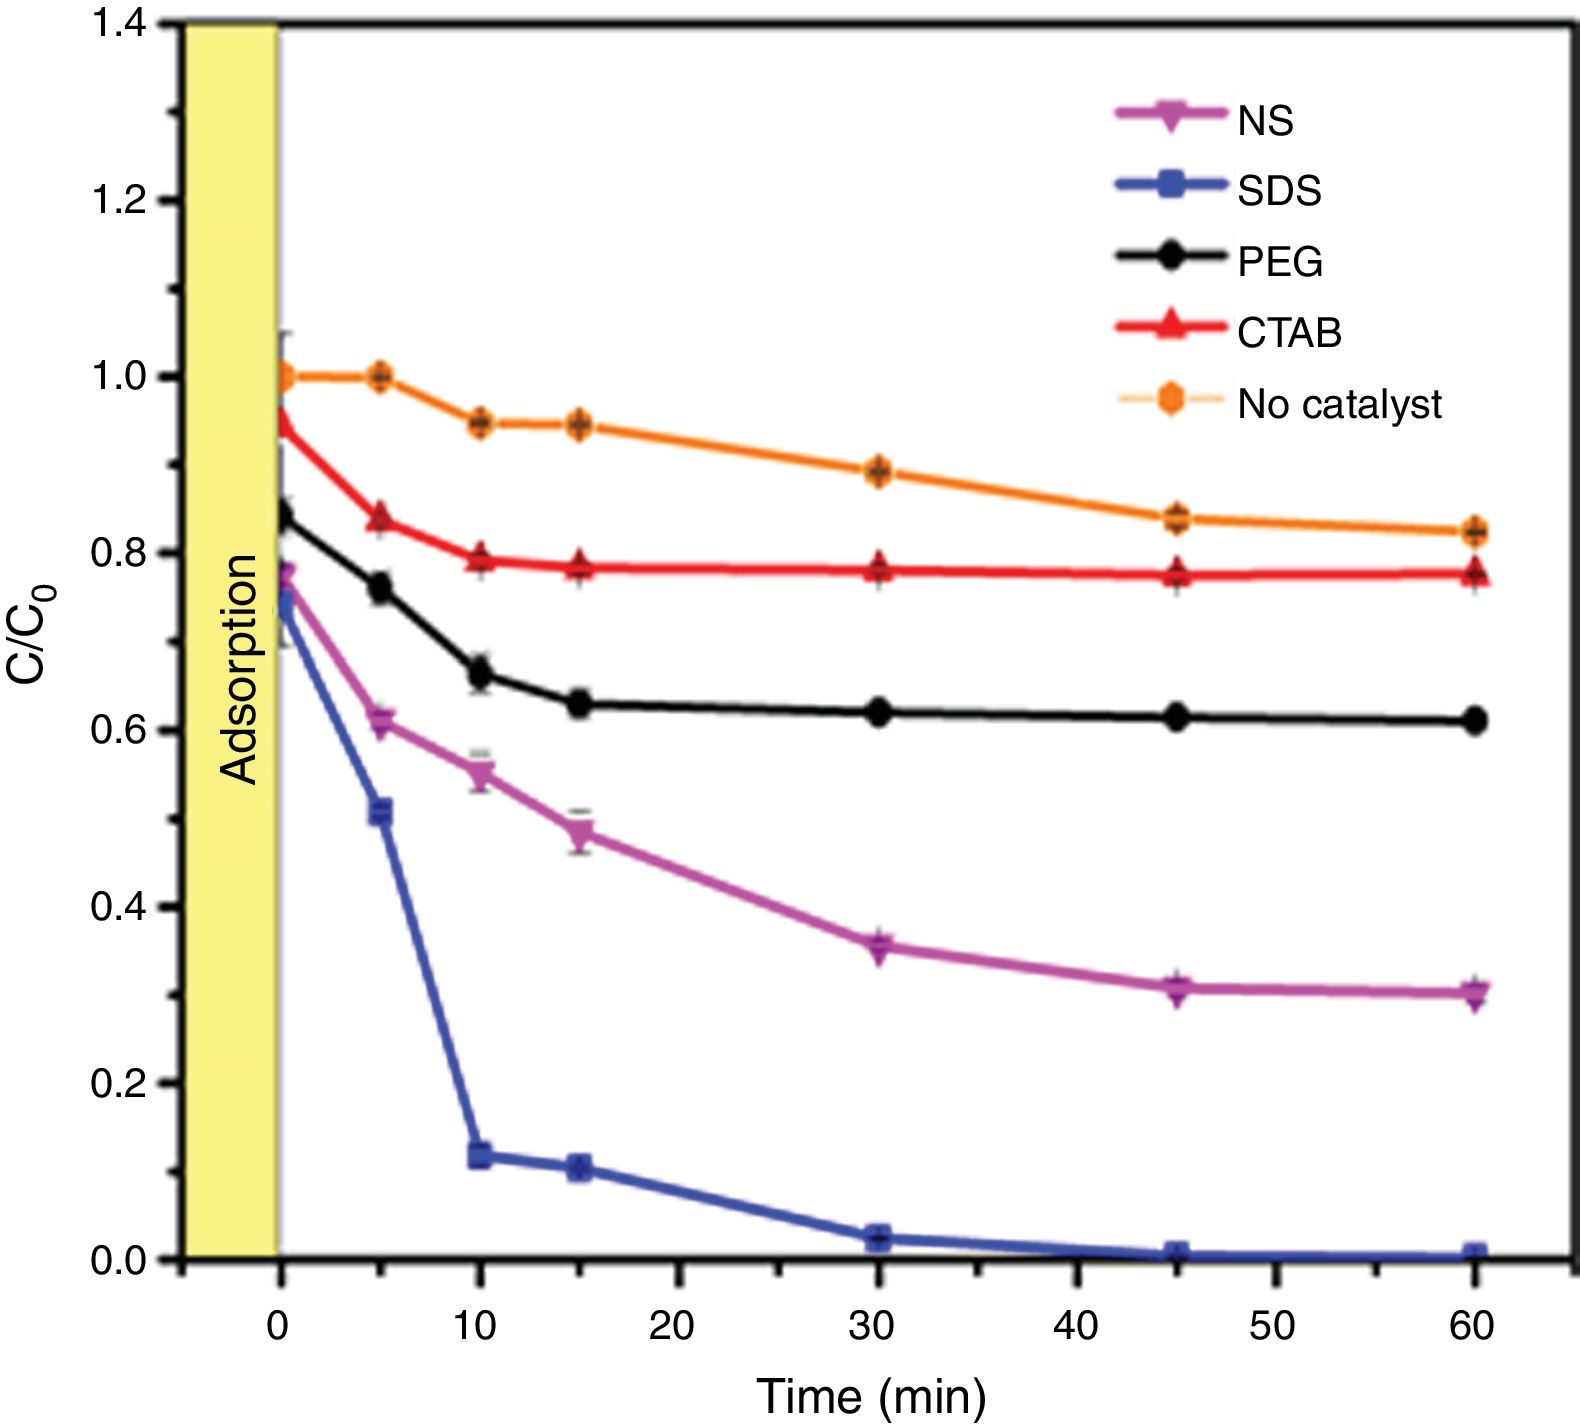
The photocatalytic activities of the samples were evaluated in methylene blue photodegradation, and the results obtained using UV irradiation are shown in Fig. 11. A control experiment was conducted in which methylene blue solution was irradiated with UV light in the absence of catalyst; no major change in methylene blue concentration is observed and only 18% of the dye was photodegraded. With the sample synthesized using SDS, it was possible to achieve a photodegradation of 99% in only 30min; this sample had the highest specific surface area and the lowest band gap of all the anatase samples synthesized in this work. It was observed that the photodegradation of methylene blue by the anatase samples increases in the order SDS>NS>PEG>CTAB, which is the same trend shown by these samples in the adsorption process (Fig. 8), showing that photocatalysis takes place on the surface of the material. It has been reported that OH groups on the surface of a sample can react with the holes generated in the photocatalytic process, preventing the recombination of electron–hole pairs [23]. The positive contribution of the OH groups in the photodegradation of methylene blue and phenol compounds has been reported [26,32].

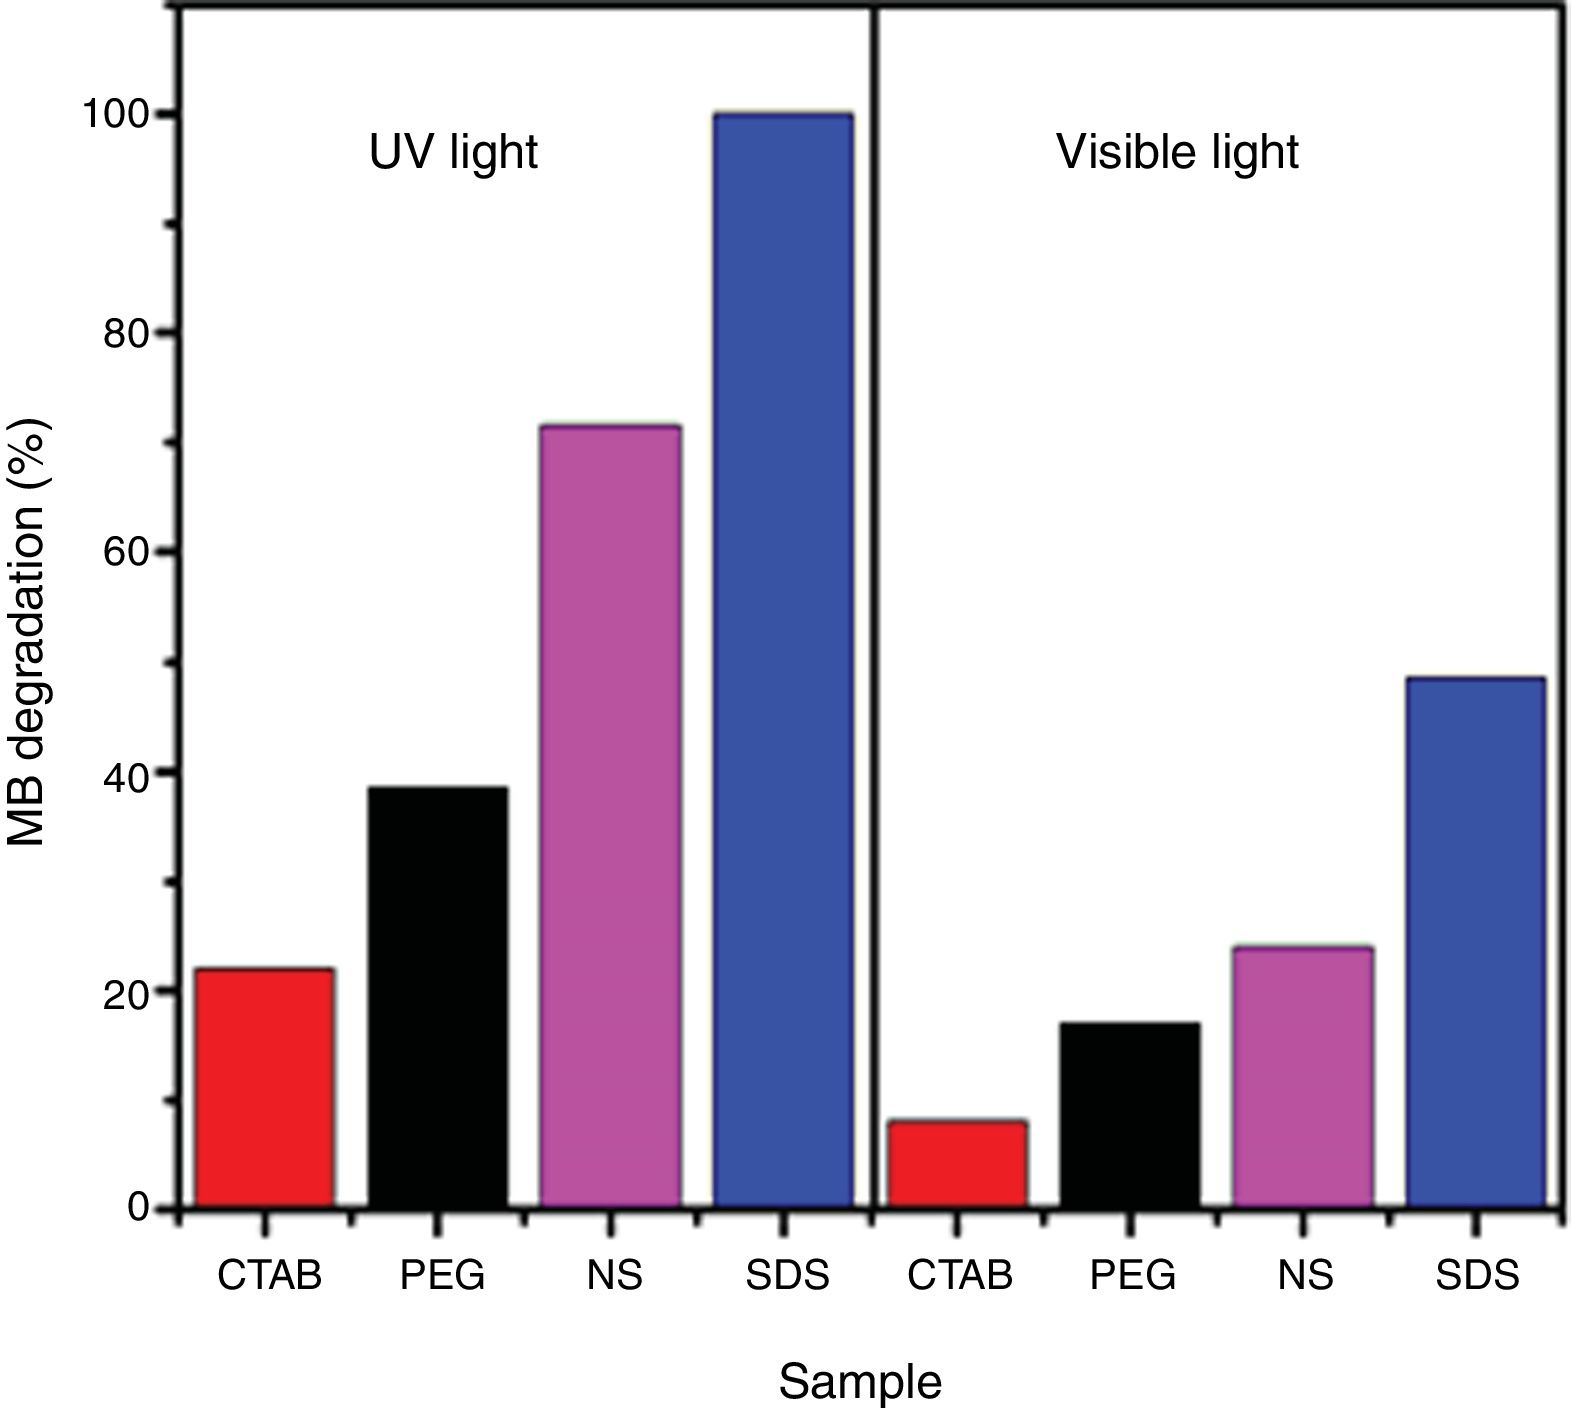
The obtained results of methylene blue photodegradation under visible irradiation are shown in Fig. 12, and they are compared with the results obtained using UV light for 60min. It is observed that photodegradation of methylene blue is better when UV light is used. The amounts of methylene blue that were photodegraded with samples PEG, CTAB and NS were similar to the adsorbed amounts of this dye in the dark (Fig. 8), indicating that these anatase samples do not possess photocatalytic activity in the visible region. On the other hand, 50% of methylene blue was photodegraded when sample SDS was used, this result demonstrates its good photocatalytic activity in the visible region.

Taking into consideration that the sample synthesized with the anionic surfactant (the SDS sample) had the highest specific surface area and pore volume, a band gap of 2.97, OH groups on its surface and a spherical morphology, a schematic representation of its photocatalytic activation for methylene blue degradation and the mechanism is shown in Fig. 13.
Conclusions
Based on the obtained results, it could be concluded that the use of a surfactant modifies the cell parameters of the tetragonal cell of anatase. Using cationic and nonionic surfactants (CTAB and PEG) allowed anatase samples with mesopores and macropores to be obtained, whereas the use of the anionic surfactant SDS allowed the acquisition of anatase nanoparticles with only mesopores and with a higher specific surface area and porosity than those of the other anatase samples. The absorption properties and band gaps of the anatase samples were closely related to their morphologies and pore size distributions. The spherical morphology and porosity of the mesoporous nanoparticles of the SDS sample improved the absorption of light in the visible region and the band gap (2.97eV). High specific surface area and porosity of SDS sample enhancing colorant adsorption, making the photocatalytic process more efficient under UV and visible irradiation. With the SDS sample was possible to achieve a colorant photodegradation of 99% in 30min, owing to its high specific surface area (138.72m2/g), its high pore volume or porosity (0.3cm3/g), its low band gap (2.97eV) and the presence of OH groups on its surface.
Conflicts of interestThere are no conflicts of interest to declare.
Author Sofía Estrada-Flores acknowledges CONACYT for the scholarship (446796). Antonia Martinez-Luevanos thanks Universidad Autonoma de Coahuila in Mexico for the financial support for this research.

