


In this study, the variation of microstructural properties in porcelain stoneware tiles was determined by changing the holding time at peak temperature during sintering, and effects of these microstructural changes on impact resistance of porcelain stoneware tiles were examined. Only the F4 samples passed the impact resistance test according to CSTB-NF-UPEC test. This sample has 12.3wt.% quartz, 1.5wt.% corundum, 5.8wt.% anorthite, 13.5wt.% mullite, and 66.9wt.% glassy phase. When the relationship between mechanical properties and impact resistance was evaluated, it should be emphasized that only F4 sample with a breaking strength higher than 75MPa passed the impact test. It can be said that there is a critical threshold in terms of impact resistance, especially for samples which have bending strength greater than 75MPa. When evaluating the microstructural details, this study shows that a single crystalline phase is not effective for impact resistance behavior of the porcelain stoneware tiles and many factors should be evaluated together.
En este estudio, la variación de las propiedades microestructurales en baldosas de gres porcelánico se determinó cambiando el tiempo de retención a la temperatura máxima durante la sinterización, y se examinaron los efectos de estos cambios microestructurales en la resistencia al impacto de las baldosas de gres porcelánico. Solo las muestras F4 pasaron la prueba de resistencia al impacto según la prueba CSTBNF-UPEC. Esta muestra tiene 12,3 wt.% de cuarzo, 1,5 wt.% de corindón, 5,8 wt.% anorthite, 13,5 wt.% mullita y 66,9 wt.% de fase vidriosa. Cuando se evaluó la relación entre las propiedades mecánicas y la resistencia al impacto, se debe destacar que solo la muestra de F4 con una resistencia a la rotura superior a 75 MPa pasó la prueba de impacto. Se puede decir que hay un umbral crítico en términos de resistencia al impacto, especialmente para las muestras que han resistencia a la flexión superior a 75 MPa. Al evaluar los detalles microestructurales, este estudio muestra que una sola fase cristalina no es eficaz para el comportamiento de resistencia al impacto de la porcelana.
Porcelain stoneware tile is characterized by its excellent technical and functional properties (low water absorption, high mechanical properties, resistance to chemical and cleaning agents, etc.) [1]. Because of these features, they are often preferred by customers and become important component in the construction sector in recent years. In addition to the existing high mechanical properties, it is expected that they will be resistant to impacts for some special areas, especially in crowded places (supermarket, hospital, etc.). Studies about impact resistance are generally focused on ballistic and armor applications in the literature [2–4]. Apart from ballistic and armor applications, other studies are generally focused on increasing the impact strength of the glasses. Chaudhri et al. [5] studied about impact behavior of the silicate, germanate, and borate glasses with using steel balls. Ball et al. [6] shared detailed information about the impact behavior of glass plates considering the crack size and crack types. Several studies on impact resistance are also noteworthy in traditional ceramics. Dondi et al. [7] examined the behavior of porcelain stoneware tiles with different thicknesses against impacts and classified them according to impact energies and kind of cracks. Selli et al. [8] investigated the effect of composition design on the impact resistance of porcelain stoneware tiles. The importance of new crystal phases formation in the microstructure was emphasized considering the impact resistance of the porcelain stoneware bodies. Since the microstructural properties which are related to filler (quartz particles), mullite crystals, a silica-rich amorphous phase, and porosity affect many technical properties of porcelain stoneware tiles such as water absorption [9], strength [10], stain resistance [1], optical properties [11], etc. To evaluate impact resistance of the porcelain stoneware tiles, these properties must be investigated.
In this study, it was aimed to examine the relationship between the microstructure and impact resistance of the porcelain stoneware tiles. To observe this effect, duration time at the peak temperature during sintering was changed in a constant composition, and changes in the microstructure were determined by considering this parameter. The effect of these changes in the microstructure (quartz size, pore size, mullite crystal size, and mullite aspect ratio) on the impact strength of the porcelain stoneware tile was evaluated.
Experimental procedureMaterials and sample preparationIn this study one composition was prepared to determine effect of sintering parameters on the impact resistance of the porcelain stoneware. Chemical characterization was carried out by means of wavelength dispersive X-ray fluorescence spectrometry (XRF), using Philips Model PW 2400 XRF Instrument fitted with an Rh white florescent tube. The sample was prepared as fused beads using a Philips PERL’X3 instrument. Chemical analysis of the porcelain stoneware composition (denoted as N1) is shown in Table 1.
Chemical composition (wt.%) and particle size distribution of porcelain stoneware tile (N1).
| Components | N1 composition (mean) (S.D.) |
|---|---|
| SiO2 | 60±2.0 |
| TiO2 | 0.52±2.0 |
| Al2O3 | 25.32±1.0 |
| Fe2O3 | 0.32±0.01 |
| MgO | 0.47±0.2 |
| CaO | 2.0±0.01 |
| Na2O | 4.3±0.2 |
| K2O | 1.2±0.2 |
| L.O.I. | 6.19±0.2 |
| Particle size distribution | d10 (μm):1.15±0.5d50 (μm):8.92±0.5d90 (μm):30.50±0.5 |
L.O.I*: Lost of ignition.
S.D*: Standard deviation.
This composition (N1) was wet milled by a laboratory ceramic jar mill containing 70wt.% solid and 1.0wt.% deflocculant, for 20min. Particle size distribution of the slurry was determined by laser diffraction analysis (Malvern Mastersizer 2000). The particle size distribution of N1 porcelain stoneware tile composition is given also in Table 1. When the grain size distribution of N1 composition is examined, it is seen that the prepared slurry has a wide grain size distribution interval. The slurry grain size distribution range is in the production standards. After the grinding of the raw materials, slurry was dried at 110°C. The remaining powders were moistened by spraying water droplets for granulation. Formed granules were screened in between sieves having aperture of 600 and 250μm. The granulation was continued until all the granules retained on the sieve with an aperture of 250μm. The moisted granules of each body were placed in the cavity of a steel die and test specimens were shaped by applying a pressure of 30MPa with the use of a hydraulic press. While the disc shaped samples were produced for firing steps, the rectangular-shaped bar samples were prepared for the mechanical study. The dimensions of discs were 50mm in diameter and rectangular bars were 75mm×7mm×5mm after pressing at 30MPa. In order to make impact resistance of the samples, pilot scale production was carried out. The process consists of slurry preparation (mixing, grinding, sieving), drying, pressing, and firing. Firstly, N1 composition was prepared according to the percentage of the composition represented in Table 1. This composition was milled below 45μm in which the weight of oversize material was about 1.5–2.0%. The prepared slurry was then granulated by spray-drier at 500–550°C. The moisture content of the granules was adjusted to around 5.0–5.5% and rendered ready for pressing. Dried powder was shaped by dry pressing for 20cm×20cm×14mm products. Finally, samples were single fast fired in a roller furnace under industrial conditions (at a peak temperature 1220°C with changing duration time at the peak temperature). Then, products were subjected to impact test.
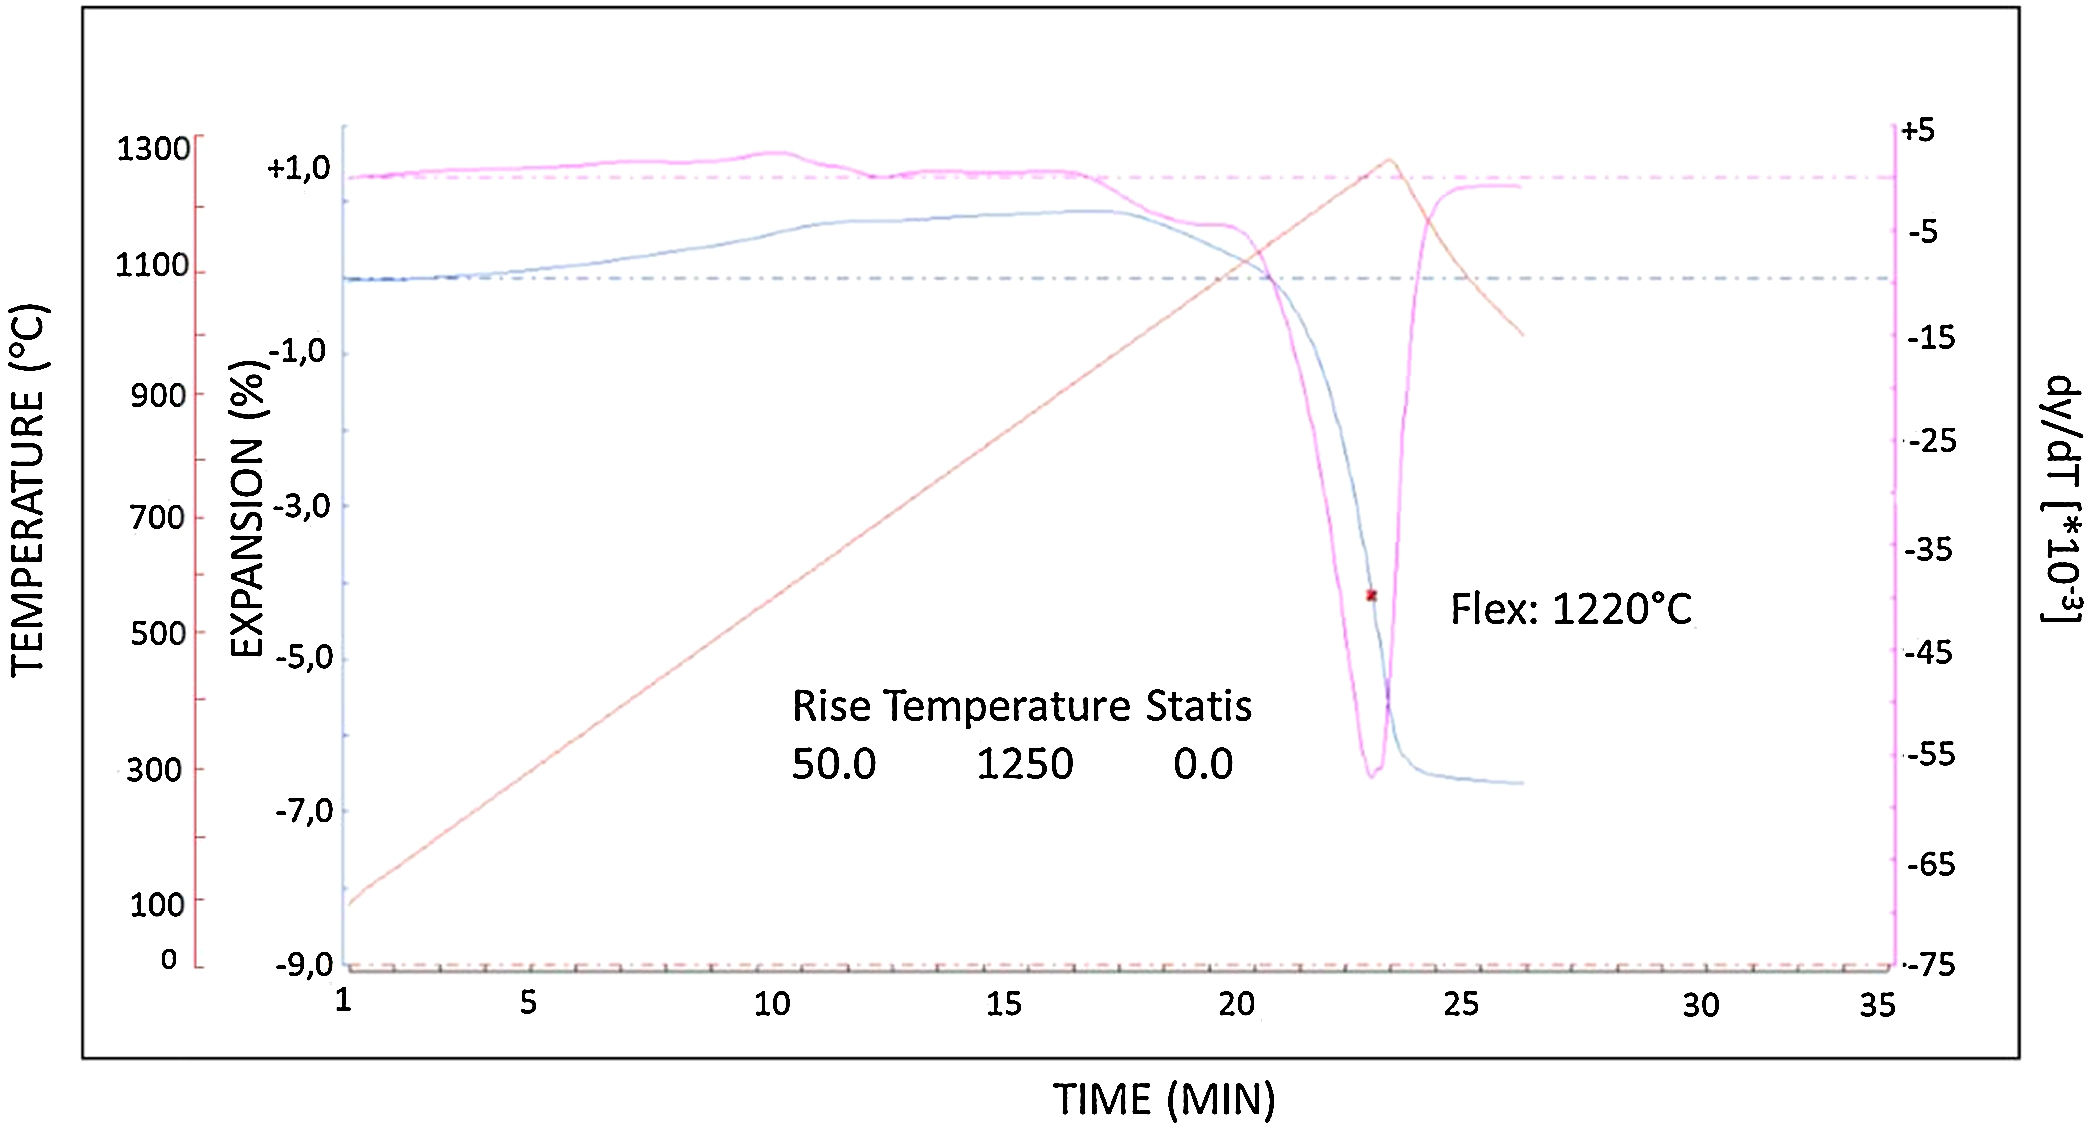
Determination of the sintering behaviour of the compositionSintering temperature of the N1 composition was determined by flex point (i.e., temperature at which densification rate is maximum) using the optical dilatometer (Misura 3.32, ODHT-HSM, Expert System Solutions, Italy). Sample was prepared as (15×5×5mm) dimension by press. Sample was heated in an optical dilatometer at a rate of 50°C/min up to 1250°C without soaking at peak temperature an air atmosphere condition to determine flex point as stated by Paganelli [12]. Optical dilatometer analyses of N1 composition is represented in Fig. 1. The point that corresponds the maximum sintering rate, is called the “flex point”, was also determined. For N1 composition, this point was determined as 1220°C by optical dilatometer analyses.

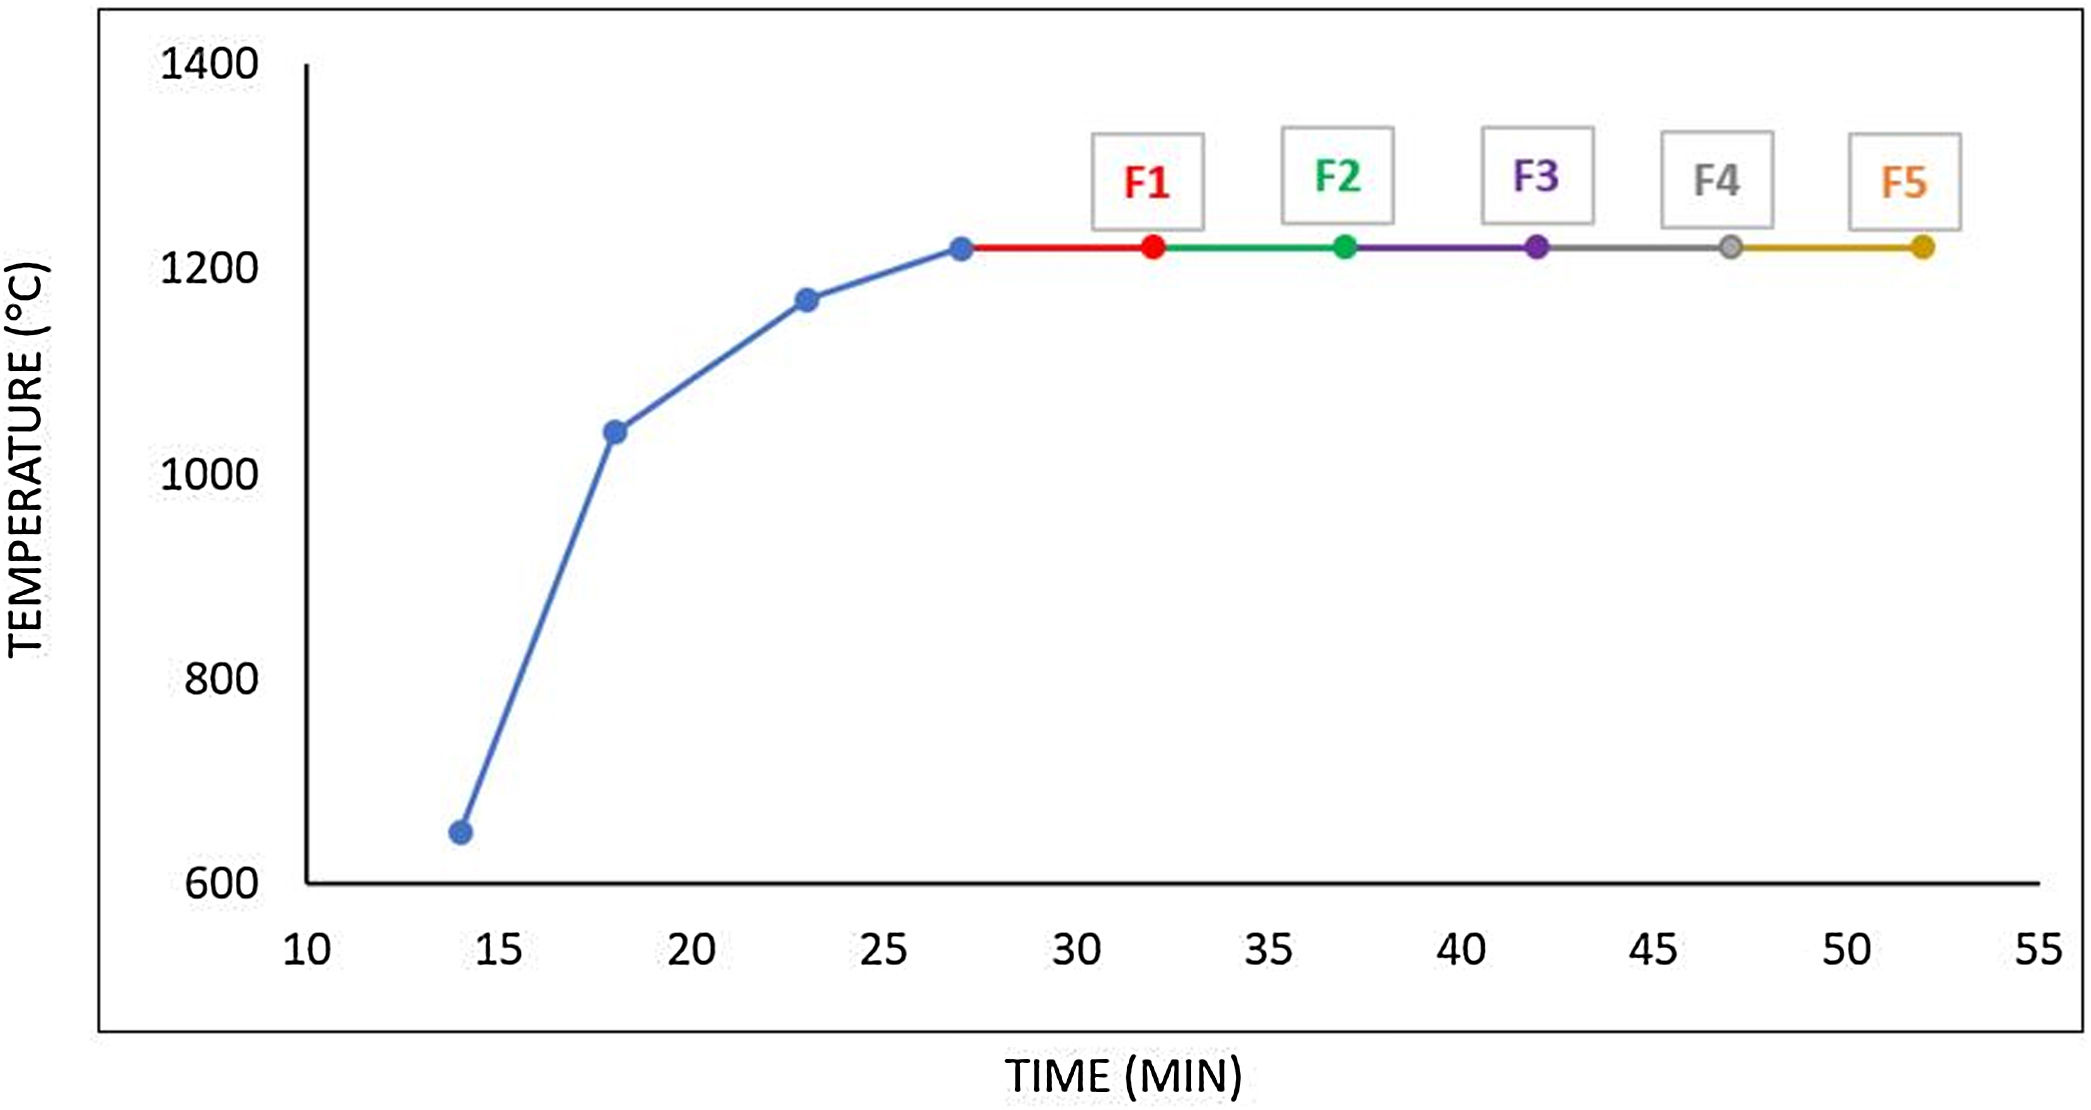
After determining the flex point of the N1 composition, different firing cycles were applied to the samples. The samples were fired at fast firing cycle as represented in Fig. 2. Holding time at the maximum temperature of the compositions was gradually increased to give sufficient time for the crystalline growth.
Samples characterization
Bulk density and open porosity of the samples were determined by water saturation under vacuum and Archimedes’ principle (ISO 10545-3) by using related equations (Eqs. (1) and (2)). The total porosity of the samples was measured by using the relationship between bulk density and specific density of the material (Eq. (3)). Closed porosity was determined by using Eq. (4) and the specific density of the samples was measured by a Helium pycnometer.
where ρb, bulk density, wd, dry weight of the sample, ww, wet weight of the sample, ws, weight of solid suspended in water, ɛc, closed porosity, ɛT, total porosity, ɛ0, open porosity.


The modulus of elasticity of sintered samples was measured by the resonance frequency method according to ASTM C1259-94 standards. For this, Grindo-Sonic model instrument was used to measure the frequency of the sound generated on the samples at ambient temperature. The flexural strength of sintered samples was measured with an electronic universal tester (Model 5569, Instron Ltd.) by a three-point bending test with a lower span of 50mm and crosshead speed of 1mm/min, based on ASTM standard C1161-90.
The crystalline phases developed in the microstructure of sintered samples were identified by X-ray diffraction (XRD) method. The analyses were performed on powdered form of samples which were scanned at a scanning speed of 2°/min in the range of 10–70° with CuKα radiation, (λ=0.154nm), at 40kV and 40mA conditions using RIGAKU 2200 DMAX diffractometer. The crystalline phase composition was quantatively analysed with the software Material Analysis Using Diffraction (MAUD) based on the Rietveld method.
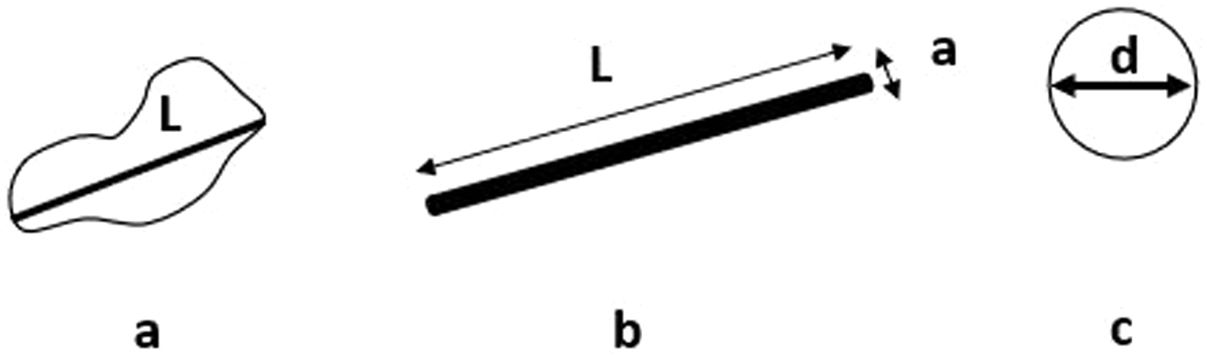
The types, shapes, and morphologies of phases both solid and porosity in the microstructure were investigated by scanning electron microscopy (SEM) analysis with the use of Philips XL30 SFEG SEM. For SEM observations, specimens were prepared by grinding with SiC abrasive papers while being lubricated with water and then polished using diamond pastes. To reveal the crystalline structure, the polished surface samples were chemically etched in 3% HF solution for 1.5min before being coated with gold. Microstructure analysis of samples was carried out considering pore sizes (diameters), mullite crystal width (a) and length (L), mullite aspect ratio (L/a), size of quartz crystals. Since the anorthite crystals in the microstructure were clustered and intertwined, microstructure analysis could not be performed on these crystals. Details of the microstructural measurement analyses are given in Fig. 3. Totally 600 microstructure elements were taken into account for each sample. SEM samples were prepared from different regions of the same sample, and all microstructural properties measurements were measured using the Fiji Image J software program.
 for quartz particles (L: Length), (b) for mullite particles (L: Length, a: width), (c) for pores (d: diameter).")
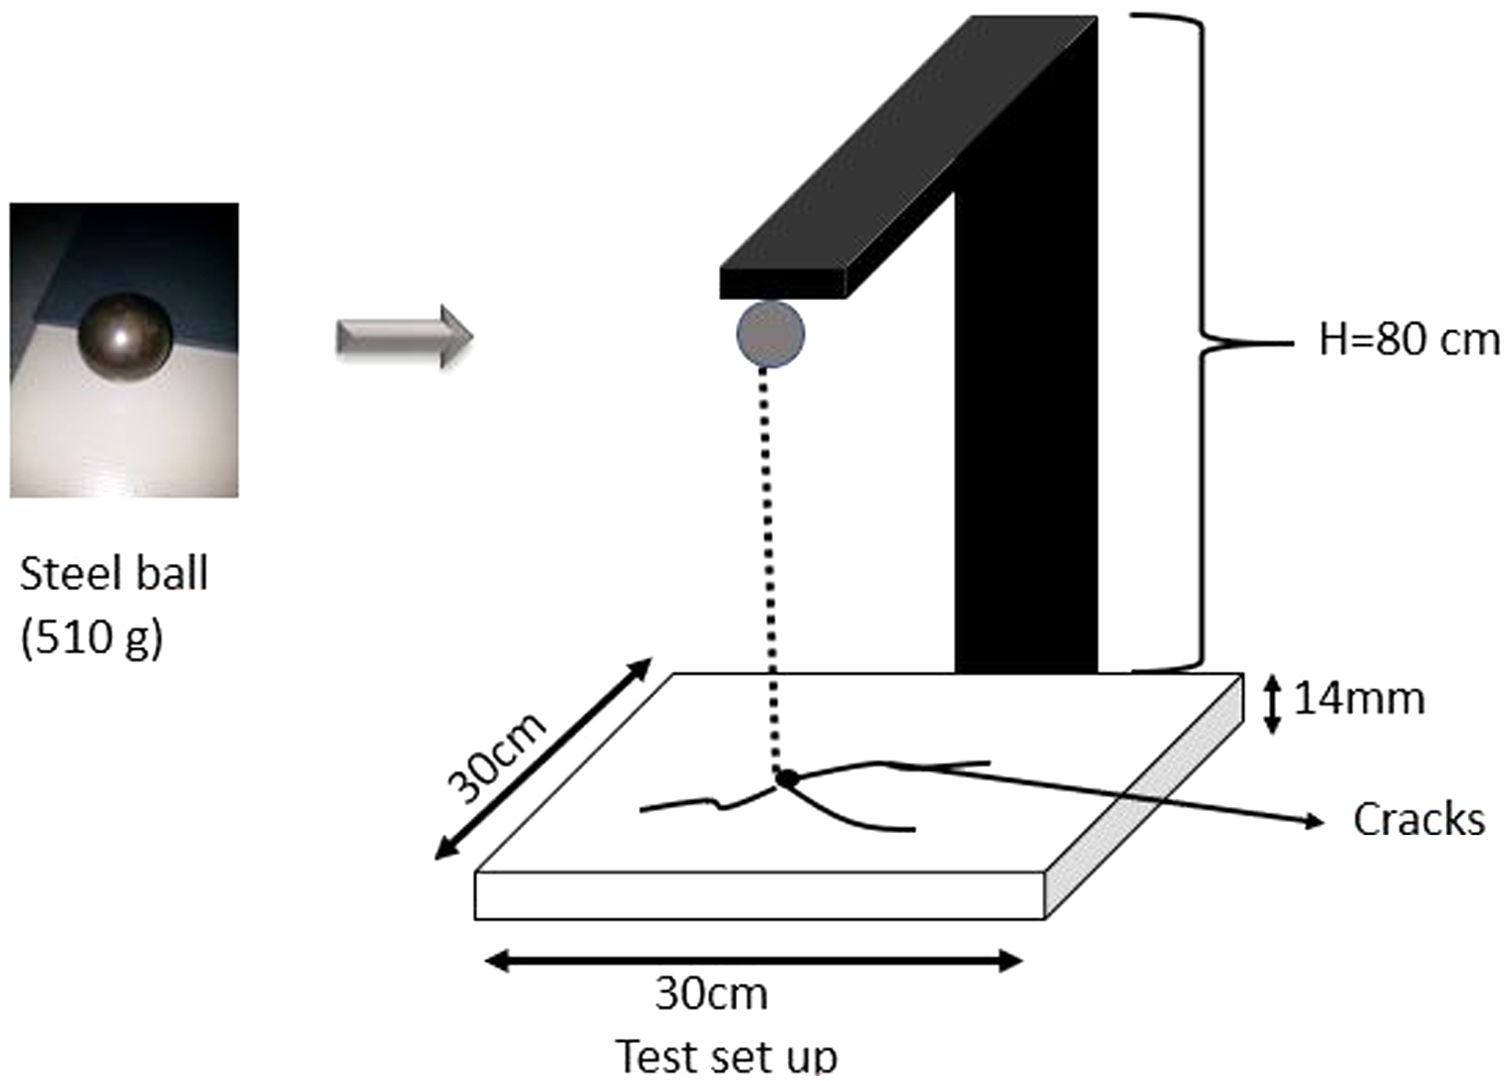
Porcelain stoneware tiles samples prepared with the different firing cycles were tested with the method stated in -CSTB-NF UPEC (French Quality Certificate) Specification No: 2898 (resistance of the tiles against the impact strength and 510g mass) standard and the results were compared. It should be emphasized that this method is not a standard impact test method for all porcelain tiles. This test method is preferred only in applications with heavily traffic areas and special certification is required by consumers for impact resistance. While performing this test, firstly the sand on the ground on which the tile will be fitted was smoothened. Tile was fitted on the sand such that there would not be any space thereunder. Initially, a focal point was formed with free fall in the region we marked as center in the tile with 50g ball. Then, 510g ball was left on the tile with free fall from 80cm. Test set up details is represented in Fig. 4. Afterwards, ink was spread by being distributed abundantly on the tile surface with the brush and distributed on the tile surface with a soft cloth. Distributed ink was cleaned by pouring alcohol on a soft cloth again. If crack is formed on the cleaned surface, the cracks formed become apparent upon filling of the ink between the cracks. Crack length is demanded to be maximum 10mm. Test is repeated for 3 times for each sample. If there are not any cracks on the surface, it means that no effect is encountered. The tile composition with no crack formation on the surface is classified as having high impact strength. All samples prepared as (20cm×20cm–14mm thickness) and impact test results were compared depend on the method.
Results and discussionTechnical and mechanical properties of the samples
Technical and mechanical properties of the samples are represented in Table 2. When the technical properties of the samples sintered by applying 5 different firing cycles (holding time at maximum temperature) are observed, F1 and F2 water absorption value is out of porcelain stoneware tiles (>0.5wt.%). With the increase of the waiting time at maximum temperature, the firing shrinkage of the samples increased and this increment continued up to the 2.54g/cm3 density value after a decrease in the density value was observed with the F5 sample. This decrease can be associated with porosity values. While the total porosity value of the F1 sample was 14%, this value decreased to 8% for the F4 sample. The increase of the waiting time at maximum temperature to 25min for F5 sample, this value reached 12.8% with a further increase. The highest bending strength and elasticity modulus value was obtained by decreasing the amount of porosity up to 8% with the F4 sample. When the relationship between mechanical properties and impact resistance was evaluated, it should be emphasized that only F4 sample with a breaking strength higher than 75MPa passed the impact test. It can be said that there is a critical threshold in terms of impact resistance, especially for samples which have bending strength greater than 75MPa.
Comparison of the technical properties of the compositions.
| Properties | Samples (mean) (S.D.) | ||||
|---|---|---|---|---|---|
| F1 | F2 | F3 | F4 | F5 | |
| Water absorption (wt.%) | 0.1±0.05 | 0.09±0.01 | 0.02±0.01 | 0.01±0.01 | 0.05±0.01 |
| Firing shrinkage (%) | 5.9±0.1 | 6.5±0.1 | 7.2±0.1 | 7.6±0.1 | 9.7±0.1 |
| Total porosity (%) | 14±0.2 | 11.2±0.2 | 10±0.2 | 8±0.2 | 12.8±0.2 |
| Open porosity (%) | 11±0.2 | 7.3±0.2 | 5.5±0.2 | 4.7±0.2 | 6.2±0.2 |
| Bulk density (g/cm3) | 1.95±0.5 | 2.01±0.5 | 2.2±0.5 | 2.54±0.5 | 2.35±0.5 |
| Bending strength (MPa) | 53.2±1.0 | 59.6±1.0 | 70.4±1.0 | 76.8±1.0 | 70.3±1.0 |
| Elastic modulus (GPa) | 63.5±0.5 | 69.2±0.5 | 69.5±0.5 | 75.3±0.5 | 68.2±0.5 |
S.D*: standard deviation.
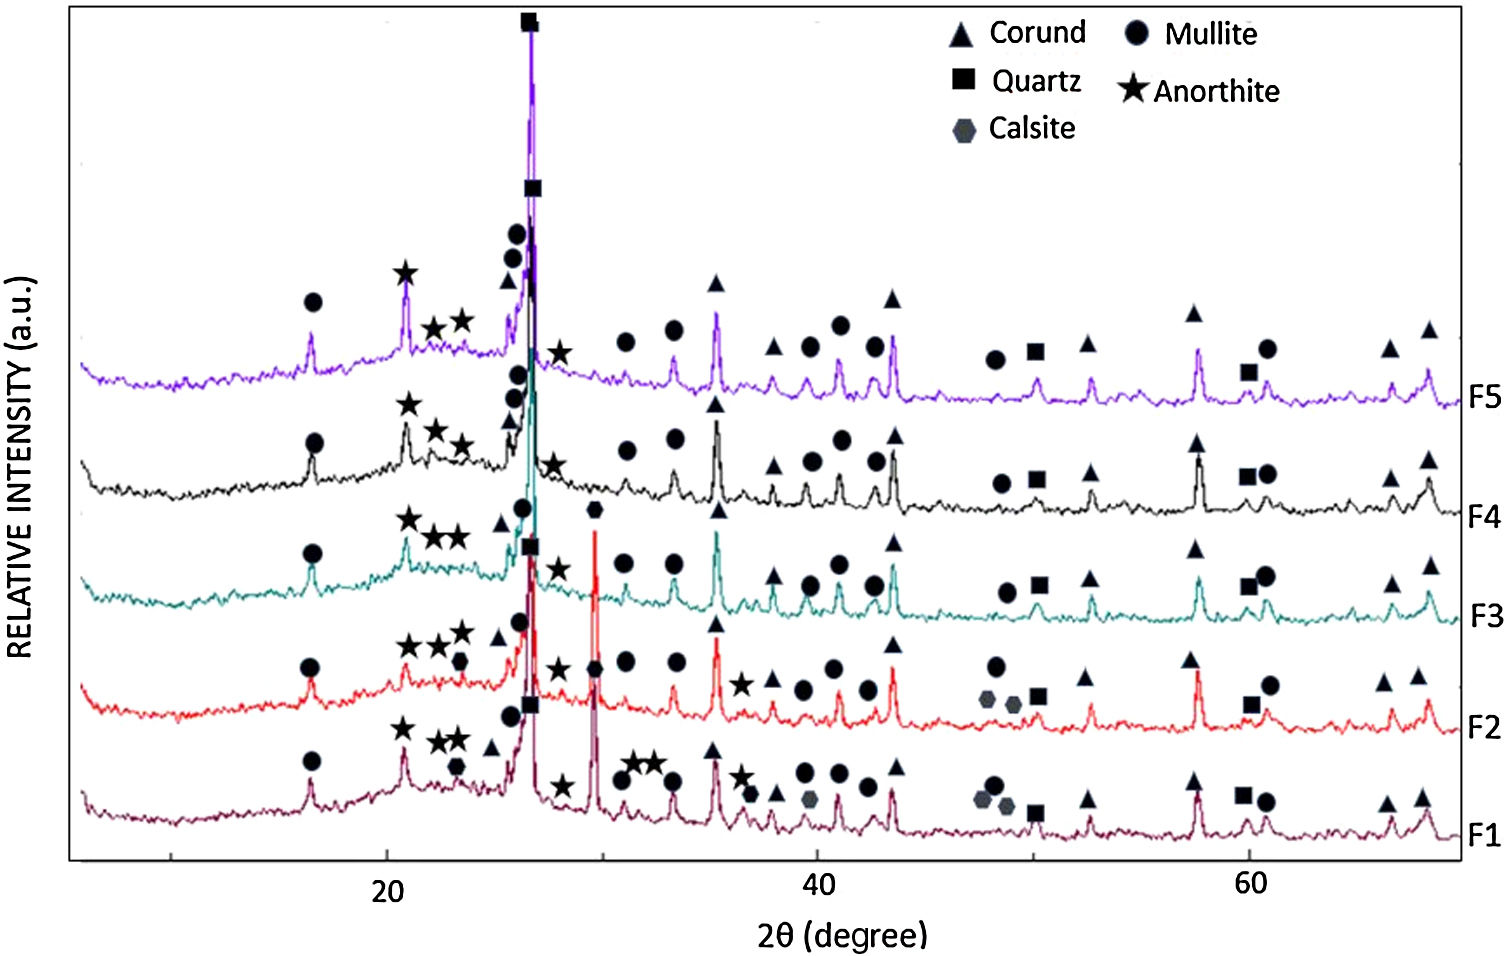
The crystalline phase composition of sintered samples were obtained by XRD analyses (Fig. 5). For F1 and F2 compositions, major phases were mullite, corundum, anorthite, calcite, and quartz. The major phases for F3, F4 and F5 samples were corundum, mullite, quartz and anorthite phases. It is surprising to see calcite phase in F1 and F2 samples fired at 1220°C. In general, primary calcite is related to low firing temperatures (750–800°C), which does not allow the calcite phase formation in porcelain tile body which is fired at high temperatures. However, size of the granules, firing time, temperature and atmosphere have a critical role for the calcite stability. Depending on the origin, secondary calcite can be reformed in the ceramic bodies. Reformed calcite crystallizes from free lime produced from the initial calcite which can be form of the fine particles or coarse granules. Presence of the reformed calcites shows that the primary calcite decomposed during firing due to heating above the decarbonization temperature [13–15]. Inadequate time and temperature for the reactions and excess amount of calcite cause to Ca-silicates (such as anorthite etc.) together with reformed calcite [15]. For these reasons for F1 and F2 samples may have calcite phases in the bodies. When the holding time at peak temperature greater than 15min, the calcite phase was not observed in F3, F4 an F5 samples and anorthite phase observed with other phases. Calcium, which comes from calcite, has been helped the formation of anorthite phase with an increase in holding time at peak temperature. In order to progress the results in more detail, quantitative analysis was also performed. The results are shared in Table 3. Increment of the holding time at peak temperature, calcite peaks disappear and it transformed anorthite phases. This effect caused the increase of anorthite phase amount in F3, F4 and F5 samples. With the increase of waiting time at maximum temperature, there was also a change in the amount of corundum phase in the compositions. The amount of the corundum phase decreased with increasing sintering time. In addition to this, the increase in the waiting time at maximum temperature caused a considerable increase in the amount of the mullite phase, while the amount of glassy phase decreased with the increasing density. On the other hand, increased the soaking time leads to increased quartz dissolution and decreased quartz content.

Phase compositions of porcelain stoneware tiles depend on the firing cycle.
| Phases and their content (wt.%) | F1 | F2 | F3 | F4 | F5 |
|---|---|---|---|---|---|
| Quartz | 17.3 | 16.3 | 15.6 | 12.3 | 11.0 |
| Corundum | 2.5 | 2.0 | 1.8 | 1.5 | 1.2 |
| Anorthite | 2.5 | 4.0 | 5.6 | 5.8 | 6.7 |
| Mullite | 1.8 | 3.0 | 7.0 | 13.5 | 17.8 |
| Glassy phase | 72.4 | 71.7 | 70.0 | 66.9 | 63.3 |
| Calcite | 3.5 | 3.0 | – | – | – |
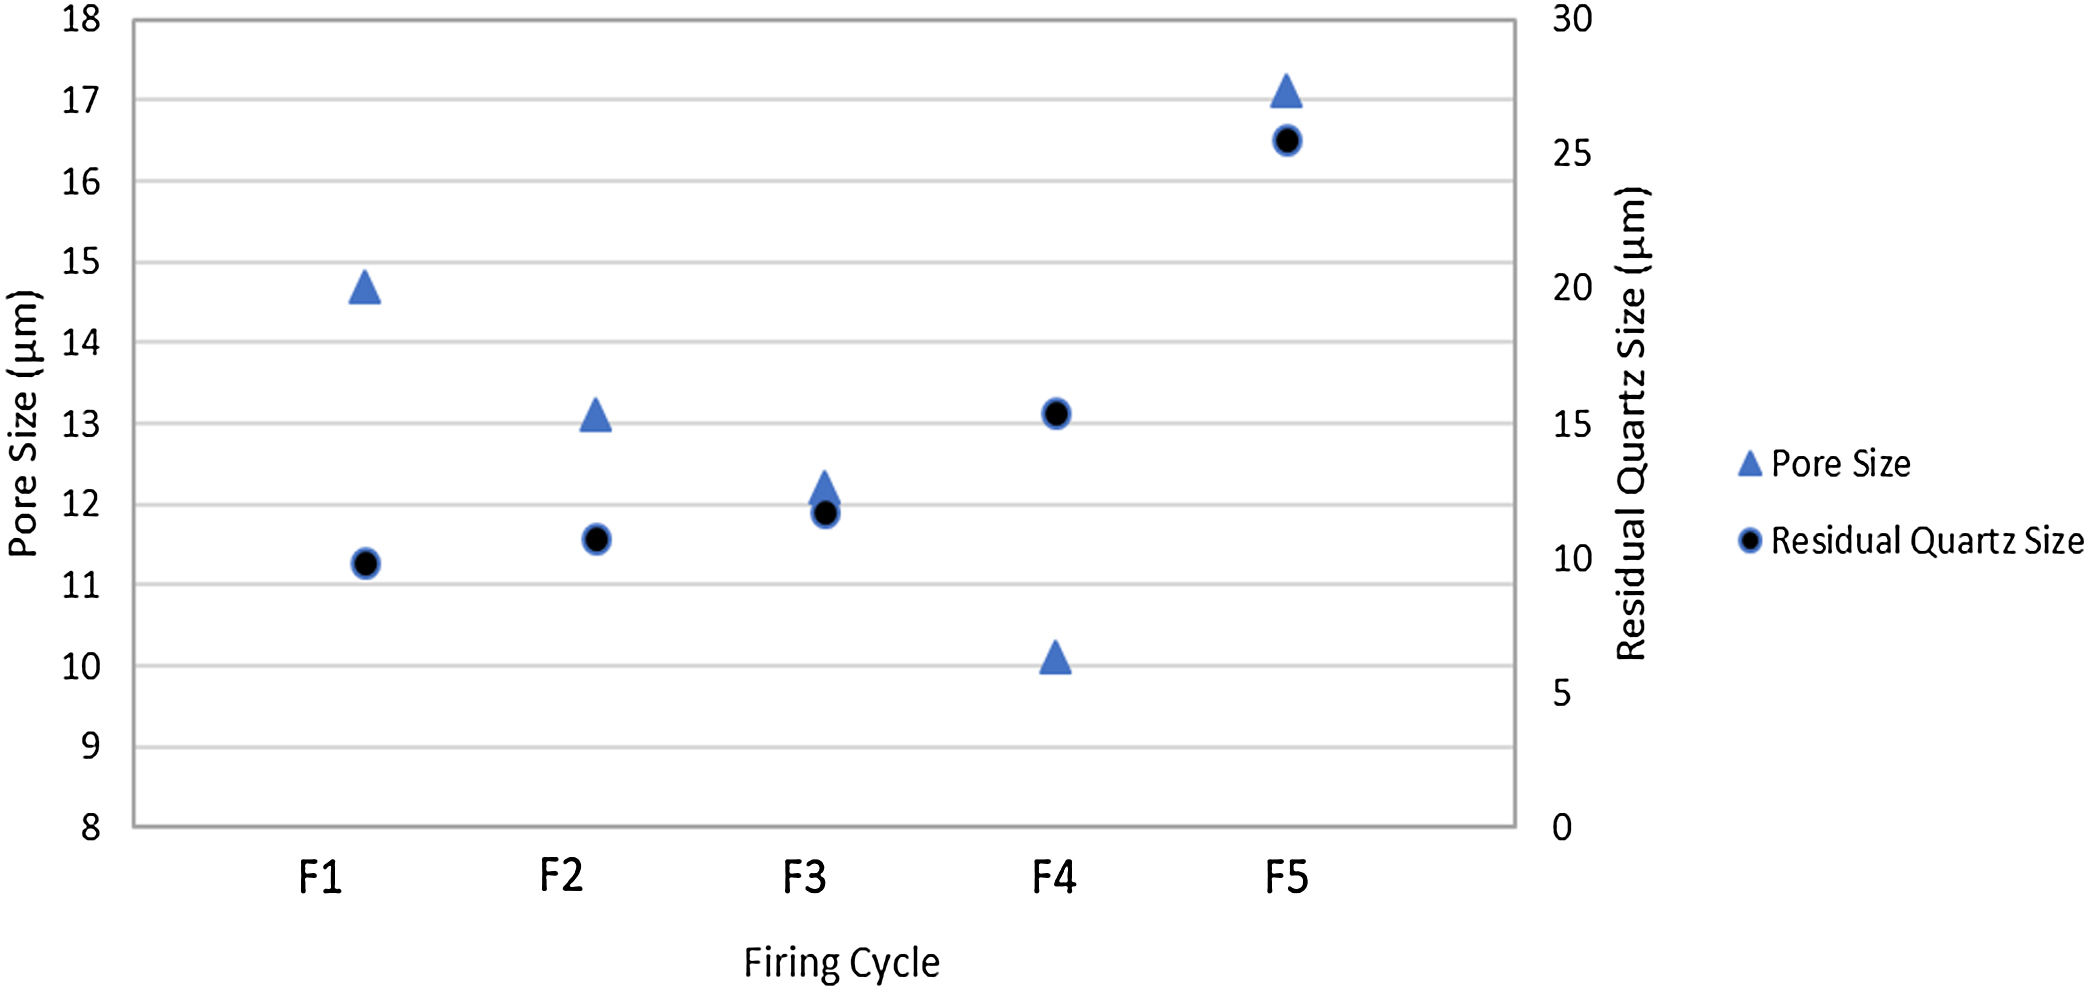
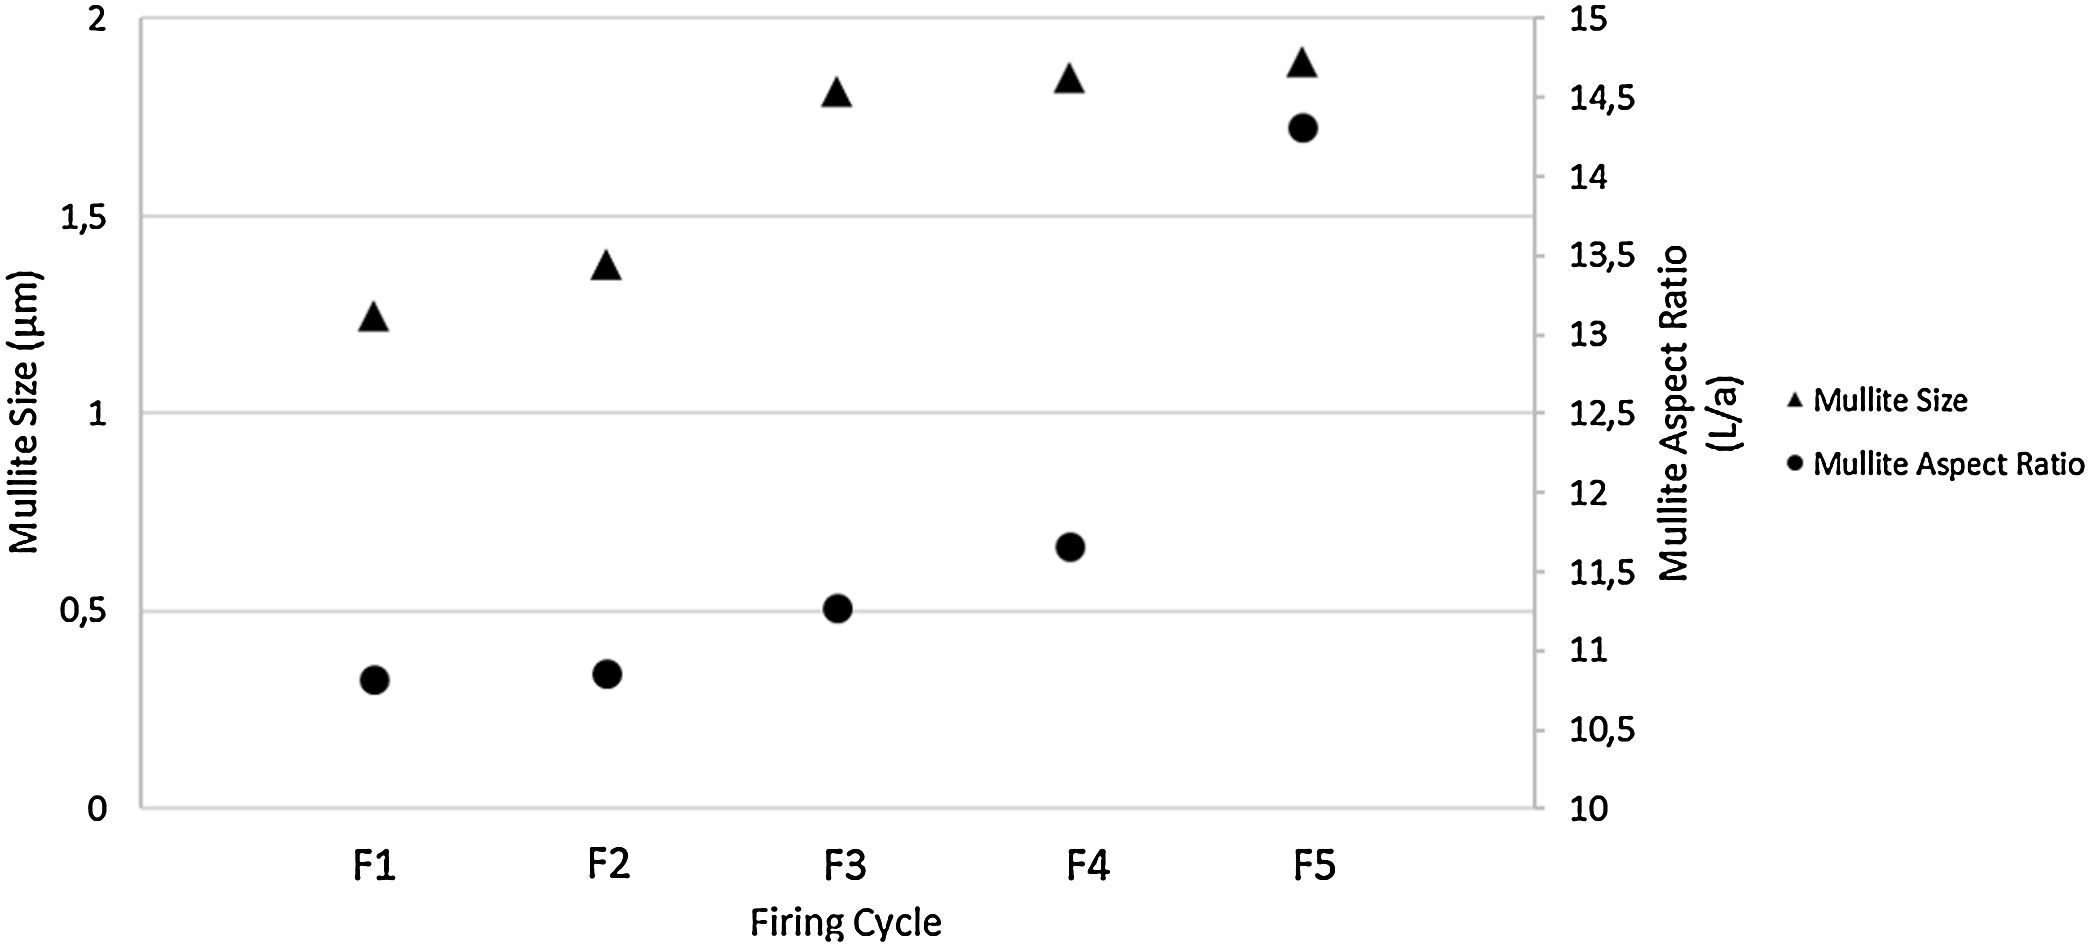
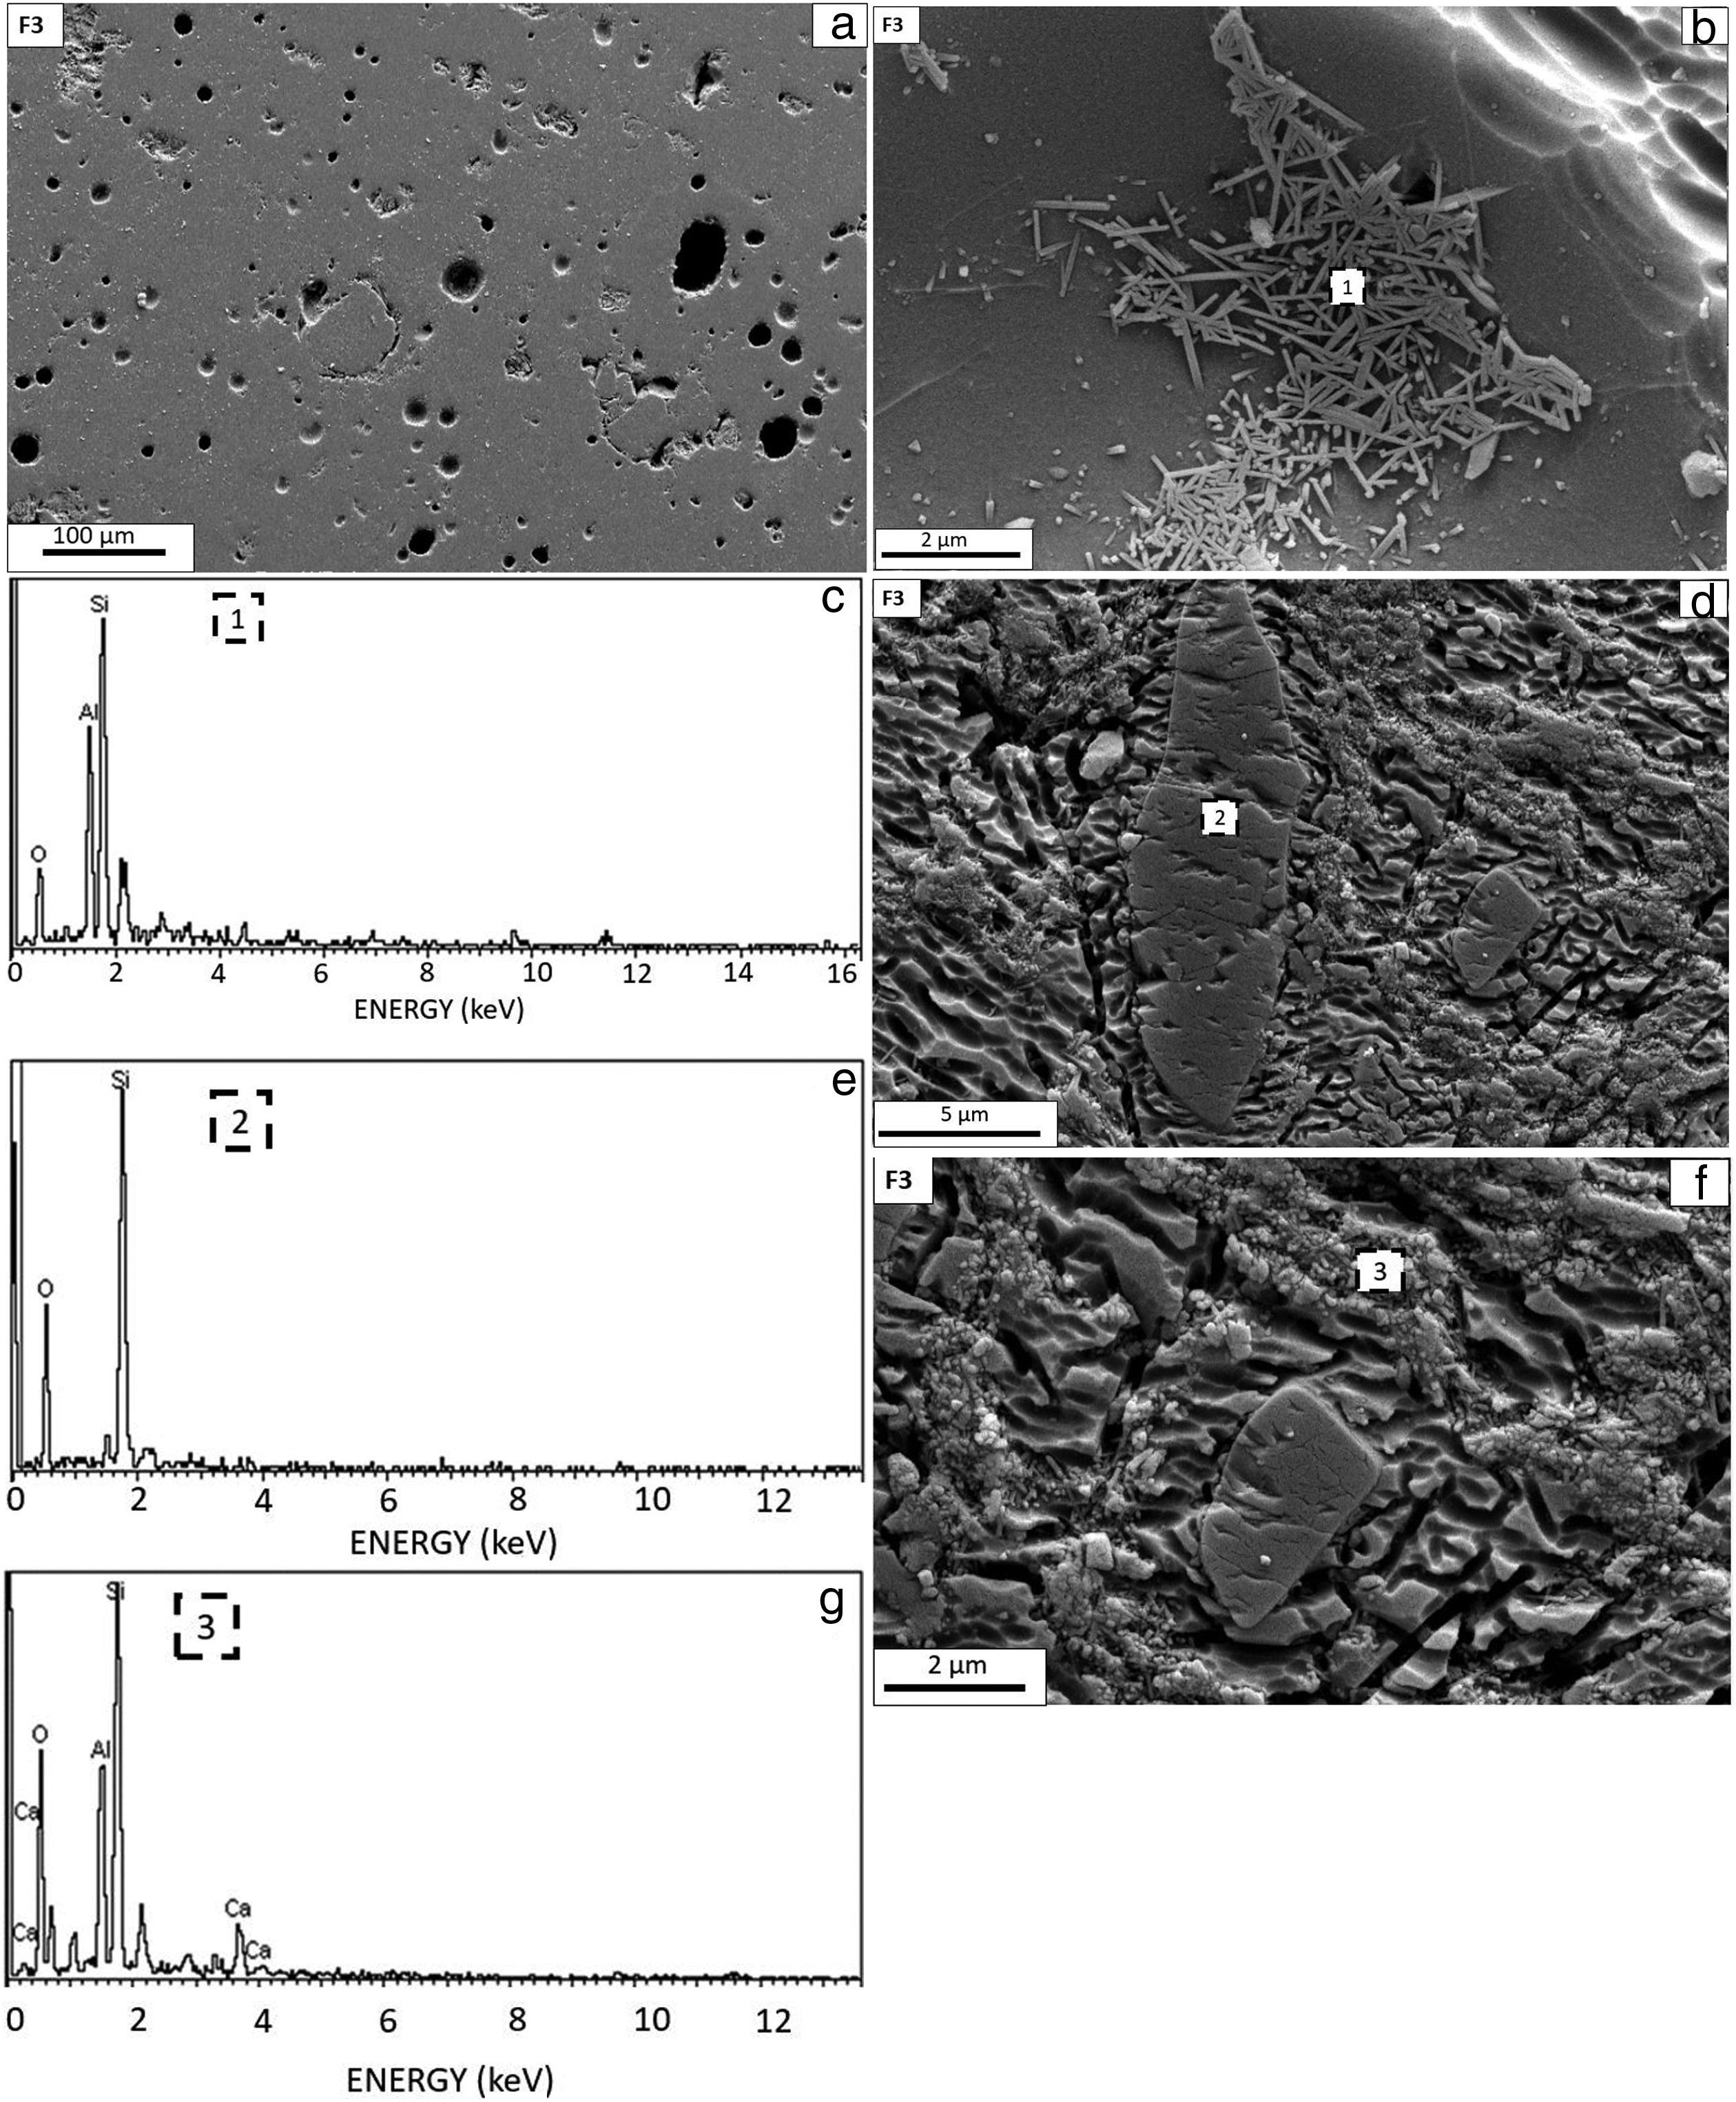
In the porcelain stoneware tiles, the effect of the amount and dimensions of the crystalline phases was emphasized in order to see the effect of the microstructure on the impact strength. In particular, microstructural analyzes were carried out to observe the change in the maximum temperature dwell time parameter in the crystalline phases. The first of the microstructural feature examined is the change of pore size and residual quartz size in the microstructure depending on the holding time at peak temperature. This change is shown in Fig. 6. While the average pore size tends to decrease in F1, F2, F3 and F4 samples, the pore size in the F5 sample is increasing and it can be explained by pore coarsening effect for this sample. In addition to pore size parameter, average residual quartz size was investigated (Fig. 6). With the increase of duration time at maximum temperature, the amount of residual quartz decreases, but the average residual quartz size increases. This can be explained as follows: The average quartz grain size appears to have increased due to the increased dissolution of small quartz grains. It is noteworthy that increasing average mullite size with increasing holding time at the peak temperature (Fig. 7). In addition, average aspect ratio value of the mullite particles increases directly. In the F1 sample, the average mullite size and aspect ratio are 1.2μm and 11.2, while in the F5 sample these values increased to 1.82μm and 14.3, respectively. Detailed SEM and EDX analyzes of F3, F4 and F5 samples are given in Figs. 8–10. Since the water absorption values of F1 and F2 samples are higher than 0.05wt.%, SEM/EDX analyzes of F3, F4 and F5 samples are included. Fig. 8 shows SEM images and EDX results of sintered F3 sample. Fig. 8(a) shows general surface microstructure of the F3 sample. Fig. 8(b), (d) and (f) microstructures belong to etched samples, and Fig. 8(c), (e) and (g) are EDX analyses of these microstructure respectively. In Fig. 8(b), mullite (1) region was detected, corresponding to the acicular shape (needle like), has high contents of Al and Si. In Fig. 8(d), (2) region was specified as quartz (SiO2) owing to their high Si content. Based on the high content of Ca, Al, and Si, Fig. 8(f), (3) region was attributed to anorthite (CaAl2SiO8).


 SEM image of the sintered the F3 sample, (b) SEM image of etched the F3 sample, (c) EDX analysis of the region highlighted in (1) region, (d) Different region SEM image of the etched the F3 sample, (e) EDX analysis of the region highlighted in (2) region, (f) Another different SEM image of the etched the F3 sample, (g) EDX analysis of the region highlighted in (3) region.")
(a) SEM image of the sintered the F3 sample, (b) SEM image of etched the F3 sample, (c) EDX analysis of the region highlighted in (1) region, (d) Different region SEM image of the etched the F3 sample, (e) EDX analysis of the region highlighted in (2) region, (f) Another different SEM image of the etched the F3 sample, (g) EDX analysis of the region highlighted in (3) region.
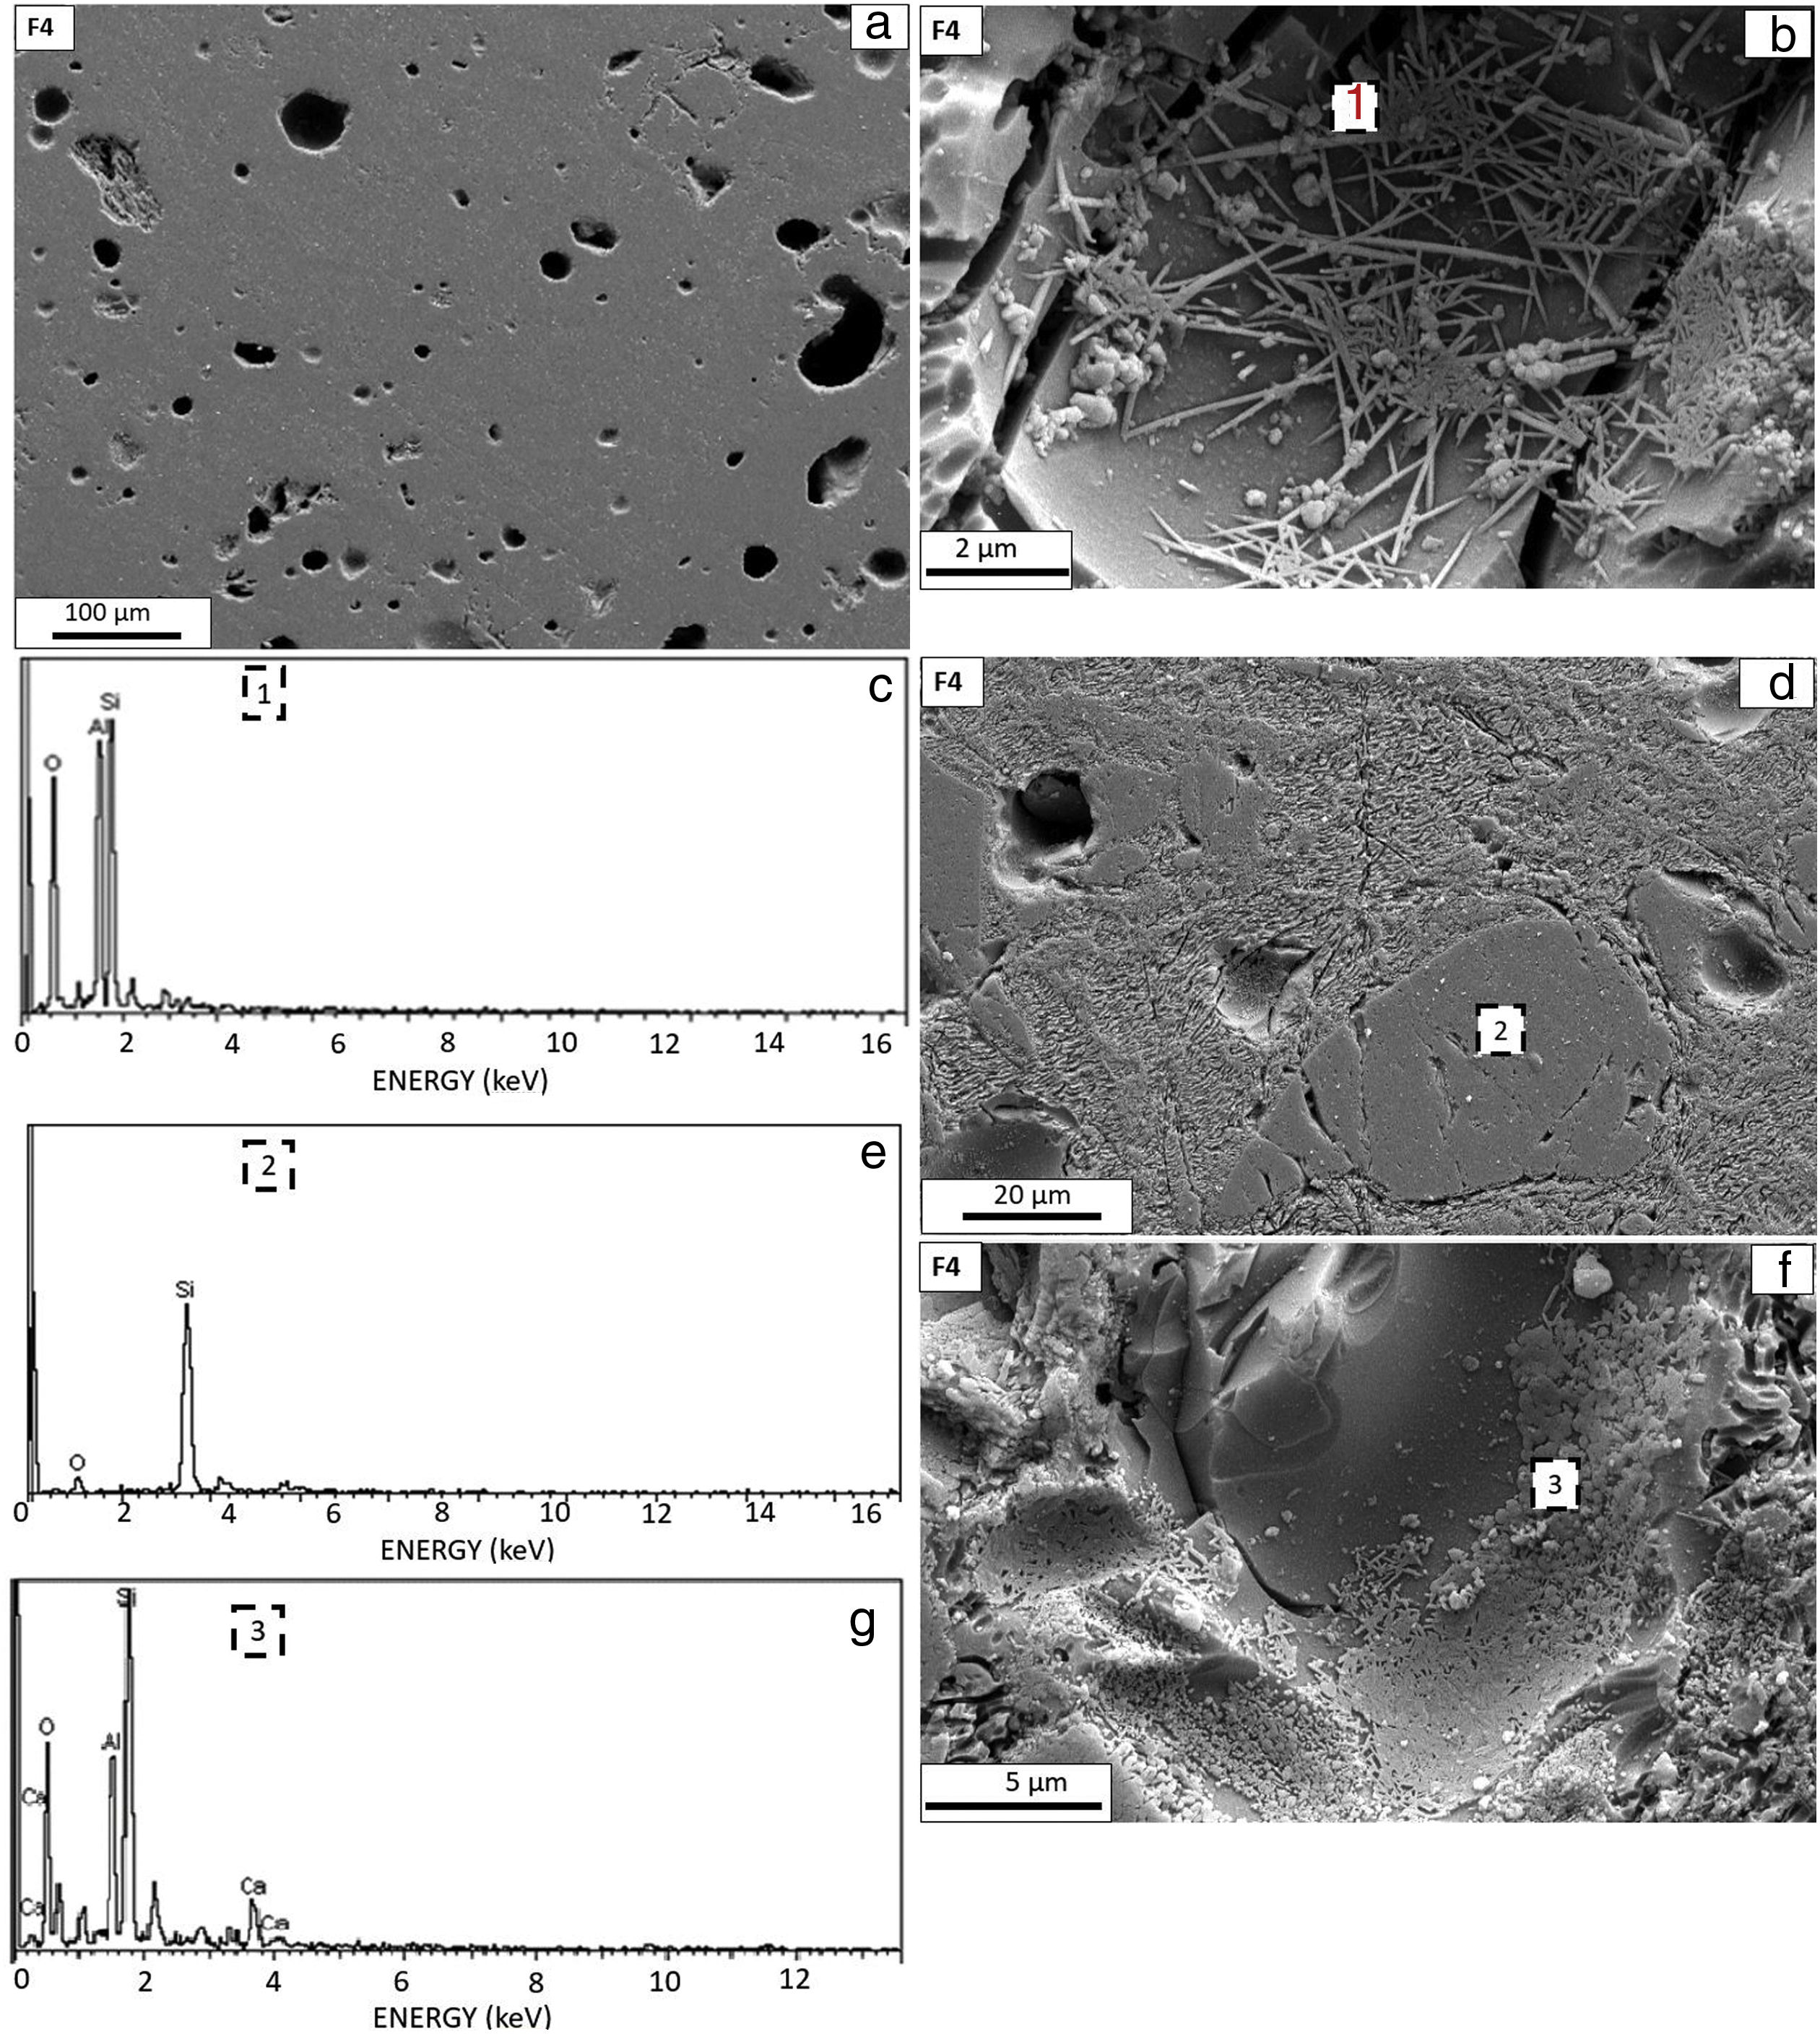
 SEM image of the sintered the F4 sample, (b) SEM image of etched the F4 sample, (c) EDX analysis of the region highlighted in (1) region, (d) Different region SEM image of the etched the F4 sample, (e) EDX analysis of the region highlighted in (2) region, (f) Another different SEM image of the etched the F4 sample, (g) EDX analysis of the region highlighted in (3) region.")
(a) SEM image of the sintered the F4 sample, (b) SEM image of etched the F4 sample, (c) EDX analysis of the region highlighted in (1) region, (d) Different region SEM image of the etched the F4 sample, (e) EDX analysis of the region highlighted in (2) region, (f) Another different SEM image of the etched the F4 sample, (g) EDX analysis of the region highlighted in (3) region.
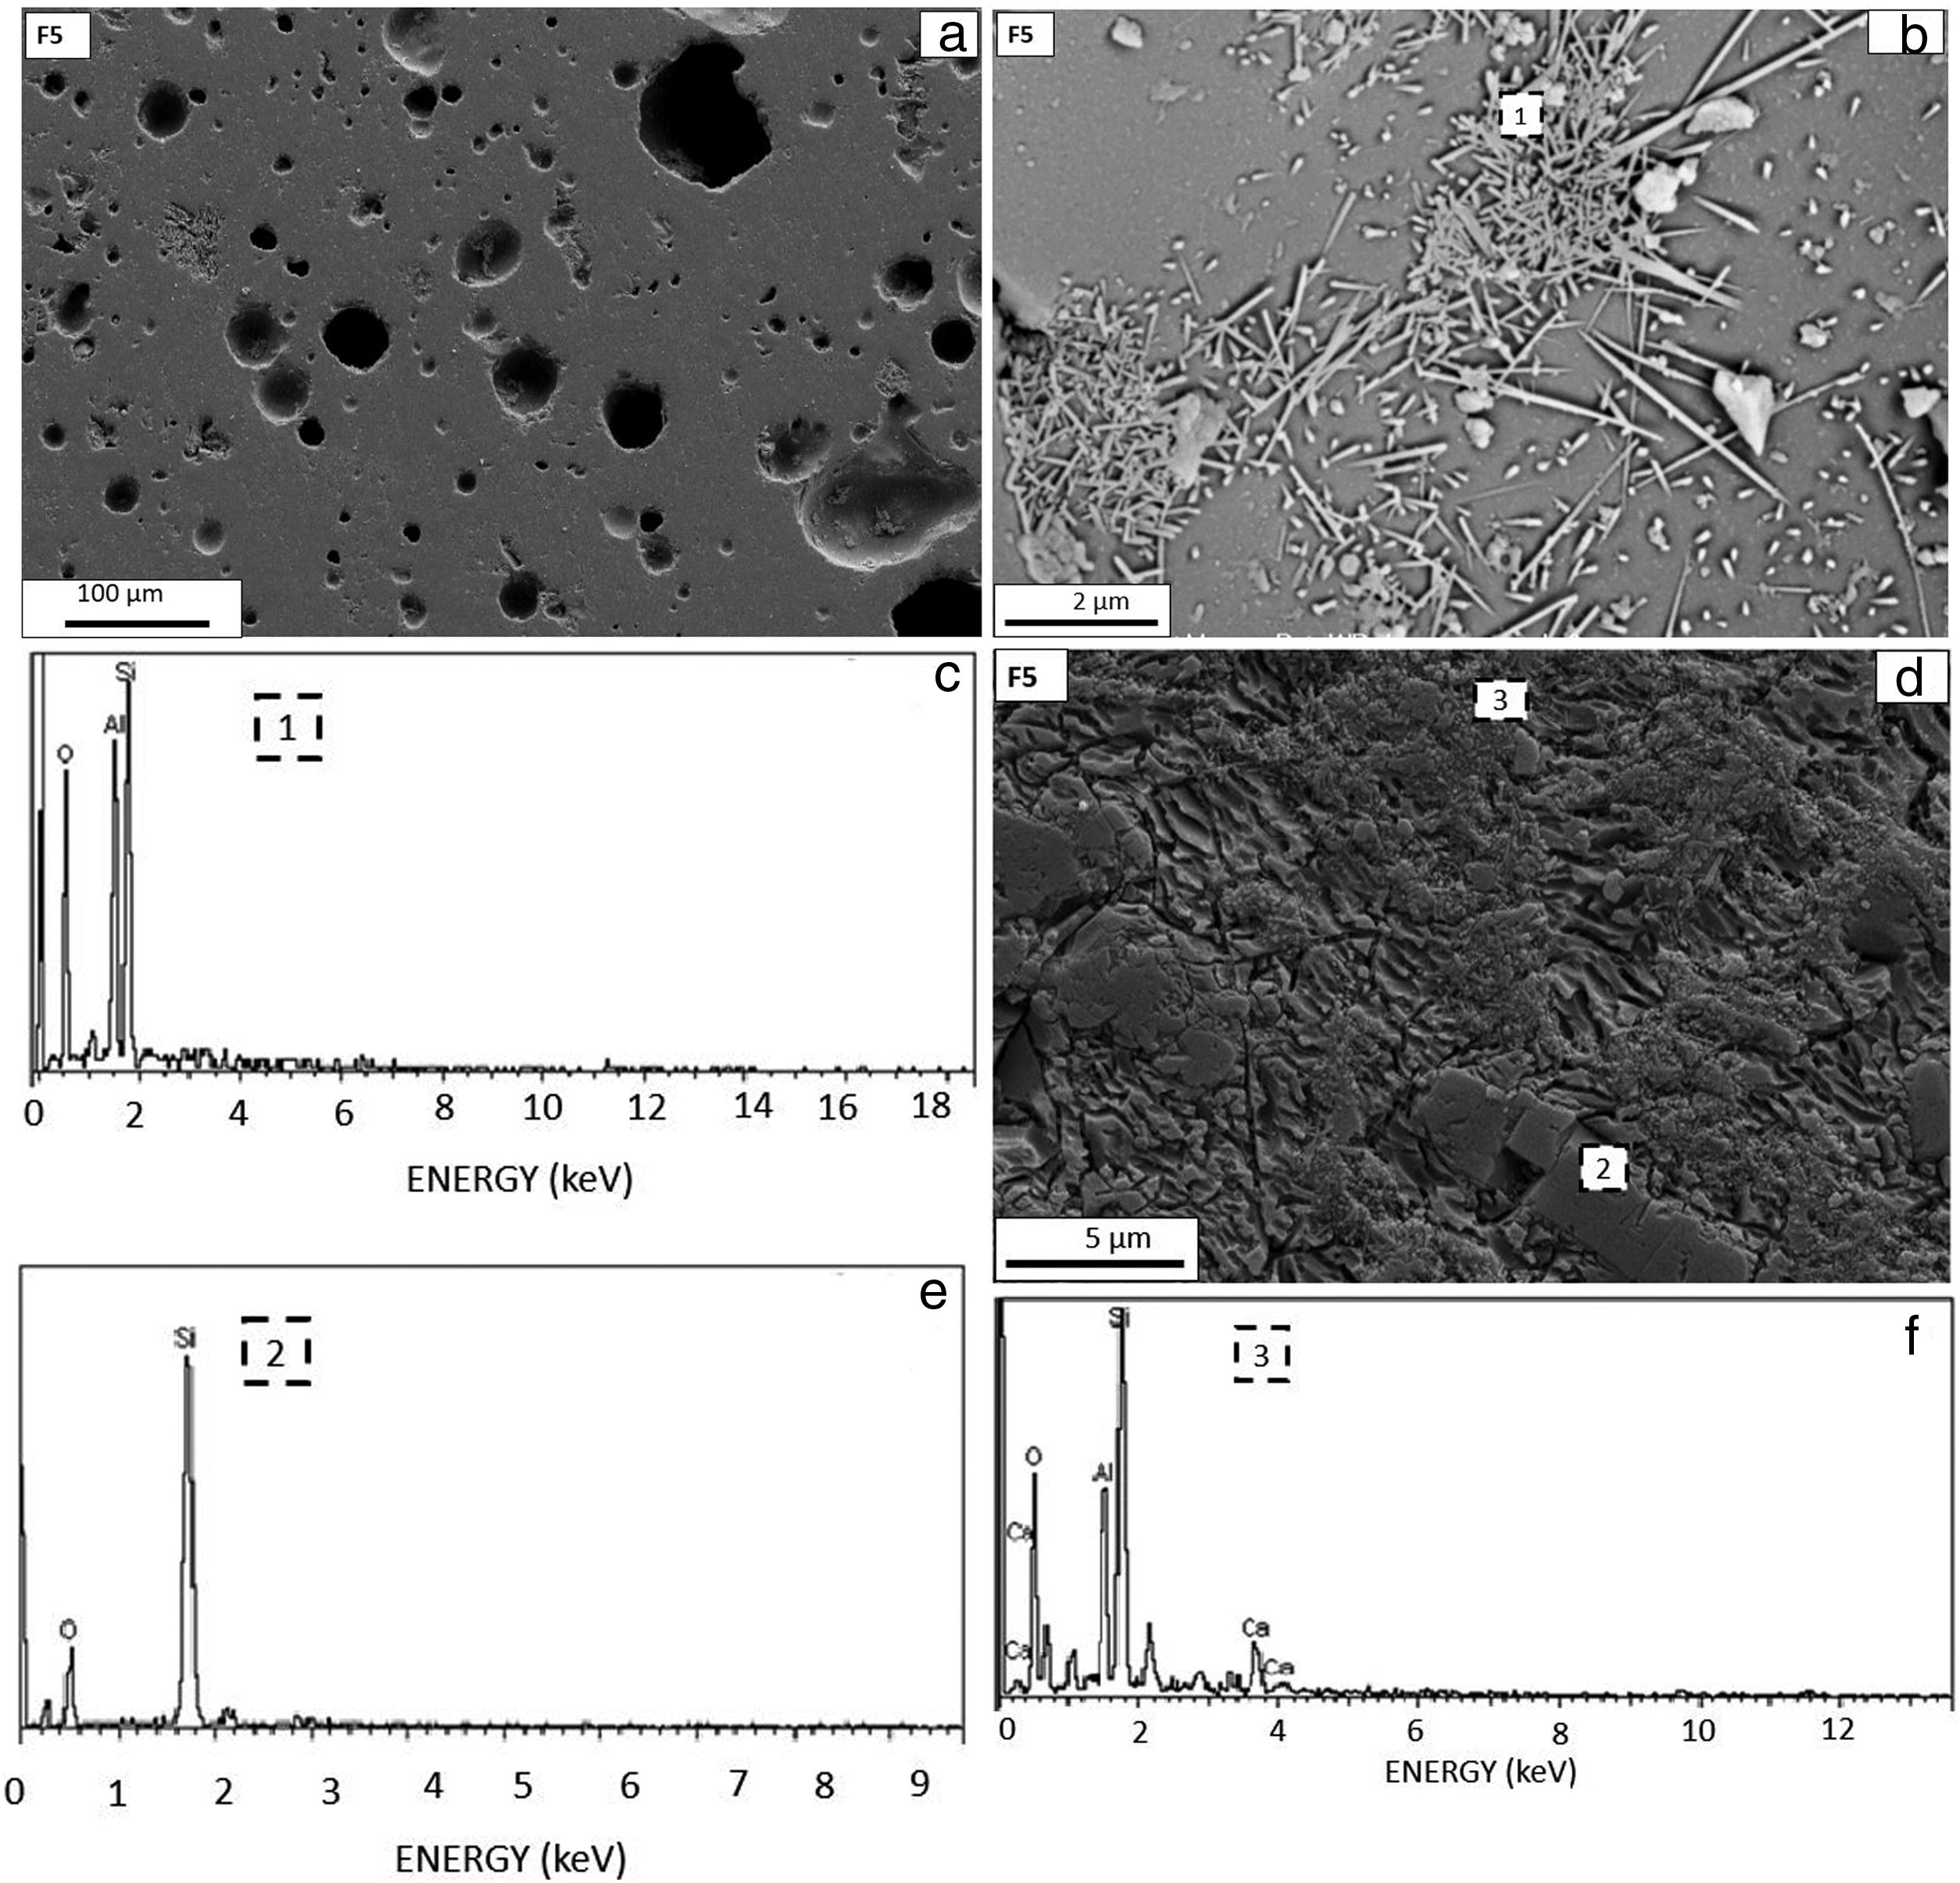
 SEM image of the sintered the F5 sample, (b) SEM image of etched the F5 sample, (c) EDX analysis of the region highlighted in (1) region, (d) Different region SEM image of the etched the F5 sample, (e) EDX analysis of the region highlighted in (2) region, (f) EDX analysis of the region highlighted in (3) region.")
(a) SEM image of the sintered the F5 sample, (b) SEM image of etched the F5 sample, (c) EDX analysis of the region highlighted in (1) region, (d) Different region SEM image of the etched the F5 sample, (e) EDX analysis of the region highlighted in (2) region, (f) EDX analysis of the region highlighted in (3) region.
Fig. 9 shows SEM images and EDX results of sintered F4 sample. Fig. 9(a) shows general surface microstructure of the F4 sample. Fig. 9(b), (d) and (f) microstructures belong to etched samples, and Fig. 9(c), (e) and (g) are EDX analyses of these microstructure respectively. In Fig. 9(b), (1) region is detected, corresponding to the acicular shape (needle like), has high contents of Al and Si, this crystals are defined as mullite crystals. In Fig. 9(d), (2) region is specified as quartz (SiO2) owing to their high Si content. In Fig. 9(f), (3) region is attributed to anorthite (CaAl2SiO8), due to the high content of Ca, Al, and Si. Comparing Figs. 8(a) and 9(a), with duration time at the peak temperature reached 20min, it is observed that the pores are getting smaller. When comparing the mullite crystals, For F4 has longer mullite crystals (Fig. 9(b)) than F3 sample (Fig. 8(b)). Fig. 10 shows SEM images and EDX results of the sintered F5 sample. Fig. 10(a) shows the general surface microstructure of the F5 sample. Fig. 10(b) and (d) microstructures belong to etched samples, and Fig. 10(c), (e) and (f) are EDX analyses of this microstructure respectively. In Fig. 10(b) is specified as the mullite region (1). In Fig. 10(d), (2) region is specified as anorthite (CaAl2SiO8), and (3) region is attributed as quartz (SiO2). With duration time at the peak temperature has reached to 25min, it is observed that the pores are getting bigger when comparing F4 samples (Fig. 9(a)). Total porosity initially decreases with increasing holding time at the peak temperature. However, when holding time at the peak temperature higher than 20min results in higher total porosity and bigger pores probably due to the bloating effect. On the other hand, the F5 sample has longer mullite crystals than the F4 sample, and aspect ratio value also increases.
Impact resistance of the samplesIn this study, the waiting time at the maximum temperature was gradually extended to the samples, and the changes in the size, pore sizes and technical properties of the crystalline phases they had were examined. In order to examine the effect of these effects on the impact resistance of porcelain stoneware tiles, samples were prepared with a production scale in the size and thickness suitable for the impact resistance test. Since the water absorption value of F1 and F2 samples was higher than 0.5%, they had not been subjected to impact resistance test. Impact resistance test results are given in Table 4. As it can be seen from Table 4, in F3 samples, when the ball fell down to the tile surface, 3 cracks formed with larger than 10mm. There was not any crack formation on second F3 sample. Then, cracks formed on third sample surface and cracks’ size were greater than 10mm. As a result, the impact resistance test of F3 samples are negative. When evaluate the impact test result of the F4 sample, no crack formation was observed in all 3 samples tested. The result of the impact resistance test is positive. For F5 sample, during impact resistance test crack formation was observed for all samples. All cracks’ dimensions are larger than 10mm. The impact strength test result is negative for this composition (F5).
Comparison of the impact resistance test results of the composition according to CSTB-NF UPEC (French Quality Certificate) Specification No: 2898.
| Samples(Dimension: 20cm×20cm)(Thickness: 14cm) | Test results | |||
|---|---|---|---|---|
| Crack numbers (crack size >10mm) | Crack numbers (crack size <10mm) | No crack formation | Impact rest evaluation | |
| F3 (1. Sample) | ✓(3 cracks formation) | – | – | Negative |
| F3 (2. Sample) | – | – | ✓ | |
| F3 (3. Sample) | ✓(3 cracks formation) | – | – | |
| F4 (1. Sample) | – | – | ✓ | Positive |
| F4 (2. Sample) | – | – | ✓ | |
| F4 (3. Sample) | – | – | ✓ | |
| F5 (1. Sample) | ✓(3 cracks formation) | – | Negative | |
| F5 (2. Sample) | ✓(3 cracks formation) | – | – | |
| F5 (3. Sample) | ✓(3 cracks formation) | – | – | |
Considering the impact resistance test results, XRD results should also be evaluated. Crystalline phases of the F3, F4, and F5 samples, all the formed phases were the same, they were: anorthite, quartz, mullite, and corundum. Especially with the increase of the holding time at the peak temperature over the 15minutes, the formation of mullite crystals in the F4 sample has nearly doubled compared to the F3 sample.
There are some hypotheses in the literature about increasing the strength of porcelain stoneware tiles with the mullite crystals formation. One of them is “matrix reinforcement hypothesis”, it suggests that porcelain stoneware strength can be increased by the interlocking of the needle-like mullite crystals [9,10,16,17]. However, although the mullite phase in the F5 sample was quite high (17.8%), this sample still could not pass the impact resistance test (Table 4). This shows that a single crystalline phase is not effective for impact resistance behavior and many factors should be evaluated together. Especially the discontinuities in the microstructure (pores, cracks around the quartz grain, etc.) are very important in this regard. In the F4 sample, the pores’ size formed within the porcelain stoneware tile has reached the lowest level. In the F5 sample, there is a serious growth in pore size with the increase of the waiting time at maximum temperature. This can be interpreted as the increase in the waiting time at high temperatures creates “a bloating effect” and thus increases the amount of the pores and their size. In particular, the decrease in the total porosity amount in the F4 sample, the low water absorption, and the high density indicate that the F4 sample is quite sintered at this temperature and time. These properties also explain the high strength properties. In the F5 sample, although firing shrinkage reached its highest value, an increase in total porosity (%) was observed. This is another proof that more pores were formed due to the bloating effect. Since these pores created discontinuities in the structure, therefore they affected the impact resistance negatively. It is also noteworthy that the amount of glassy phase decreased in the F4 sample compared to the F3 sample. The amount of the corundum phase did not change much in F3, F4, and F5 samples. The amount of anorthite phase also increased with the increase of waiting time at maximum temperature, especially with the formation of calcite to anorthite. However, due to its microstructure like a close cluster, crystal measurements had not been performed in small anorthite crystals.
ConclusionsThe study was carried out on porcelain stoneware tiles, which have a very important market share especially in the construction & building sector. The study focused on the high impact resistant tile which are used for highly traffic areas such as airports, markets, etc. In this study, the variation of microstructural properties in porcelain stoneware tiles was determined by changing the holding time at peak temperature during sintering, and effects of these microstructural changes on impact resistance of porcelain stoneware tiles were examined. Porcelain stoneware tiles prepared by the composition denoted as N1 and 5 different holding time at peak temperature was applied to the samples. Main variation was the holding time at the peak temperatures in the firing cycles. Depending on the these firing cycles, microstructural properties such as pore size, crystalline and crystalline phases size etc. and kind and amount of the phases were investigated. F3, F4 and F5 samples showed the porcelain stoneware tile technical properties. Only the F4 samples passed the impact resistance test according to CSTB-NF-UPEC test standards. When evaluating the microstructural details, this study shows that a single crystalline phase is not effective for impact resistance behavior of the porcelain stoneware tiles and many factors should be evaluated together. Especially the discontinuities in the microstructure (pores, cracks around the quartz grain, etc.) are very important in this regard.
I would like to thank Mr. Vedat Bayrak and Mr. Ahmet Devecioglu for the helpful discussions and support for pilot production trials in Eczacibasi Vitra Tiles Factory in Bozuyuk/Turkey.
